Fractal Dimension
- Indicators
-
Jose Maria Molina Sanchez
 Developer of indicators and trading systems based on robust mathematics and quantitative logic.
 - Version: 1.0
- Activations: 5
Fractal Dimension – Market Regime Analyzer
Copyright 2025, Jose María Molina Sánchez
📧 molinatrader67@gmail.com | Version 1.00
🔍 Introduction
Financial markets do not follow linear models or normal distributions. Their behavior is complex, chaotic, and highly sensitive to initial conditions. Seemingly small events — such as rumors or news — can trigger sharp and unpredictable movements.
The Fractal Market Hypothesis offers a more realistic framework for understanding these phenomena. Unlike the classical Efficient Market Theory, this hypothesis recognizes that prices exhibit temporal autocorrelation, heavy tails in their distributions, and a self-similar statistical structure across different timeframes.
This indicator, Fractal Dimension – Market Regime Analyzer, precisely measures this fractal dimension of the market, providing an objective tool to identify whether the environment is trending or sideways, helping traders make more informed decisions.
🧮 What is the Fractal Dimension?
The fractal dimension is a value between 1 and 2 that measures the degree of "order" or "chaos" in price movement:
- < 1.5: The market is in a trend. The lower the value, the stronger and more persistent the trend.
- = 1.5: The market is completely random (no memory).
- > 1.5: The market is in a sideways range. The higher the value, the greater the volatility without a defined direction.
This value reflects the long-term memory of the price:
- A low dimension indicates positive autocorrelation: movements tend to continue.
- A high dimension indicates constant switching between ups and downs: the market oscillates without direction.
📈 How the Indicator Works
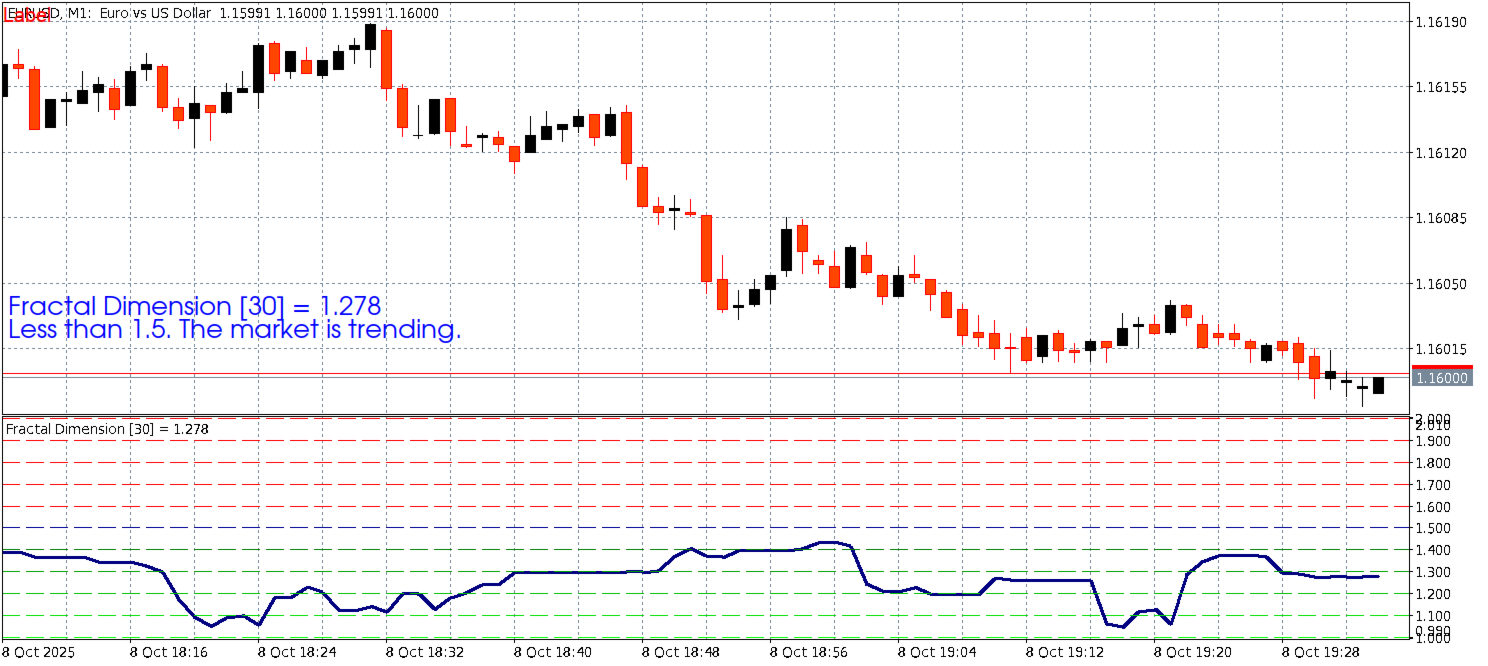
The Fractal Dimension.mq5 indicator analyzes the price time series using a user-configurable period. It presents its result in three ways:
-
In a separate window:
- Displays the current value of the fractal dimension.
- Horizontal reference lines every 0.1, from 1.0 to 2.0.
- Red zone (> 1.5): Sideways market, not recommended for trading.
- Green zone (< 1.5): Trending market. The green becomes lighter as the dimension decreases, indicating stronger trend strength.
-
In the main chart window:
- Prints the indicator name, selected period, and current value with 3 decimals.
- Example: Fractal_Dimension [13] = 1.383
-
Automatic comments:
- Clear messages about market regime:
- "The market is trending."
- "The market is moving sideways."
- Clear messages about market regime:
⚙️ Input Parameters
Period: Number of bars used to calculate the fractal dimension.
Recommendation: Adjust this value according to the asset and timeframe. A period that is too short may generate noise; one that is too long may cause delay.
💡 Key Tip: There is no universal period. It must be optimized for each asset:
- Tech stocks in prolonged trends (e.g., NVIDIA): Work better with medium periods (10–20).
- Volatile or sideways assets (e.g., XRPUSD): Try shorter periods (4–8).
🎯 Interpretation and Strategic Use
✅ Trading in a Trend
- Entry: When the fractal dimension falls below 1.5.
- Exit: When it rises above 1.5.
- Important Note: If you use a robot (EA), remember that the signal executes at the opening of the next candle. To avoid delays:
- Enter when: Current bar ≤ 1.49 and previous bar > 1.5.
- Exit when: Current bar ≥ 1.51 and previous bar < 1.5.
🔄 Combination with Other Indicators
This indicator does not generate direct buy/sell signals but acts as a market regime filter. To maximize performance, combine it with trending strategies like:
- Moving Averages (SMA, EMA)
- Parabolic SAR
- Bollinger Bands
- Envelopes
🔗 Example: Only allow your moving average system to generate signals when Fractal Dimension < 1.5.
🌐 Multi-Timeframe and Multi-Asset Analysis
As shown in the attached images, the same asset can show different regimes depending on the timeframe:
EURUSD | 1 min | 30 | ~1.3 | Trending |
EURUSD | 30 min | 30 | ~1.3 | Trending |
USDCNH | 1 min | 30 | ~1.5 | Sideways |
USDCNH | 1 min | 5 | ~1.6 | Sideways |
This demonstrates the importance of analyzing the temporal context before trading.
⚠️ Final Considerations
- Not a magic indicator: It is a tool for analysis. Requires validation through backtesting or simulation.
- Adaptability: Markets change. What works today may not work tomorrow. Review parameters periodically.
- Trade duration: Short trades may not capture enough profit. This indicator works best in medium-term strategies.
- Mandatory prior simulation: Before using it on a real account, simulate its behavior in different assets and conditions.
✅ Conclusion
Fractal Dimension – Market Regime Analyzer does not predict the future, but it reveals the hidden nature of price movement. By accurately identifying whether the market is trending or sideways, it helps you avoid one of the most costly mistakes: trading with the wrong strategy at the wrong time.
It is an essential tool for quantitative traders, EA developers, and any operator seeking to improve consistency through context analysis.
📎 Developer’s Notes
"I designed this indicator after years of research into nonlinear market dynamics. It's not just a mathematical formula, but a practical translation of how markets really work. Use it with discipline, and it will give you a real edge."
— Jose María Molina Sánchez
📞 Technical Support
For questions, suggestions, or error reports:
📧 molinatrader67@gmail.com