Parabolic SAR SR Zones
- Indicators
- Richard Barile
- Version: 2.1
- Activations: 5
Parabolic SAR SR Zones Indicator
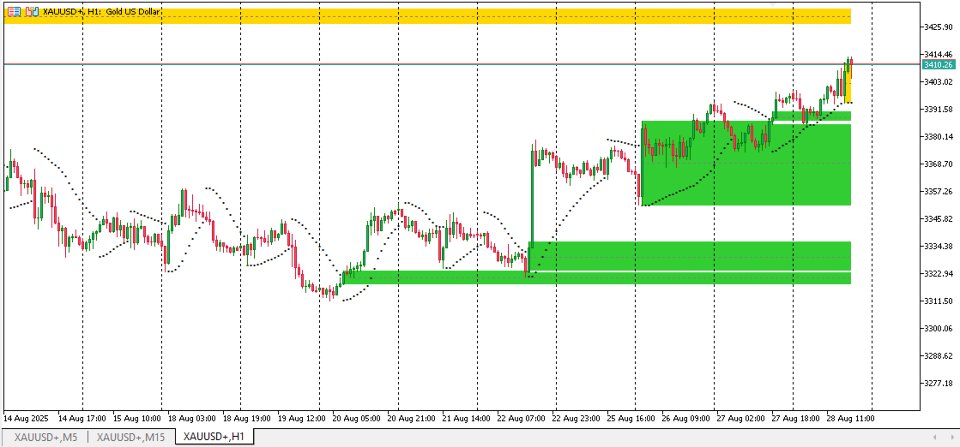
This indicator is a powerful tool for traders using MetaTrader 5 (MT5) platforms. It automatically identifies and draws support and resistance zones on your chart based on the Parabolic SAR (Stop and Reverse) technical indicator. These zones help highlight key price levels where the market might bounce (support) or reverse (resistance), making it easier to spot potential entry/exit points, set stop-losses, or plan trades. It's designed for visual clarity, with customizable colors, styles, and display options to suit different trading styles. Whether you're a beginner or experienced trader, it simplifies trend reversal detection by turning SAR signals into easy-to-read zones, reducing the need for manual drawing.
The latest version (2.1) builds on previous updates by adding a midline feature for zones (which can be toggled on/off) and improving customization for lines and styles, while fixing bugs for smoother performance. It's optimized to handle up to 500 zones without cluttering your chart, and it tracks zone "mitigation" (when a zone is broken by price), giving you insights into evolving market conditions.
How It Works and Functions
At its core, the indicator uses the Parabolic SAR—a popular trend-following tool that plots dots above or below price bars to signal potential reversals. Here's a simple breakdown of its functionality:
-
Detecting Reversals and Creating Zones:
-
The indicator monitors the Parabolic SAR dots. When the SAR switches sides (e.g., from above the price to below, or vice versa), it signals a potential trend reversal.
-
At that reversal point, it creates a "zone" based on the high and low prices of the bar where the switch happens.
-
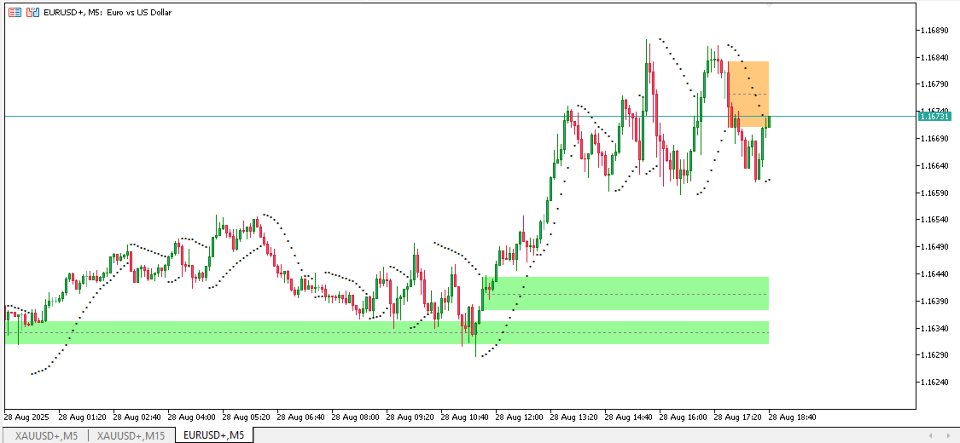
If the SAR dot is below the price (indicating an uptrend), the zone is marked as bullish support (a potential floor where prices might bounce up).
-
If the SAR dot is above the price (indicating a downtrend), the zone is marked as bearish resistance (a potential ceiling where prices might drop).
-
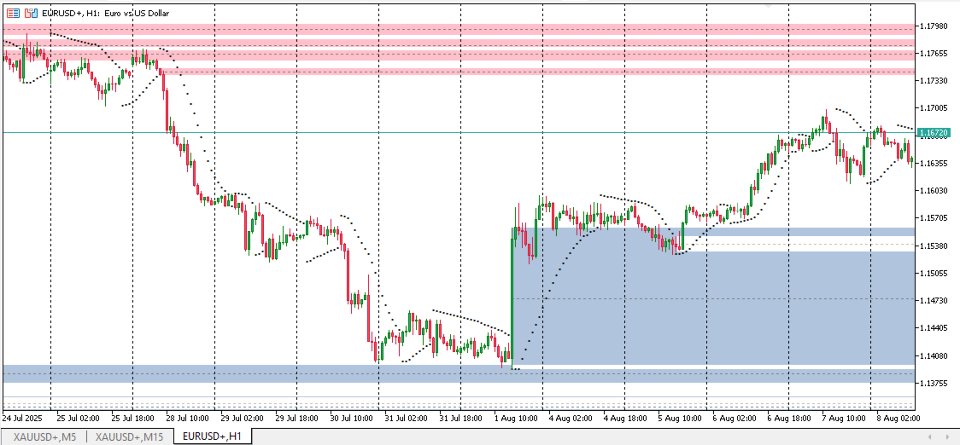
These zones appear as horizontal rectangles on the chart, extending from the reversal time to the right (current time) until they're "mitigated" or the chart ends.
-
Zone Mitigation (Breaking the Zone):
-
Zones aren't permanent—they can be "mitigated" (invalidated) when the price closes decisively beyond the zone's boundaries.
-
For a bullish support zone, it's mitigated if the price closes below the zone's low.
-
For a bearish resistance zone, it's mitigated if the price closes above the zone's high.
-
Once mitigated, the zone stops extending forward. You can choose to keep showing these mitigated zones for historical reference or hide them to keep the chart clean.
-
This feature helps track how strong a zone is: Unmitigated zones are "active" and potentially more reliable, while mitigated ones show where the market has broken through.
-
Display and Management:
-
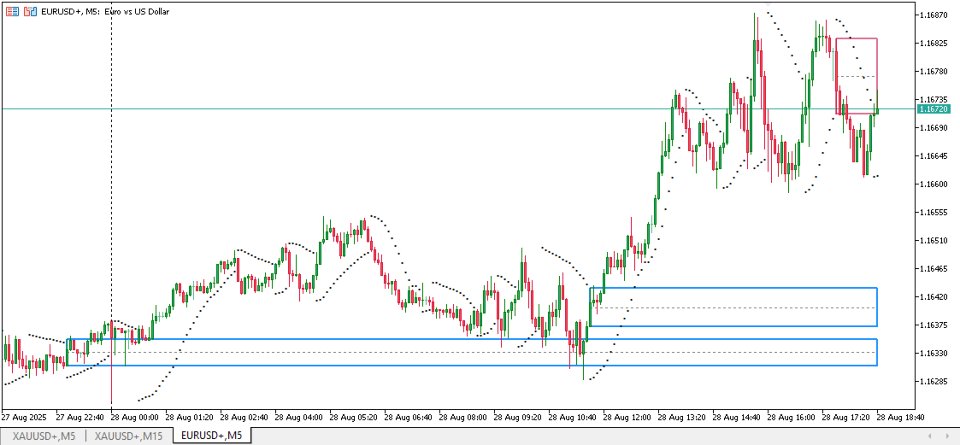
Zones are drawn as filled or outlined rectangles for easy visibility.
-
An optional midline (a dotted or solid line through the center of the zone) can be shown to highlight the average price level within the zone, useful for midpoint targeting in trades.
-
To prevent chart overload, it limits the number of visible zones (default up to 500), automatically removing the oldest ones if needed.
-
It works across different timeframes and updates in real-time as new bars form, but clears and resets zones if you switch timeframes to ensure accuracy.
-
No internet or extra installations needed—it runs directly in MT5 using built-in SAR calculations.
Overall, this indicator functions as an automated "zone drawer" that turns SAR reversals into actionable support/resistance levels. It helps traders visualize market structure without manual analysis, spot breakouts (via mitigation), and customize visuals for better decision-making. It's especially useful in trending markets or for strategies like breakout trading, swing trading, or combining with other indicators like moving averages.
Input Parameters and Their Functions
The indicator offers several customizable inputs to tailor it to your preferences. Here's what each one does, explained simply:
-
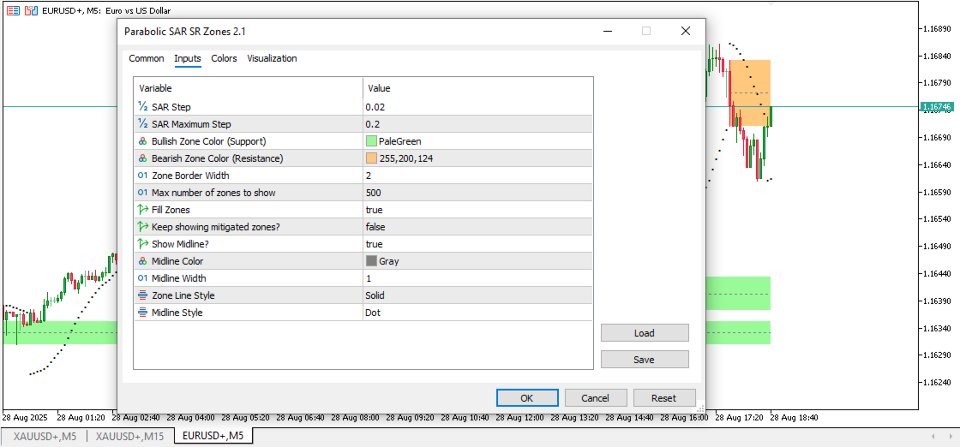
SAR Step (InpSARStep, default: 0.02): Controls how quickly the Parabolic SAR accelerates as the trend strengthens. A smaller value makes the SAR more sensitive to price changes (faster reversals and more zones), while a larger one makes it slower and smoother (fewer but potentially stronger zones).
-
SAR Maximum Step (InpSARMax, default: 0.2): Sets the maximum acceleration limit for the SAR. This caps how aggressive the SAR gets in strong trends, helping avoid over-sensitivity in volatile markets.
-
Bullish Zone Color (InpBullishZoneColor, default: Light Green - C'152,251,152'): Sets the color for support zones (bullish). Choose a color that stands out for easy identification of potential buying areas.
-
Bearish Zone Color (InpBearishZoneColor, default: Light Orange - C'255,200,124'): Sets the color for resistance zones (bearish). Helps visually distinguish selling or reversal areas.
-
Zone Border Width (InpZoneWidth, default: 2): Adjusts the thickness of the zone borders. Thicker lines (higher number) make zones more prominent on busy charts.
-
Max Number of Zones to Show (MaxZonesToShow, default: 500): Limits how many zones are displayed at once. Lower this for a cleaner chart in long-term views; higher for more historical context.
-
Fill Zones (InpFillZones, default: true): Toggles whether zones are filled with color (true) or just outlined (false). Filled zones are more visible but might obscure price action underneath.
-
Keep Showing Mitigated Zones? (InpShowMitigatedZones, default: false): Decides if broken (mitigated) zones stay visible. Set to true for reviewing past levels; false to hide them and focus on active zones.
-
Show Midline? (InpShowMidline, default: true): Enables/disables a line through the middle of each zone. Useful for targeting the zone's center as a potential support/resistance pivot.
-
Midline Color (InpMidlineColor, default: Gray): Sets the color of the midline for easy spotting.
-
Midline Width (InpMidlineWidth, default: 1): Adjusts the thickness of the midline. Higher values make it bolder.
-
Zone Line Style (InpZoneStyle, default: Solid Line): Chooses the style for zone borders (e.g., Solid, Dash, Dot). Dashed or dotted can make zones less intrusive.
-
Midline Style (InpMidlineStyle, default: Dot Line): Selects the style for the midline (e.g., Solid, Dash, Dot). Customize to match your chart theme.
These parameters make the indicator flexible—tweak them in MT5's input settings to fit your strategy. For example, increase SAR Step for fewer false signals in choppy markets, or change colors for better visibility on dark/light chart backgrounds.
