LSBC Gold
- Indicators
- Mathieu Ouellet
- Version: 1.34
- Updated: 22 June 2025
- Activations: 5
LSCB Gold: Liquidity Sweep & Consolidation Breakout Indicator
The LSCB Gold (Liquidity Sweep & Consolidation Breakout) is a specialized technical indicator designed for scalping on the XAUUSD (Gold) pair. Its core strategy is to identify high-probability trading setups by detecting when liquidity is swept from the market after a period of low-volatility consolidation.
It provides clear, non-repainting buy and sell signals directly on your chart, complete with suggested Stop Loss (SL) and Take Profit (TP) levels based on current market volatility.
## Core Strategy 📈📉
The indicator's logic is built upon a two-phase market analysis:
-
Consolidation Detection: The indicator first identifies periods of market consolidation or ranging. It does this by monitoring the Average True Range (ATR). When the ATR drops below a specific threshold relative to its own moving average, the market is considered to be in a low-volatility state, often accumulating orders before a significant move.
-
Liquidity Sweep: After identifying consolidation, the indicator waits for a "liquidity sweep" or "stop hunt." This occurs when the price briefly spikes above a recent swing high or below a recent swing low, triggering stop-loss orders, before quickly reversing. This is often a sign that institutional players have taken liquidity and the price is ready to move in the opposite direction.
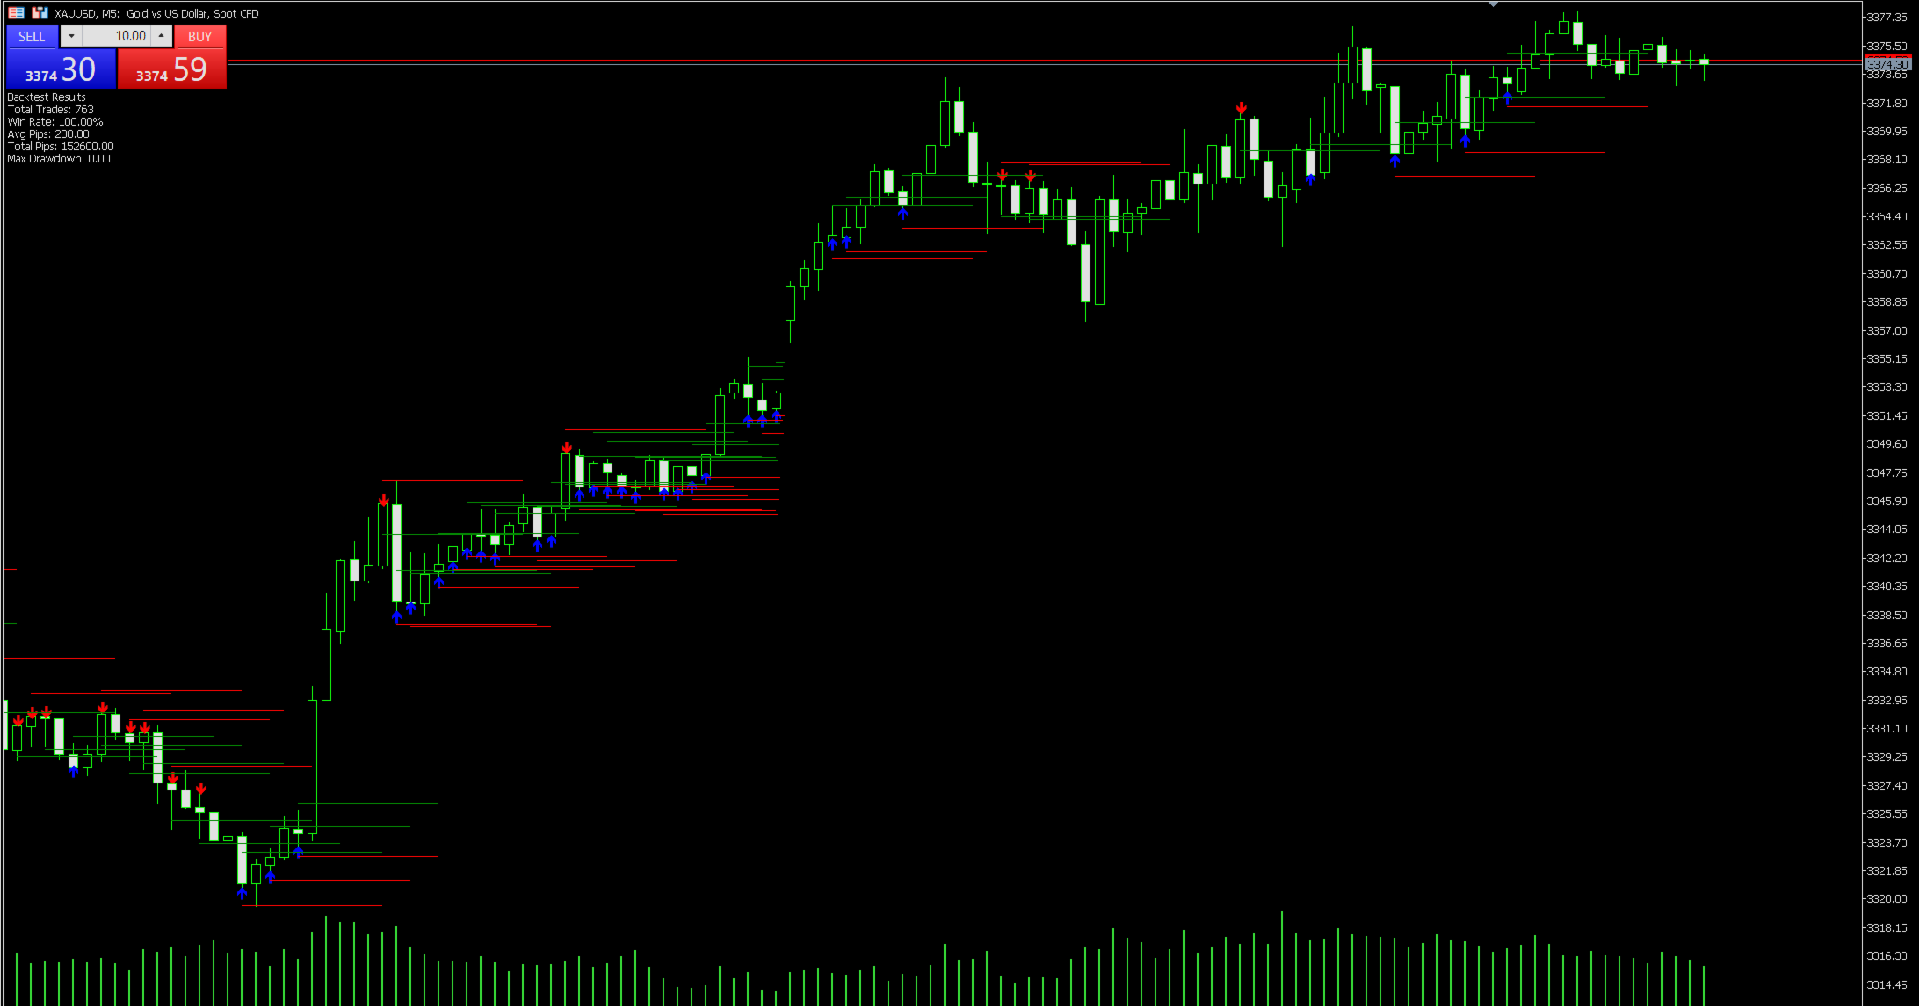
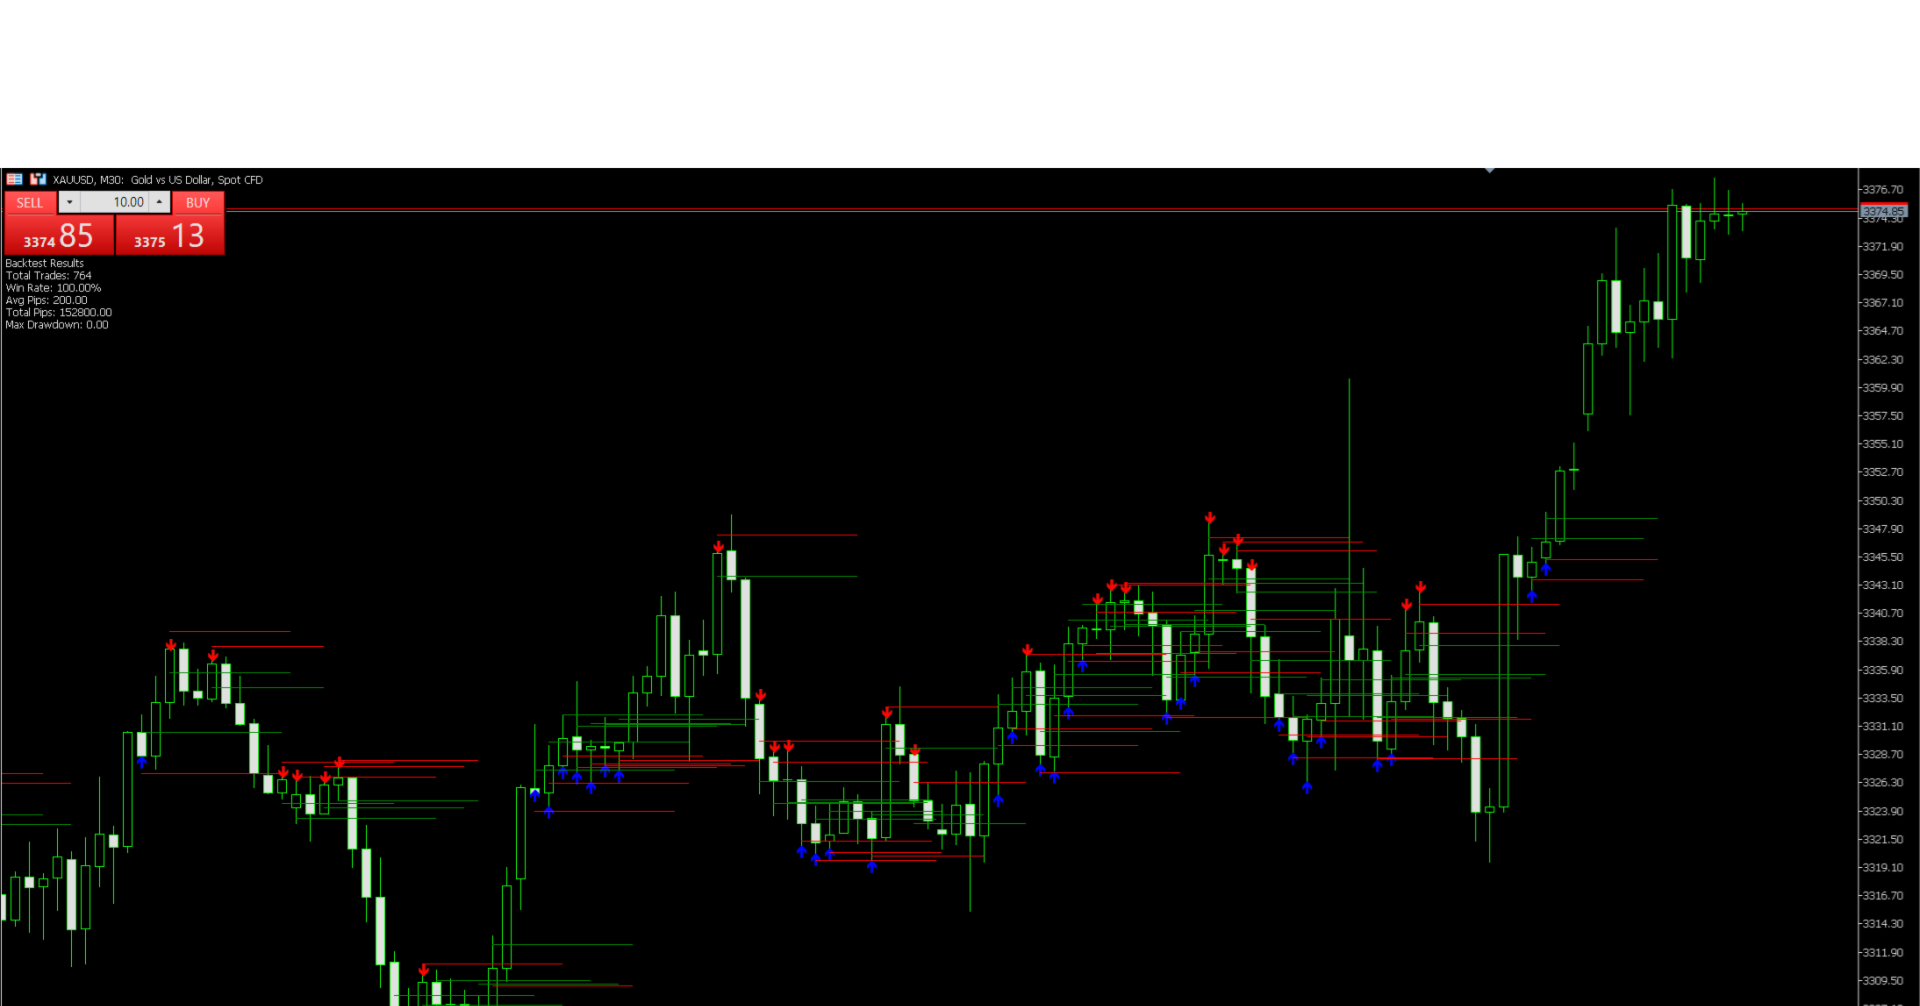
A Buy Signal (blue arrow) is generated when the price sweeps liquidity below a consolidation range and then shows signs of reversal. A Sell Signal (red arrow) is generated when the price sweeps liquidity above a consolidation range and then shows signs of reversal.
## Key Features ⚙️
- Clear Buy/Sell Signals: Displays simple up (blue) and down (red) arrows for straightforward entry signals.
- Dynamic Risk Management: Automatically draws suggested Stop Loss and Take Profit lines on the chart for every signal. These levels are calculated using an ATR multiplier to adapt to current market volatility.
- Advanced Filtering Options:
- RSI Filter: An optional RSI filter to avoid generating signals in overbought or oversold conditions.
- Volume Filter: An optional filter to ensure that signals are supported by a surge in volume, confirming the validity of the move.
- On-Chart Backtest Statistics: Displays key performance metrics directly on the chart, including Total Trades, Win Rate, Total Pips, and Max Drawdown, to give you an immediate idea of the settings' performance on historical data.
- Customizable Alerts: Never miss a signal with built-in MetaTrader 5 alerts.
- Signal Cooldown: A configurable cooldown period (in minutes) to prevent the indicator from generating too many signals in a short amount of time.
## Input Parameters
The indicator is fully customizable to fit your trading style.
Detection
- High/Low Period : The lookback period for identifying recent swing highs and lows.
- ATR Threshold : The multiplier used to define a consolidation state.
- Consolidation Bars : The number of bars used to calculate the consolidation range.
- ATR Period : The period for the Average True Range calculation.
- Alert Prefix : A custom prefix for the alert messages.
Filters
- Enable RSI Filter : true/false to enable or disable the RSI filter.
- RSI Period : The period for the RSI calculation.
- RSI Overbought/Oversold : The levels for the RSI filter (e.g., 80/20).
- Enable Volume Filter : true/false to enable or disable the volume filter.
- Volume Multiplier : The multiplier for the average volume calculation.
Risk Management
- SL ATR Multiplier : The ATR multiplier used to calculate the Stop Loss distance.
- TP ATR Multiplier : The ATR multiplier used to calculate the Take Profit distance.
- Proximity Threshold : Defines how close the price must be to the consolidation range edge for a signal to be valid.
- Signal Cooldown (min) : The minimum number of minutes between signals.
Backtest & Display
- Backtest Period : The start date for the on-chart statistics calculation.
- Show Statistics : true/false to display the performance panel on the chart.
- Enable Debug Mode : A mode for developers to test signal generation logic.