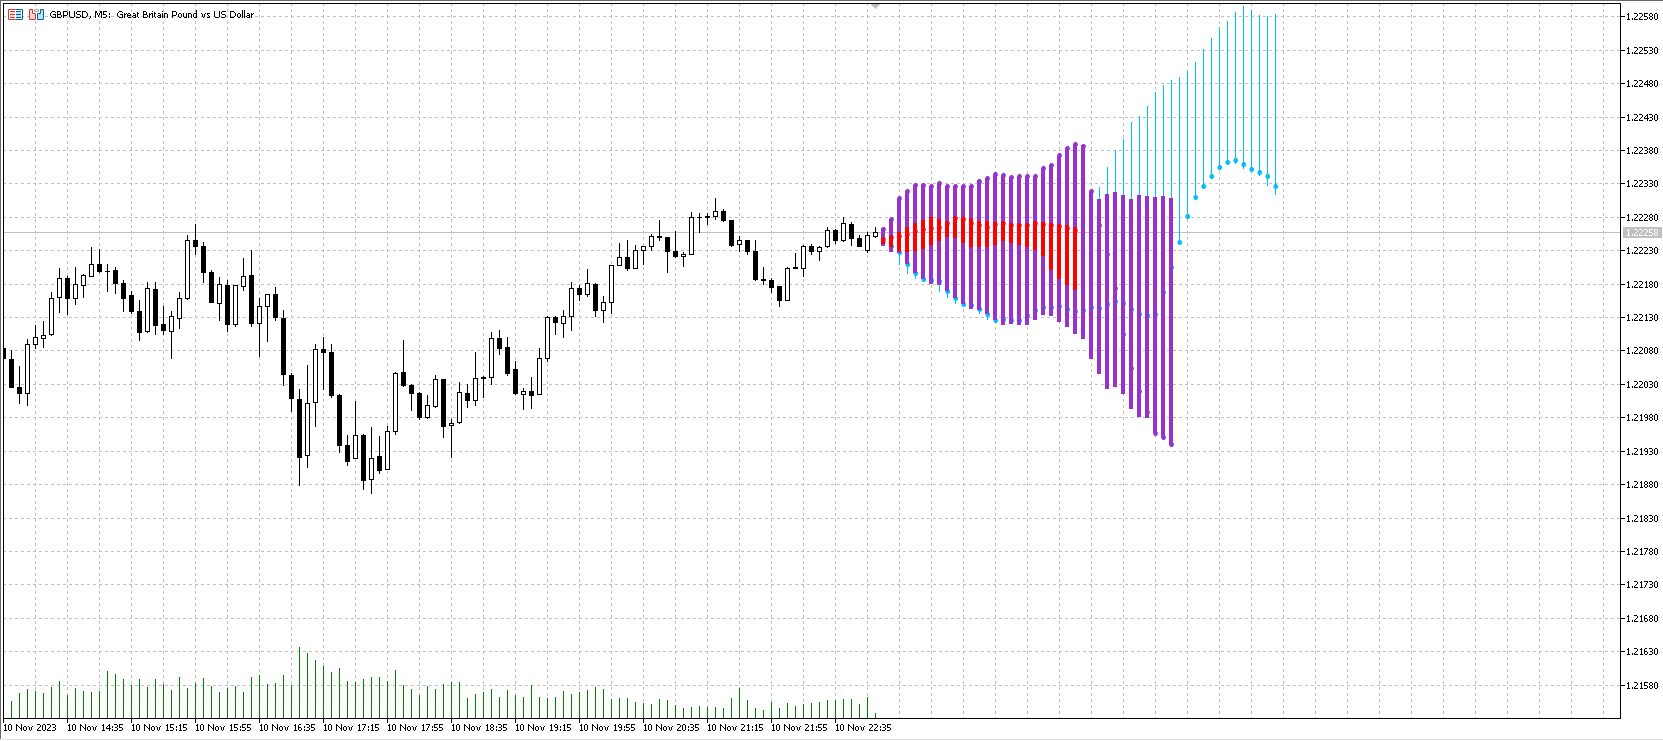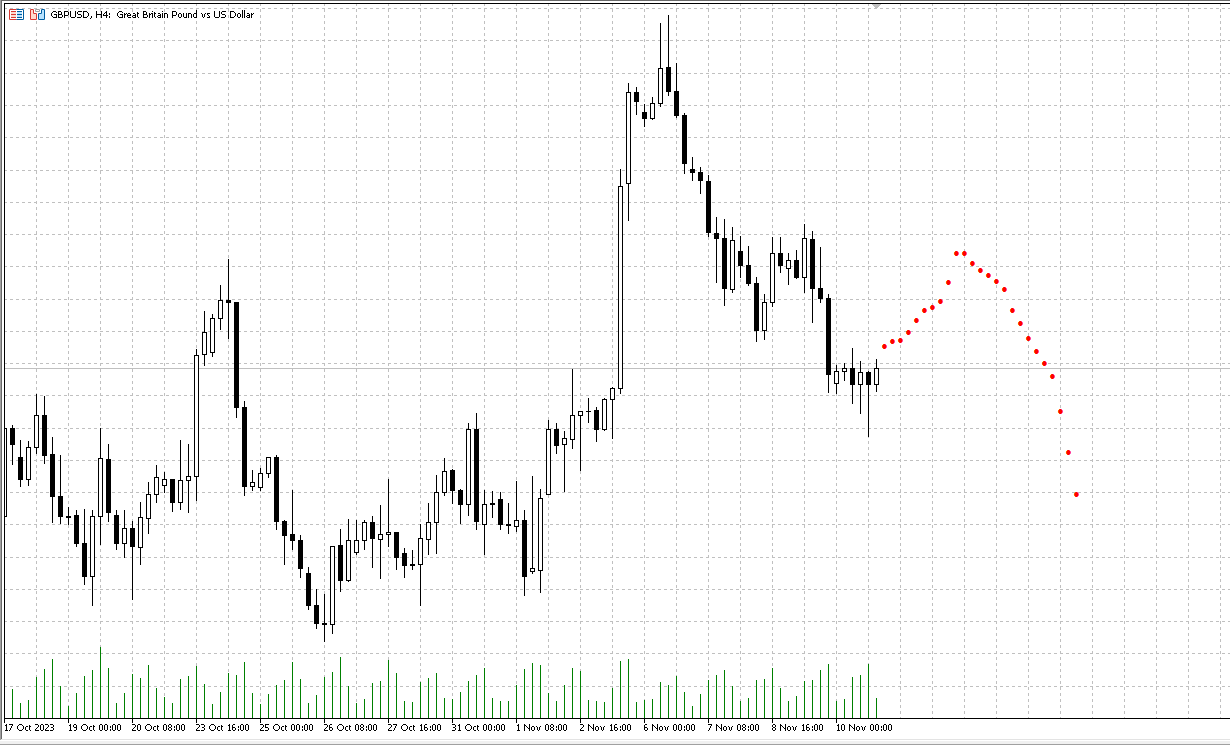
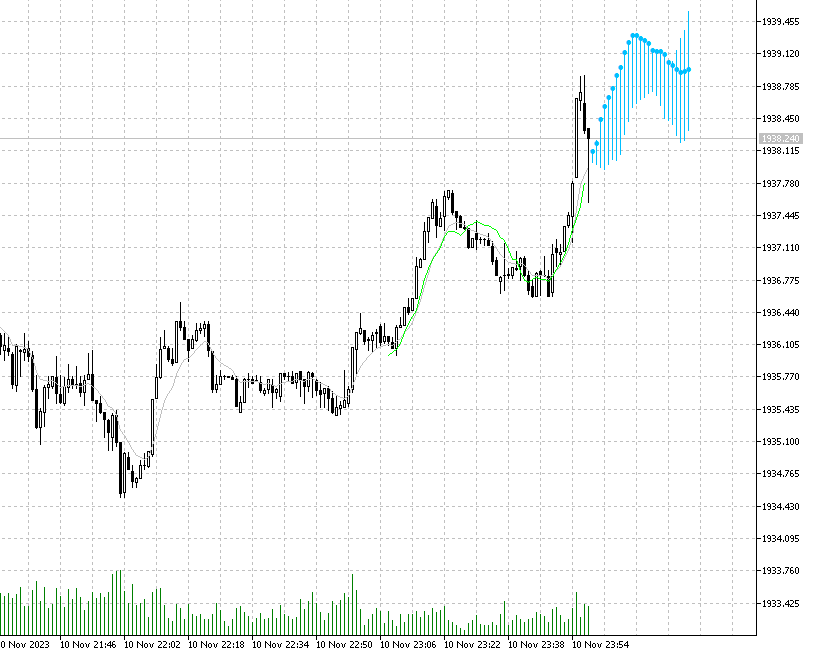
AIntel Predict

Note: If you want to apply this indicators on indicators which are shown in a sub-window, then consider using this indicator instead: https://www.mql5.com/en/market/product/109066. 

AIntel Predict - Your Gateway to Future Trading Success!

Unlock the power of predictive analytics with AIntel Predict. Say goodbye to the guesswork and hello to improved forecasting, as AIntel Predict leverages historical data to unveil the future of your trades like never before.

Whether you're a seasoned trader with a library of custom indicators or a newcomer just starting out, AIntel Predict seamlessly integrates with your existing tools. With a few simple clicks, you can supercharge your existing indicators with the gift of foresight.

Customize the visuals to suit your preferences, ensuring a seamless and visually pleasing trading experience.

But what if you're new to trading or just want to get started quickly? AIntel Predict has you covered there too! Apply this indicator on top of MQL5 built-in indicators, enabling you to begin using them instantly. Whether you're a pro or just starting, we've streamlined the process to get you trading confidently in no time.

Remember, history often repeats itself, and AIntel Predict is your key to unlock those patterns. Don't let valuable trading opportunities slip through your fingers - start using AIntel Predict today!

Get AIntel Predict today and seize tomorrow's opportunities today!


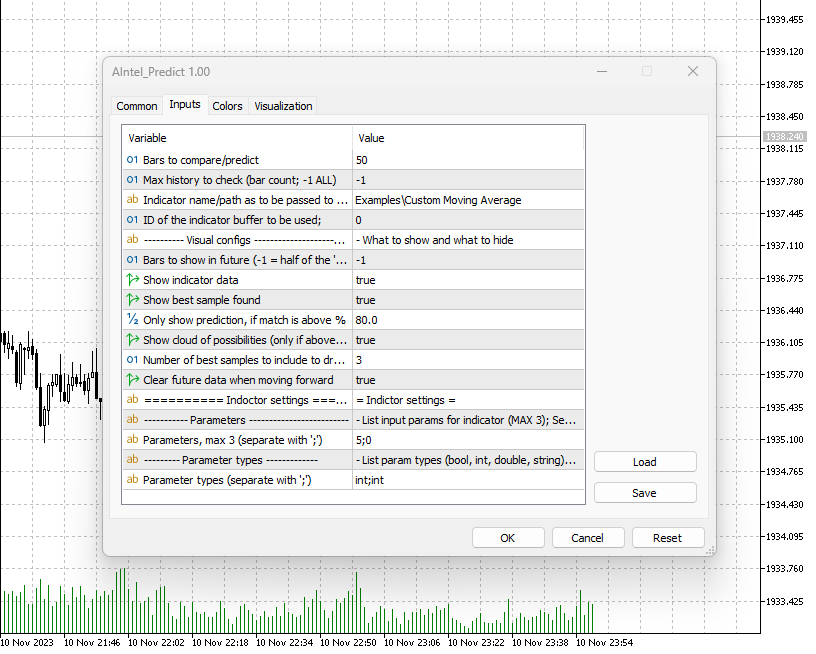
Settings

Bars to compare/predict = 50

Control how many bars of indicator values to be used to search in the past. For example, if set to 5 then only last 5 bars will be taken and compared with the whole history till the most similar one is found. Less provided more matches will be found, however less precise the results are going to be.

Max history to check (bar count; -1 ALL) = -1

If MetaTrader has a long history of bars and not all are relevant or to be included in the search, then control how many bars back to go. This can also solve performance issues if the computer is slow and history is huge (e.g. M1 period).

Indicator name/path as to be passed to iCustom = Examples\Custom Moving Average

IMPORTANT CONFIG! Indicator values will be used to compare values from present to values in the past. Choosing right indicator is the key for good predictions. Use ANY indictor to predict the future! Provide any indicator as an input or chose one of the built-in indicators in MetaTrader 5. For the name/path format follow MQL5 official documentation: https://www.mql5.com/en/docs/indicators/icustom.

For convenience, we have also added support for MQL built-in ones: 

iAC,iAD,iADX,iADXWilder,iAlligator,iAMA,iAO,iATR,iBands,iBearsPower,iBullsPower,iBWMFI,iCCI,iChaikin,iDEMA,iDeMarker,iEnvelopes,iForce,iFractals,iFrAMA,iGator,iIchimoku,iMA,iMAD,iMFI,iMomentum,iOsMA,iOBV,iSAR,iRSI,iRVI,iStdDev,iStochastic,iTEMA,iTriX,iWPR,iVIDyA,iVolumes


ID of the indicator buffer to be used = 0

Some indicators has more than one buffer, and not always the first one contains the data of interest. Configure the buffer to be used for processing. If not sure if the right input data are used (right buffer is used) enable drawing of indicator data as described below.

Bars to show in future (-1 = half of the `bars to compare`)

Bars to predict. By default half of what was searched is used to show in future. But there are no limits and can show more. Remember to configure the chart to shift to the left and give space for future.

Show indictor data = true

If to show indicator calculated data. This is a good way to debug and to see if indicator data is what you expected to be. Once you are sure, you might want to hide them to keep your chart clean.

Show best sample found = true

This will show the best sample from the past and will print on top of present data. It provides a good way to see the difference between the past and present and if the prediction is actually reliable. Note that in logs this indicator will also print the match %, but this provides visual confirmation.

Only show prediction if match is above % = 80.0

With this parameter you can hide predictions which are not reliable. Recommended is 90%, but depending on indicator sometimes it's hard to reach.

Show cloud of possibilities (only if above % > 80) = true

If enabled, it will not only show the best prediction, but ALL predictions which qualify as per the previous parameter (`Only show prediction if match is above % = 80.0`). However if previous parameter is below 80%, then the cloud will not include those due to performance reasons - too many matches may make the indicator too slow.

Clear future data when moving forward = true

If sent to 'false' then it will not clear the "future" part but keep the previous prediction and will add new one on top. In this way you can move forward and see how the indicator performed over time.

Output as Price and not Indicator data = false

Important to set in case the indicator is not in the main chart, but in a sub-window. If indicator is in the sub-window its data will not be visible, but future prediction will probably be too far from the price range to be visible in the main chart (note that this indictor always plots the output in the main chart). When this parameter is set to `true` then the future will not be the indicator data, but bars (`open` price) from the past representing the future. Can be also used with any other indictor in case you want to see future price and not future indicator values.

Parameters, max 3 (separate with ';') = 5;0

Pass input parameters to your indicator. Supported types are `int`, `long`, `double`, `bool` only. As described only 0 to 3 parameters can be passed, and the rest will take the default values. In case of 0 parameters, leave the field empty.

For the built-in indicators of no parameters provides then default values will be used. 

iAC(_Symbol, _Period);
iAD(_Symbol, _Period, VOLUME_TICK);
iADX(_Symbol, _Period, 14);
iADXWilder(_Symbol, _Period, 14);
iAlligator(_Symbol, _Period, 13, 8, 5, 5, 5, 3, MODE_SMMA, PRICE_MEDIAN);
iAMA(_Symbol, _Period, 9, 2, 30, 0, PRICE_CLOSE);
iAO(_Symbol, _Period);
iATR(_Symbol, _Period, 13);
iBands(_Symbol, _Period, 20, 0, 2, PRICE_CLOSE);
iBearsPower(_Symbol, _Period, 13);
iBullsPower(_Symbol, _Period, 13);
iBWMFI(_Symbol, _Period, VOLUME_TICK);
iCCI(_Symbol, _Period, 14, PRICE_TYPICAL);
iChaikin(_Symbol, _Period, 3, 10, MODE_EMA, VOLUME_TICK);
iDEMA(_Symbol, _Period, 14, 0, PRICE_CLOSE);
iDeMarker(_Symbol, _Period, 14);
iEnvelopes(_Symbol, _Period, 14, 0, MODE_SMA, PRICE_CLOSE, 0.100);
iForce(_Symbol, _Period, 13, MODE_SMA, VOLUME_TICK);
iFractals(_Symbol, _Period);
iFrAMA(_Symbol, _Period, 14, 0, PRICE_CLOSE);
iGator(_Symbol, _Period, 13, 8, 8, 5, 5, 3, MODE_SMMA, PRICE_MEDIAN);
iIchimoku(_Symbol, _Period, 9, 26, 52);
iMA(_Symbol, _Period, 10, 0, MODE_SMA, PRICE_CLOSE);
iMACD(_Symbol, _Period, 12, 26, 9, PRICE_CLOSE);
iMFI(_Symbol, _Period, 14, VOLUME_TICK);
iMomentum(_Symbol, _Period, 14, PRICE_CLOSE);
iOsMA(_Symbol, _Period, 12, 26, 9, PRICE_CLOSE);
iOBV(_Symbol, _Period, VOLUME_TICK);
iSAR(_Symbol, _Period, 0.02, 0.2);
iRSI(_Symbol, _Period, 14, PRICE_CLOSE);
iRVI(_Symbol, _Period, 10);
iStdDev(_Symbol, _Period, 20, 0, MODE_SMA, PRICE_CLOSE);
iStochastic(_Symbol, _Period, 5, 3, 3, MODE_SMA, STO_LOWHIGH);
iTEMA(_Symbol, _Period, 14, 0, PRICE_CLOSE);
iTriX(_Symbol, _Period, 14, PRICE_CLOSE);
iWPR(_Symbol, _Period, 14);
iVIDyA(_Symbol, _Period, 9, 12, 0, PRICE_CLOSE);
iVolumes(_Symbol, _Period, VOLUME_TICK);


Parameter types (separate with ';') = int;int

For each parameter provided above it's mandatory to provide its type. Supported types are `int`, `bool`, `long`, `double`. In case the indicator requires an ENUM, then provide it as an `int` (find value for each ENUM by printing its value in MQL) and the indicator will automatically cast it to the right ENUM. Note that you can control up to first 3 parameters. If that's not what you need, then simply wrap any indicator within your own indicator code and control the input as necessary. We can provide samples how to accomplish it.


Happy trading!

AIntel team
Recommended products
GDS Renko Entry Helper - Free Renko Price Interaction Indicator for MetaTrader 5 GDS Renko Entry Helper is a free Renko price interaction indicator for MetaTrader 5. It helps traders highlight important areas where price reacts, slows down, returns to a zone or changes behavior around support and resistance. The tool is designed for manual Renko analysis. It does not generate buy or sell signals and does not tell the trader when to enter the market. Its purpose is to help focus attention on area
Onnyx Indicator is a non-repainting supply and demand analysis indicator for MetaTrader 5. It identifies confirmed swing-based zones, scores their quality, and displays clear BUY and SELL signals directly on the chart. MAIN FEATURES • Supply and demand zones based on confirmed price swings • ATR-adaptive zone width for changing market volatility • Zone quality displayed as a percentage inside each zone • Clear BUY and SELL arrows with enlarged signal markers • Closed-candle signal logic designed
GDS Renko Pip ST Chart - Pip-Based Renko Chart Indicator for MetaTrader 5 GDS Renko Pip ST Chart is a pip-based Renko chart indicator for MetaTrader 5. It helps traders build and study cleaner Renko price movement using a practical fixed pip or point-based brick structure. This tool is designed as a Renko chart foundation for manual analysis. It does not predict the market, does not generate buy or sell signals and does not decide whether a trade should be opened. Renko EDGE EA Golden Delta | A
Premium level is a unique indicator with more than 80% accuracy of correct predictions! This indicator has been tested for more than two months by the best Trading Specialists! The author's indicator you will not find anywhere else! From the screenshots you can see for yourself the accuracy of this tool! 1 is great for trading binary options with an expiration time of 1 candle. 2 works on all currency pairs, stocks, commodities, cryptocurrencies Instructions: As soon as the red arrow app
Was: $249  Now: $99   Market Profile defines a number of day types that can help the trader to determine market behaviour. A key feature is the Value Area, representing the range of price action where 70% of trading took place. Understanding the Value Area can give traders valuable insight into market direction and establish the higher odds trade. It is an excellent addition to any system you may be using. Inspired by Jim Dalton’s book “Mind Over Markets”, this indicator is designed to suit the
Caicai L&S Yield Histogram Important Notice: This indicator is an integral tool of the automated EA Caicai Long and Short Pair Trading . This indicator visually displays the percentage deviation (Yield %) of a pair's current spread relative to its own historical mean. It is an excellent tool for quickly visualizing the gross financial potential of a market distortion in Long & Short operations. Main Features: Percentage Visualization: Understand the size of the distortion in palpable percentage
The indicator builds current quotes, which can be compared with historical ones and on this basis make a price movement forecast. The indicator has a text field for quick navigation to the desired date. Options: Symbol - selection of the symbol that the indicator will display; SymbolPeriod - selection of the period from which the indicator will take data; IndicatorColor - indicator color; Inverse - true reverses quotes, false - original view; Next are the settings of the text field, in w

Price Magnet — Price Density and Attraction Levels Indicator Price Magnet is a professional analytical tool designed to identify key support and resistance levels based on statistical Price Density. The indicator analyzes a specified historical period and detects price levels where the market spent the most time. These zones act as “magnets,” attracting price action or forming a structural base for potential reversals. Unlike traditional Volume Profile tools, Price Magnet focuses on price-time d
Volume Profile Multi-Mode: Analyze Volume Your Way—Not Your Indicator's Way. Most Volume Profile indicators limit traders to predefined analysis ranges. But the market doesn't move inside fixed templates, so why should your analysis? Volume Profile Multi-Mode gives you complete freedom to decide where, when, and how volume is analyzed. Whether you're studying market structure, profiling trading sessions, monitoring higher-timeframe activity, or tracking a developing auction, this indicator adapt
Gioteen Volatility Index (GVI) - your ultimate solution to overcoming market unpredictability and maximizing trading opportunities. This revolutionary indicator helps you in lowering your losing trades due to choppy market movements. The GVI is designed to measure market volatility, providing you with valuable insights to identify the most favorable trading prospects. Its intuitive interface consists of a dynamic red line representing the volatility index, accompanied by blue line that indicate
Manyal trading system, CovEchoTrend Robot, focuses on reliability and flexibility. By employing statistical analysis methods to study the relationships between the base indicator and market patterns, the system enables a deeper understanding of market processes. Intelligent pattern analysis: The application of statistical data processing helps identify key trend reversal points more accurately, signaling significant market shifts. Informed decision-making is based on the intersection of indicato
GDS Renko Pip ST - Fixed Brick Renko Chart Tool for MetaTrader 5 GDS Renko Pip ST is a Renko chart tool for MetaTrader 5 designed for traders who want to build and study fixed brick Renko movement using a practical pip or point-based setup. The purpose of this tool is simple: create a cleaner Renko structure so the trader can observe direction, brick runs, pullbacks, support and resistance behavior without normal candle noise. This is not a signal indicator and it does not predict the market. It
PZ Mean Reversion MT5
PZ TRADING SLU
1 (1)
Outperform traditional strategies: effective mean reversion for savvy traders Unique indicator that implements a professional and quantitative approach to mean reversion trading. It capitalizes on the fact that the price diverts and returns to the mean in a predictable and measurable fashion, which allows for clear entry and exit rules that vastly outperform non-quantitative trading strategies. [ Installation Guide | Update Guide | Troubleshooting | FAQ | All Products ] Clear trading signals Ama
Money Flow Profile MT4  HERE   Use Guide Here our more valuable tools SMC Trend Trading   ,  Easy SMC Trading  ,  Institutional SMC Architect Volume Analysis Tools  ,  Volume flow Profile  ,  Market volume profile  , FVG with Volume  , Liquidity Heatmap Profile  ,  Volume Spread Analysis  Master Edition is a professional-grade analytical tool designed to visualize market structure through the lens of volume and money flow. Unlike standard volume indicators, this tool displays a Daily Vo
Indicator for determining flat and trend. If the price is below any of the two histograms and two lines (red and blue), this is a sell zone. When purchasing this version of the indicator, MT4 version for one real and one demo account - as a gift (to receive, write me a private message)! If the price is above any of the two histograms and two lines (red and blue), this is a buy zone. MT4 version:  https://www.mql5.com/ru/market/product/3793 If the price is between two lines or in the zone of
Noize Absorption Index - is the manual trading system that measures the difference of pressure between bears forces and bulls forces. Green line - is a noize free index that showing curent situation. Zero value of index shows totally choppy/flat market.Values above zero level shows how powerfull bullish wave is and values below zero measures bearish forces.Up arrow appears on bearish market when it's ready to reverse, dn arrow appears on weak bullish market, as a result of reverse expectation.
Volume Profile Canvas - Professional Volume Profile Indicator for MetaTrader 5 DESCRIPTION Volume Profile Canvas is a professional volume profile indicator for MetaTrader 5 that renders directly on the chart using a high-performance Canvas engine. It calculates and displays the volume distribution across price levels, identifying the Point of Control (POC), Value Area High (VAH) and Value Area Low (VAL) in real time. This is a pure analysis tool. It does not trade. It gives you an instant vi
This indicator acts as an advanced chart analysis assistant for traders who love trading Chart Patterns. It is designed to reduce the burden of visual analysis and increase accuracy in making a profit. Main features of this indicator from a practical usage perspective: 1. Automated Pattern Detection Saves time and reduces bias: You don't need to manually draw trendlines. The indicator will search for price swings (Pivot High/Low) and automatically draw Rising Wedge and Falling Wedge structures w
Overview Heiken Ashi CE Filtered MT5 is a technical indicator for the MetaTrader 5 platform. It integrates smoothed candlestick charting with a dynamic exit strategy and a customizable trend filter to deliver clear buy and sell signals. The indicator is designed to improve trend detection and signal reliability by reducing market noise. If you want to see more high-quality products or order the development/conversion of your own products, visit my partners' website: 4xDev Get 10% OFF on manual
Dynasty SMC/ICT Terminal — v3.0 "Neon-Ops Edition" An all-in-one Smart Money Concepts / ICT dashboard for MetaTrader 5. It's an indicator, not an auto-trading EA — it never places, modifies, or closes real orders. It scans price action for Order Blocks, Fair Value Gaps, market structure, harmonic patterns, and multi-timeframe momentum, blends everything into one calibratable Master Signal, and — if enabled — builds a fully automated on-chart trade plan with entry, stop loss, three take-profit ta
PipFinite Exit EDGE MT5
Karlo Wilson Vendiola
4.88 (32)
Did You Have A Profitable Trade But Suddenly Reversed? In a solid strategy, exiting a trade is equally important as entering. Exit EDGE helps maximize your current trade profit and avoid turning winning trades to losers. Never Miss An Exit Signal Again Monitor all pairs and timeframes in just 1 chart www.mql5.com/en/blogs/post/726558 How To Trade You can close your open trades as soon as you receive a signal Close your Buy orders if you receive an Exit Buy Signal. Close your Sell orders if
Rocket Trend
Andriy Sydoruk
The Rocket Trend indicator is trending. The indicator draws two-color points connected by lines along the chart. This is a trend indicator, it is an algorithmic indicator. It is easy to work and understand when a blue circle appears, you need to buy, when a red one appears, sell. The indicator is used for scalping and pipsing, and has proven itself well. Rocket Trend is available for analyzing the direction of the trend for a specific period of time. Ideal for novice traders learning the laws o
ICT PO3 (Power of 3) AMD Protocol Framework Indicator True Time & Structure Integration   |  Non-Repainting | Real-Time  | Multi-Asset  | MT4 Version Available Full Setup Guide & Strategy Playbook: https://www.mql5.com/en/blogs/post/768683 MT4 Version: https://www.mql5.com/en/market/product/171742 Indicator Overview The ICT PO3 AMD Protocol Framework is a complete structural overlay for MetaTrader 5 that maps the True Daily Cycle directly onto your lower-timeframe execution chart. It project
Passband Filter Pro Passband Filter Pro is a trend and cycle oscillator for MetaTrader 5. It is built on the Ehlers Super Passband Filter, a band pass filter that removes long term trend drift and short term noise so that only the dominant market cycle remains. The result is a clean oscillator with a color cloud that shows overbought and oversold conditions, cycle turns, and momentum on forex, gold, indices, stocks and crypto. Most traders enter too early or too late. Simple moving averages la
Divergent Stochastic Filter II Catch Reversals Early, Filter Noise, Trade with Confidence The Edge: Why This Stochastic is Different  Every trader knows the Stochastic oscillator. But knowing when to trust its signals, that's the real challenge. The Divergent Stochastic Filter II transforms this classic indicator into a precision reversal detection system by adding critical elements: divergence intelligence, signal filtering and exhaustion detection.  While standard Stochastic oscillators fire s
Smart Volume Zone
Gleidson Duca De Aguiar
Launch price: 30 USD - price will increase after the first purchases, so early buyers lock in this rate. Smart Volume Zone marks the trading candle with the highest tick volume within the last N trading days (configurable, default 10) and highlights it directly in the terminal's native Volumes panel, with no separate window and no third-party dependency. How it works: the indicator scans every M1 candle within each of the last N days, finds the single highest-volume candle per day, then compar
Fibonacci Projection Volume Delta Profile Combine Fibonacci-based price projections with volume delta analysis to see where buying and selling pressure concentrates across key retracement zones. This indicator automatically detects swing highs and lows, plots retracement levels, and projects forward price targets using Fibonacci extensions — while overlaying a volume delta profile that shows the balance of bullish vs. bearish volume within each Fibonacci band. Use it to spot high-probability rev
FREE
Here   our more valuable tools SMC Trend Trading   ,  Easy SMC Trading  ,  Institutional SMC Architect Volume Analysis Tools  ,  Volume flow Profile  ,  Market volume profile  , FVG with Volume  , Liquidity Heatmap Profile  ,  Volume Spread Analysis The    Liquidity Heatmap   is a sophisticated institutional trading tool designed to reveal where over-leveraged traders are trapped. By calculating estimated liquidation levels based on volume spikes and leverage, this indicator draws a dynamic "h
The Horizontal Ray Tool is a lightweight, professional charting utility designed to streamline support and resistance mapping on MetaTrader 5. It brings rapid, one-click horizontal level placement directly to your live chart, eliminating the workspace clutter associated with infinite horizontal lines or manually drawn trendlines. Key Features: Interactive On-Screen Button: Spawns a clean, responsive "DRAW RAY" button docked directly on your chart canvas. A single click drops an independent hor
FREE
Best SAR MT5
Ashkan Hazegh Nikrou
4.33 (3)
Description :  we are happy to introduce our new free indicator based on one of professional and popular indicators in forex market (Parabolic SAR) this indicator is new modification on original Parabolic SAR indicator, in pro SAR indicator you can see cross over between dots and price chart, this crossover is not signal but talk about end of movement potential, you can start buy by new blue dot, and place stop loss one atr before first blue dot, and finally you can exit as soon as dots cross p
FREE
Buyers of this product also purchase
Neuro Poseidon MT5
Daria Rezueva
4.79 (53)
Neuro Poseidon is a new indicator by Daria Rezueva. It combines precise trading signals with adaptive TP/SL levels - creating best possible trades as a result! Message me and get  Neuro Poseidon Assistant  as a gift to automize your trading process! What makes it stand out? 1. Proven profitability on all assets and timeframes 2. Only confirmed BUY and SELL signals present on the chart 3. Adaptive TP & SL levels generated by the software for each trade 4. Easy to understand - suitable for al
The UZFX {SSS} Scalping Smart Signals v5.0 MT5  is a Non Repaint high-performance trading indicator designed for Scalpers, Day Traders, and Swing Traders who demand accurate, real-time signals in fast-moving markets. Developed by (UZFX-LABS), this indicator combines price action analysis, trend confirmation, and smart filtering to generate high-probability buy and sell signals, Warning Signals, and Trend Continuation Opportunities across all currency pairs and timeframes.  Stop second-guessing
Gem SIGNAL
Shengzu Zhong
5 (1)
GEM Signal Pro GEM Signal Pro is a trend-following indicator for MetaTrader 5, designed for traders who want clearer signals, more structured trade setups, and practical risk management directly on the chart. Instead of showing only a simple arrow, GEM Signal Pro helps present the full trade idea in a cleaner and more readable way. When conditions are confirmed, the indicator can display the entry price, stop loss, and take profit targets on the chart, helping traders review the setup more effic
Superhero
Ihor Otkydach
5 (3)
The SUPERHERO indicator is a multi-currency trading system designed on an "all-inclusive" basis. The indicator independently analyzes the market and provides signals on when to open and close trades. It uses Stop Loss and Take Profit orders. The R:R ratio is 1:1. This system can send push notifications to your smartphone, so you can place trades "on the go" without needing to be tied to a PC. It's perfect for proprietary trading firms. A BONUS FOR EVERY CUSTOMER: Every buyer of this indicator wi
M1 Quantum MT5
Hamed Dehgani
4.27 (11)
Live Trading Signals Using M1 Quantum : Signal  (Trade executed automatically by the Quantum Trade Assistant , included free with this product.) Latest News : Version 1.64 has been released, All trades now have a Stop Loss placed behind the relevant Support/Resistance zones. The Smart Close function has also been improved to increase the EA’s performance in this version. Since August 9, the live signal has been running on Version 1.64. Price Plan: Current Price: $169 (Early Adopter Offer) Next
Azimuth Pro
Ottaviano De Cicco
5 (7)
Azimuth Pro V2: Synthetic Fractal Structure and Confirmed Entries for MT5 Overview Azimuth Pro is a multi-level swing structure indicator by Merkava Labs . Four nested swing layers, swing-anchored VWAP, ABC pattern detection, three-timeframe structural filtering, and closed-bar confirmed entries — one chart, one workflow from micro-swings to macro-cycles. This is not a blind signal product. It is a structure-first workflow for traders who care about location, context, and timing. ️ Summer Sale
TPA True Price Action indicator reveals the true price action of the market makers through 100% non-repainting signals strictly at the close of a candle! TPA shows entries and re-entries, every time the bulls are definitely stronger than the bears and vice versa. Not to confuse with red/green candles. The shift of power gets confirmed at the earliest stage and is ONE exit strategy of several. There are available now two free parts of the TPA User Guide for our customers. The first "The Basics"
Precision Spike Detector
Francisco Mandomo Simbine
5 (2)
Precision Spike Detector V3 – Institutional-Grade AI Trading System Attention: The price increases by US$50 for every 10 purchases.  Final price: US$599 Precision Spike Detector V3   is a   state-of-the-art, institutional-grade market analysis system   for   MetaTrader 5 , designed to detect   high-probability market movements   in synthetic indices such as   Boom, Crash, GainX, and PainX . After purchase, send me a private message to receive the optimized configuration files,  the installation
The Oracle Pro
Ottaviano De Cicco
5 (1)
The Oracle Pro: Synthetic Multi-Timeframe Bias Engine for MT5 ️ Summer Launch Offer — Get The Oracle Pro for USD 199 (early buyers). Price rises with traction; final price USD 399. The Oracle Pro is a premium multi-timeframe bias engine for MetaTrader 5, built for demanding and professional traders. It answers one question with discipline: what is the directional bias on each timeframe right now, how strong is it, and how much do the timeframes agree? Everything is computed on closed bars only
Title:FX-AIEA Supply and Demand Zone Indicator (MT5) — Technical Overview Version: 2.51 | Platform: MetaTrader 5 Introduction Supply and demand zones are considered a core manifestation of institutional order flow, providing a more direct reflection of buying and selling pressure than traditional support/resistance levels. This indicator attempts to automate the identification of high-probability supply and demand zones using an adaptive ZigZag algorithm, reducing the subjectivity and time asso
KURAMA GOLD SIGNAL PRO (MT5) — 7-Layer Filter, Auto TP/SL, Quality Score & Signal History Save | Complete XAUUSD Trading System No repaint in real time. The moment a signal appears, the arrow, entry, TP and SL are locked on the spot and never move afterward. What you trade is this real-time signal. And in v7.20, every signal that is actually sent is auto-saved and restored exactly after restart. BUYER BONUS Buy the lifetime license and receive AI Zone Radar (
PrimeScalping
Temirlan Kdyrkhan
PrimeScalping is a powerful trading companion designed to generate high-probability entry signals with dynamic TP/SL/DP levels based on volatility. Built-in performance tracking shows win/loss stats, PP1/PP2 hits, and success rates — all updated live. Key Features: Buy/Sell signals with adaptive volatility bands Real-time TP/SL/DP levels based on ATR Built-in MA Filter with optional ATR/StdDev volatility Performance stats panel (Success, Profit/Loss, PP1/PP2) Alerts via popup, sound, push, or e
TrendMaestro5
Stefano Frisetti
note: this indicator is for METATRADER4, if you want the version for METATRADER5 this is the link:  https://www.mql5.com/it/market/product/108106 TRENDMAESTRO ver 2.5 TRENDMAESTRO recognizes a new TREND from the start, he never makes mistakes. The certainty of identifying a new TREND is priceless. DESCRIPTION TRENDMAESTRO identifies a new TREND in the bud, this indicator examines the volatility, volumes and momentum to identify the moment in which there is an explosion of one or more of these da
Quant Direction MT5
Georgios Kalomoiropoulos
Quant Direction is a 3 dimensional market analysis tool. It provides a purely objective, algorithmic view of the market by calculating exact percentage-based biases across multiple dimensions simultaneously. Developed utilizing advanced AI modeling tools and subjected to thorough testing, this algorithm is engineered to read the market with unique precision. It can analyze any currency pair or financial instrument available on your platform.  Quant Direction is the ideal tool whether you are a S
Smart Market Structure Toolkit
Garry James Goodchild
5 (1)
Smart Market Structure Pro by G-Labs — ICT and Smart Money Concepts toolkit with built-in multi-symbol scanner for MetaTrader 5. Break of structure, change of character, order blocks, fair value gaps, liquidity sweeps, premium and discount zones, ICT sessions, confluence scoring, AI trade ideas, and a traffic-light scanner across up to 30 pairs and four timeframes from one chart. Map SMC and ICT on the active chart while the built-in scanner monitors your full watchlist. Each cell shows BUY, S
Btmm state engine pro
Garry James Goodchild
5 (4)
BTMM State Engine Pro by G-Labs — Beat The Market Maker indicator for MetaTrader 5. Asian session range, London and New York kill zones, level progression (L1/L2/L3), peak formation detection (PFH/PFL), entry signals, and a multi-pair scanner from one chart. Stop scanning charts one pair at a time. The State Engine tracks the BTMM daily cycle automatically — Asian box, room boundaries, level blocks, peak formations, and filtered entries — while the scanner dashboard shows level, peak status, d
Ace Trend
Mikhail Sergeev
5 (3)
We present you a revolutionary indicator that changes the rules of the game in the world of trend trading. The indicator is designed to rethink performance and elevate your trading experience to unprecedented heights. Our indicator boasts a unique combination of advanced features that set it apart from its competitors. The advanced technology of "Real Pricing Factors" ensures unsurpassed stability even in the most difficult and volatile market conditions. Say goodbye to unstable patterns, broken
MOST ELLIOTT WAVE TOOLS JUST DRAW LINES. THIS ONE VALIDATES EVERY PATTERN AGAINST THE 3 CARDINAL RULES — OR REJECTS IT. Elliott Wave analysis is one of the most powerful — and most difficult — methods in technical trading. Most indicators fake it. They draw zigzag lines and call them waves without checking a single Elliott Wave rule. Elliott Wave Detector Pro is different. It was built from the ground up to detect, v
Sniper Delta Imbalance   is a professional tool for deep delta analysis — the difference between buyer and seller volumes. It takes volume analysis to the next level, allowing traders to see in real time who controls the price — buyers or sellers — and to find precise entry points based on the actions of major market participants. This tool represents a unique style of analysis based on the ratio of demand and supply volumes and can be used to detect who holds control over price. At the core of
KT Alpha Hunter Arrows MT5
KEENBASE SOFTWARE SOLUTIONS
Most arrow indicators give you a signal and leave you to figure out the rest. KT Alpha Hunter Arrows gives you the full trading plan. Every signal arrow prints with a full plan already drawn: entry line, stop-loss, four take-profit levels, and a live edge verdict telling you whether this symbol and time-frame is worth trading right now. An included Trade Manager EA handles the execution after you enter, so discipline stays intact when the market gets loud. Non-repaint. Closed-bar signals only. B
This indicator is an indicator for automatic wave analysis that is perfect for practical trading! Case... Note:   I am not used to the Western name for wave classification. Influenced by the naming habit of Chaos Theory (Chanzhongshuochan), I named the basic wave as   pen   , the secondary wave band as   segment   , and the segment with trend direction   as main trend segment   (this naming method will be used in future notes, let me tell you in advance), but the algorithm is not closely relate
SMC Sweep Fvg MT5 — see the market the way smart money does, right on your chart You know the feeling: price takes out your stop, turns around, and goes exactly where you expected. You were right about the direction. You were only wrong about the entry. This indicator exists to make that happen less often. It takes over the hardest part of the analysis — mapping the chart — and leaves you with what matters: the decision. What you see on the chart Market structure — real structural highs and
The Precision Index Oscillator (Pi-Osc) for MT5 by Roger Medcalf of Precision Trading Systems First of all, if you have any questions please contact me via my website which you can find by searching the above title. Version 2 has been carefully recoded to be super fast to load up on your chart and some other technical improvements have been incorporated to enhance experience. Pi-Osc was created to provide accurate trade timing signals designed to find   extreme     exhaustion points, the points
SMC Fibonacci OTE
Tshivhidzo Moss Mbedzi
SMC Fibonacci OTE: Professional Market Structure & Optimal Entry Tool SMC Fibonacci OTE is a high-precision technical indicator for MetaTrader 5 designed for traders following Smart Money Concepts (SMC) . It automates the detection of market structure shifts and identifies the high-probability Optimal Trade Entry (OTE) zone, providing you with clear entry, stop loss, and multiple take-profit levels. By eliminating manual Fibonacci drawing, this indicator ensures consistency and helps you stay fo
SmartScalping
Temirlan Kdyrkhan
SmartScalping is a powerful trading companion designed to generate high-probability entry signals with dynamic TP/SL/DP levels based on volatility. Built-in performance tracking shows win/loss stats, PP1/PP2 hits, and success rates — all updated live. Key Features: Buy/Sell signals with adaptive volatility bands Real-time TP/SL/DP levels based on ATR Built-in MA Filter with optional ATR/StdDev volatility Performance stats panel (Success, Profit/Loss, PP1/PP2) Alerts via popup, sound, push, or e
ScalpPoint
Temirlan Kdyrkhan
ScalpPoint is a powerful trading companion designed to generate high-probability entry signals with dynamic TP/SL/DP levels based on volatility. Built-in performance tracking shows win/loss stats, PP1/PP2 hits, and success rates — all updated live. Key Features: Buy/Sell signals with adaptive volatility bands Real-time TP/SL/DP levels based on ATR Built-in MA Filter with optional ATR/StdDev volatility Performance stats panel (Success, Profit/Loss, PP1/PP2) Alerts via popup, sound, push, or emai
Boom & Crash & PainX & GainX Ultimate Spike Detector Trade Spikes With Confidence — Not Guesswork Catching spikes should be one of the most profitable strategies in synthetic markets. But for most traders, it becomes one of the most frustrating. You enter too early… price goes against you. You wait for a spike… it never comes. You finally catch one… but don’t know whether to hold or close. You make profit… then give it all back because there’s no exit plan. This is exactly the problem the Ultim
ZAB Supply Demand MTF automatically detects institutional supply and demand zones across up to 9 timeframes and draws them directly on your chart. Based on Sam Seiden's methodology, this indicator identifies the exact zones where banks and institutions placed their orders. Why This Indicator? Unlike basic support/resistance tools, ZAB Supply Demand MTF classifies every zone by its formation pattern and merges overlapping zones from different timeframes into high-probability confluence areas. Key
Nspikes Sniper R2 Premium Edition for MT5 Nspikes Sniper R2 Premium Edition is a technical indicator designed for Boom 1000/500/900/600 and Crash 1000/500/900/600 indices. It integrates liquidity zone detection, session filters, and a 3-step recovery entry visual layout directly on MetaTrader 5 charts. Key Features: - Automatic Instrument Detection: Identifies whether the current chart is Boom or Crash and applies the corresponding logic. - Timeframe Optimization: Formatted for M1 and M5 time
More from author
About AIntel Is there are reason you select RSI 14 or 21? Is there a reason you select EMA 25? Is there a reason you pick these periods for these and any other indicators? Those numbers might have worked 10 or 20 years ago. They might be working for traiding certain currency pair in a certain timeframe.. But they DO NOT give you the best profit and outcome at all times all pairs all trades! AInter is "automated inteligence" series indicators that optimize automatically for best profit so you don
Note: This indicator is for sub-window use and not for the main chart. If you need to apply it for the indicators in the main chart, then use this indicator instead:  https://www.mql5.com/en/market/product/108876 AIntel Predict   - Your Gateway to Future Trading Success! Unlock the power of predictive analytics with AIntel Predict. Say goodbye to the guesswork and hello to improved forecasting, as AIntel Predict leverages historical data to unveil the future of your trades like never before. Whe
Filter:
No reviews
Reply to review