Something Interesting - page 45


Hans Indicators

Hans Indicator by Metatrader 5

Hans Indicator by Metatrader 5


This is interesting indicator (for MT5):

----------------


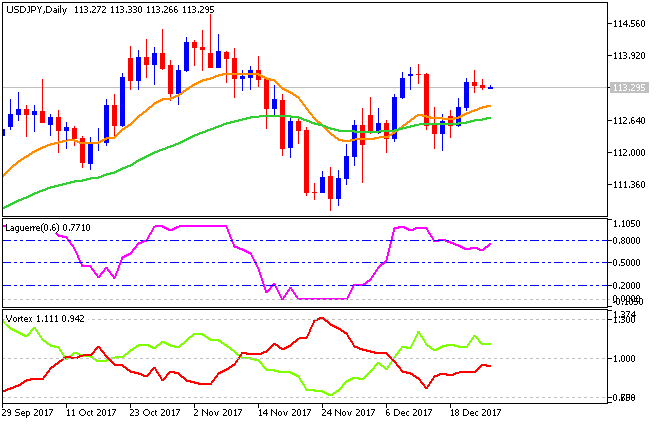
Vortex Oscillator - indicator for MetaTrader 5

Oscillator based on Vortex indicator - displays the difference between lines VI + and VI- in the form of a histogram.

----------------

Vortex - indicator for MetaTrader 5

The indicator was described in the article "The Vortex Indicator" published in the January issue of "Technical Analysis of Stocks & Commodities" (2010).


Forum on trading, automated trading systems and testing trading strategies

RSI indicator

Sergey Golubev, 2018.09.21 10:50

Good article was published - 

----------------

Universal RSI indicator for working in two directions simultaneously 

When developing trading algorithms, we almost always encounter a problem: how to determine where a trend/flat begins and ends? It is difficult to find a clear-cut solution. This goal seems achievable by combining the both trend-based and flat-based strategies in one algorithm. In this article, we will create a universal indicator that will combine signals for different types of strategies. We will try to simplify the generation of trade signals in an expert as much as possible. An example of combining several indicators in one will be given. This will be done using object-oriented programming, with each indicator or its part being implemented in the form of a class included in the main program file.

Contents


Trend Continuation Factor for Metatrader 5

It is very interesting indicator which was recently converted to Metatrader 5.
We can download this indicator from this post (together with MT4 original version).

Forum on trading, automated trading systems and testing trading strategies

Elite indicators - metatrader 5 version :)

zemo, 2018.02.21 15:45

Million thanks to Enivid... I got stucked in mt5 conversion but Enivid helped and finalized the conversion... ;-)


Trend Continuation Factor

original code: Mladen
mt5 conversion: Enivid (Andriy Moraru )


snap1


Good article found - 

----------------

The Easy Way to Evaluate a Signal: Trading Activity, Drawdown/Load and MFE/MAE Distribution Charts 

The Easy Way to Evaluate a Signal: Trading Activity, Drawdown/Load and MFE/MAE Distribution Charts

Subscribers often search for an appropriate signal by analyzing the total growth on the signal provider's account, which is not a bad idea. However, it is also important to analyze potential risks of a particular trading strategy. In this article we will show a simple and efficient way to evaluate a Trading Signal based on its performance values:


Forum on trading, automated trading systems and testing trading strategies

Jurik

Sergey Golubev, 2018.10.13 13:05

BB stops JMA - multiple stops - indicator for MetaTrader 5

BB stops JMA - multiple stops - indicator for MetaTrader 5

BB stops JMA - multiple stops - indicator for MetaTrader 5

BB stops is using Bollinger bands as a criteria for determining if the trend is changing as well as determining the trend direction. The usual way how it finds out the stop lines is by calculating a risk based on deviation. But, in many cases, one single proposed stop line is not enough.


Forum on trading, automated trading systems and testing trading strategies

Chaos Theory by Bill Williams

Sergey Golubev, 2018.10.14 16:40

Choppiness Index - JMA Smoothed - indicator for MetaTrader 5 

Choppiness Index - JMA Smoothed - indicator for MetaTrader 5

Choppiness is a modern indicator based on ideas of chaos theory and fractal geometry. Benoit Mandelbrot was the one person most responsible for the great interest in the subject of fractal geometry. He showed how fractals can occur in many different places in both mathematics and elsewhere in nature. They could be found underlying cloud formations, waves, leaves, fingerprints, and sunflowers, and his ideas provided some exciting glue between mathematics and nature. Using computer graphics and with the help of IBM, Mandelbrot was able to show how to express fractal geometry using computer graphics.

While most of us think there are only whole number dimensions, like 1D, 2D, and 3D, in fractal geometry there exist fractional dimensions in between the whole number dimensions. So there are a number of fractal dimensions between a 1D line and a 2D plane. Fractals are basically a measurement of the dimensionality of a system; they are able to express different images based on the fractional nature of dimension.


This is very useful indicator for Metatrader 4 and Metatrader 5 - 

----------------

Show Pips - indicator for MetaTrader 5

https://www.mql5.com/en/code/19540

Parameters 

Type of appearance - info line appearance type. There are three options:

  • Follow the price - following a price;
  • As comment - to be shown as a comment;
  • In selected corner of the screen - to be shown in the selected chart corner.
  • Graph corner for attachment - if the 'In selected corner of the screen' display type is selected, this parameter allows selecting the corner;
  • Show profit? - enable/disable display of profit in the deposit currency;
  • Show profit in percents? - enable/disable display of profit in the deposit currency;
  • Show spread? - enable/disable display of the current spread;
  • Show time to bar closure? - enable/disable display of time remaining until the close of the bar;
  • Text color - the color of the text;
  • Profit color - the color of the text when there is floating profit;
  • Loss color - the color of the text when there is floating loss;
  • Separator - line data separator. The parameter may have five values: "|", "/", ".", ''\", or "#";
  • Y coordinate - Y coordinate (if "In selected corner of the screen" is selected as the appearance type);
  • Indent in bars - indent from the current bar, in bars (if "Follow the price" is selected as the appearance type);
  • Font size - text font size;
  • Font - text font;

----------------

Same (updated) indicator for Metatrader 4 is on this CodeBase page

Show Pips
Show Pips
  • www.mql5.com
This information indicator allows you to always be aware of the current account status. The indicator displays the following data: profit in points, percentage and currency, spread of the current pair and the time until the bar close on the current timeframe. You can select one of the different info line location types: Data separator is also...
 

Lego EA - expert for MetaTrader 5

input double   InpLots           = 1.0;      // Lots
input ushort   InpStopLoss       = 200;      // Stop Loss, in pips (1.00045-1.00055=1 pips)
input ushort   InpTakeProfit     = 200;      // Take Profit, in pips (1.00045-1.00055=1 pips)
input double   InpLotMultiply    = 2.0;      // Multiply a lot if the last deal was unprofitable
//--- input CCI parameters
input bool                 InpOpenCCI           = false;          // CCI: use CCI to open
input bool                 InpCloseCCI          = false;          // CCI: use CCI to close
input int                  Inp_CCI_ma_period    = 14;             // CCI: averaging period 
input ENUM_APPLIED_PRICE   Inp_CCI_applied_price= PRICE_TYPICAL;  // CCI: type of price
//--- input MA's parameters
input bool                 InpOpenMA            = true;           // MA's: use MA's to open
input bool                 InpCloseMA           = true;           // MA's: use MA's to close
input int                  Inp_MA1_ma_period    = 14;             // MA1: averaging period 
input int                  Inp_MA2_ma_period    = 67;             // MA2: averaging period 
input int                  Inp_MA_ma_shift      = 1;              // MA's: horizontal shift 
input ENUM_MA_METHOD       Inp_MA_ma_method     = MODE_SMA;       // MA's: smoothing type 
input ENUM_APPLIED_PRICE   Inp_MA_applied_price = PRICE_CLOSE;    // MA's: type of price or handle 
//--- input Stochastic parameters
input bool                 InpOpenSTO           = false;          // STO: use STO to open
input bool                 InpCloseSTO          = false;          // STO: use STO to close
input int                  Inp_STO_Kperiod      = 5;              // STO: K-period (number of bars for calculations) 
input int                  Inp_STO_Dperiod      = 3;              // STO: D-period (period of first smoothing) 
input int                  Inp_STO_slowing      = 3;              // STO: final smoothing 
input ENUM_MA_METHOD       Inp_STO_ma_method    = MODE_SMA;       // STO: type of smoothing 
input ENUM_STO_PRICE       Inp_STO_price_field  = STO_LOWHIGH;    // STO: stochastic calculation method 
input double               Inp_STO_Level_Up     = 30;             // STO: Level Up
input double               Inp_STO_Level_Down   = 70;             // STO: Level Down
//--- input AC parameters
input bool                 InpOpenAC            = false;          // AC: use AC to open
input bool                 InpCloseAC           = false;          // AC: use AC to close
//--- input DeMarker parameter
input bool                 InpOpenDeM           = false;          // DeM: use DeM to open
input bool                 InpCloseDeM          = false;          // DeM: use DeM to close
input int                  Inp_DeM_ma_period    = 14;             // DeM: averaging period 
input double               Inp_Dem_Level_Up     = 0.7;            // DeM: Level Up 
input double               Inp_Dem_Level_Down   = 0.3;            // DeM: Level Down 
//--- input AO parameters
input bool                 InpOpenAO            = false;          // AO: use AO to open
input bool                 InpCloseAO           = false;          // AO: use AO to close

The Expert Advisor allows you to combine signals of several indicators at once:

  • iCCI (Commodity Channel Index, CCI)
  • iMA (Moving Average, MA)
  • iStochastic (Stochastic Oscillator)
  • iAC (Acceleration / Deceleration, Accelerator / Decelerator Oscillator, AC)
  • iDeMarker (DeMarker, DeM)
  • iAO (Awesome Oscillator, AO)

or include only one of the indicators.

Reason: