Press review - page 565
You are missing trading opportunities:
- Free trading apps
- Over 8,000 signals for copying
- Economic news for exploring financial markets
Registration
Log in
You agree to website policy and terms of use
If you do not have an account, please register
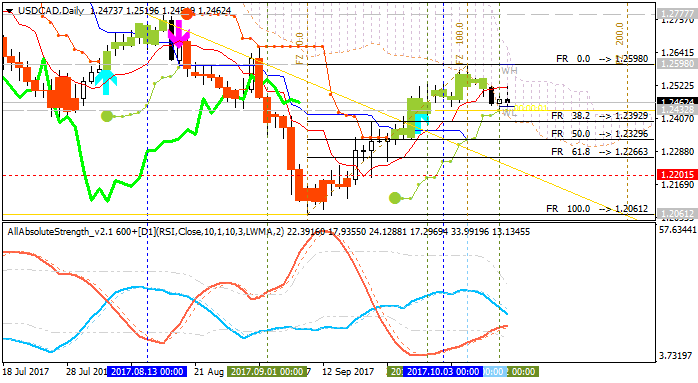
Weekly USD/CAD Outlook: 2017, October 15 - October 22 (based on the article)
Dollar/CAD slipped from the highs in a much-needed correction. The upcoming week’s highlights are the inflation and retail sales reports. What’s next?
==========
The chart was made on H4 timeframe with standard indicators of Metatrader 4 except the following indicators (free to download):
AUD/USD Intra-Day Fundamentals: RBA Monetary Policy Meeting Minutes and range price movement
2017-10-17 01:30 GMT | [AUD - Monetary Policy Meeting Minutes]
if actual > forecast (or previous one) = good for currency (for AUD in our case)
[AUD - Monetary Policy Meeting Minutes] = Difference in value between imported and exported goods during the reported month.
==========
From rttnews article :
==========
AUD/USD M5: range price movement by RBA Monetary Policy Meeting Minutes news event
==========
Chart #1 was made on MT5 with Brainwashing system/AscTrend system (MT5) from this thread (free to download) together with following indicators:
Same system for MT4:
Trading the News: U.K. Employment Change (Claimant Count Change) (based on the article)
The U.K. added another 180K jobs in July, while the Unemployment Rate unexpectedly narrowed to an annualized 4.3% from 4.4% during the same period. Despite the ongoing improvement in the labor market, Average Weekly Earnings held steady at an annualized 2.1% amid forecasts for a 2.3% print, and signs of subdued wage growth may encourage the Bank of England (BoE) to further delay the normalization cycle especially as Brexit clouds the economic outlook with high uncertainty. The batch of mixed data prints weighed on the British Pound, with GBP/USD pulling back from the 1.3300 handle to end the day at 1.3208.
What’s Expected:
How To Trade This Event Risk
Bearish GBP Trade: U.K. Household Earnings Remains Subdued
Bullish GBP Trade: Job, Wage Growth Exceeds Market Forecast
GBP/USD Daily
============
Chart was made on MT5 with BrainTrading system (MT5) from this thread (free to download) as well as the following indicators from CodeBase:
All about BrainTrading system for MT5:
U.S. Commercial Crude Oil Inventories news event: intra-day bearish breakdown; daily bullish; 59.48 is the key
2017-10-18 15:30 GMT | [USD - Crude Oil Inventories]
[USD - Crude Oil Inventories] = Change in the number of barrels of crude oil held in inventory by commercial firms during the past week.
==========
"U.S. commercial crude oil inventories (excluding those in the Strategic Petroleum Reserve) decreased by 5.7 million barrels from the previous week."
==========
Crude Oil M5: bearish breakdown. The price broke 100 SMA/200 SMA to below to be reversed to the primary bearish market condition.
If the price breaks 58.10 resistance level to above on M5 close bar so the secondary correction within the primary bearish trend will be started.
If the price breaks 57.82 support level to below on M5 close bar so the primary bearish trend will be continuing.
If not so the price will be on ranging within the levels.
==========
Crude Oil Daily: bullish. Daily price is above Ichimoku cloud in the bullish area of the chart for ascending triangle pattern to be crossing to above together with 59.48 resistance level for the bullish trend to be continuing.
==========
Chart #1.
The chart was made on M15 timeframe with standard indicators of Metatrader 5 except the following indicator (free to download):
-----------
Chart #2.
The chart was made on D1 timeframe with Ichimoku market condition setup (MT5) from this post (free to download for indicators and template) as well as the following indicator from CodeBase:
AUD/USD Intra-Day Fundamentals: Australia Employment Change and range price movement
2017-10-19 01:30 GMT | [AUD - Employment Change]
if actual > forecast (or previous one) = good for currency (for AUD in our case)
[AUD - Employment Change] = Change in the number of employed people during the previous month.
==========
From official report :
==========
AUD/USD M5: range price movement by Australia Employment Change news event
==========
The chart was made on MT5 with MA Channel Stochastic system uploaded on this post, and using standard indicators from Metatrader 5 together with following indicators:
USD/CNH Intra-Day Fundamentals: China Gross Domestic Product and range price movement
2017-10-19 03:00 GMT | [CNY - GDP]
if actual > forecast (or previous one) = good for currency (for CNY in our case)
[CNY - GDP] = Change in the inflation-adjusted value of all goods and services produced by the economy.
==========
From official report :
==========
USD/CNH M5: range price movement by China Gross Domestic Product news event
==========
The chart was made on MT5 with MA Channel Stochastic system uploaded on this post, and using standard indicators from Metatrader 5 together with following indicators:
DAX Index - daily bullish ranging within narrow s/r levels (based on the article)
Daily price is located above Ichimoku cloud for the ranging within the following narrow support/resistance levels:
The price on the weekly chart is on testing with 13,030 resistance to above for thebullish trend to be continuing.
- "Yesterday, the DAX traded higher but found sellers and reversed. It wasn’t a ‘nasty’ reversal-day but the intra-day range of about 90 handles was the largest since the last trading day of September. It’s been a difficult little stretch indeed, with minimal volatility. That could be about to change."
- "The mini surge higher and reversal out of the high-level consolidation formation is the kind of price action we were looking for as a sign-post a pullback may be in store. A drop below the consolidation low at 12909 will undermine not only the congestion pattern but also put the index back below the record high recorded in June. In this case it is reasonable to expect at the least we see a move towards the swing-high from July beneath 12700. Even if the DAX is to trade to new heights the market is in need of a pullback."
- "Next week, the ECB meets on Thursday and we’ll learn more about the path Draghi and company want to take with regard to its QE program."
==========The chart was made on Metatrader 5 with Brainwashing system/AscTrend system (MT5) from this thread (free to download) together with following indicators:
Same system for MT4:
USD/CAD Intra-Day Fundamentals: Canada's Consumer Price Index and range price movement
2017-10-20 13:30 GMT | [CAD - CPI]
if actual > forecast (or previous one) = good for currency (for CAD in our case)
[CAD - CPI] = Change in the price of goods and services purchased by consumers.
==========
From official report :
==========
USD/CAD M15: range price movement by Canada's CPI news event
==========
Chart was made on Metatrader 5 with Brainwashing system/AscTrend system (MT5) from this thread (free to download) together with following indicators:
Same system for MT4:
EUR/USD - weekly bullish ranging foir direction (based on the article)
Weekly price is above Ichimoku kumo in the bullish ranging within 1.2091 resistance for the bullish trend to be continuing and 1.1422 support level for the secondary correction to be started.
==========
The chart was made on H4 timeframe with standard indicators of Metatrader 4 except the following indicators (free to download):