
*** Launch Discount: For one purchase is just $35, Price is 100$.
Contact me to send you instruction and add you in "Divergence group" for sharing or seeing experiences with other users.
Related Products:
All Divergences Scanner — User Manual
MetaTrader 5 / 4 indicator
1. What this indicator does
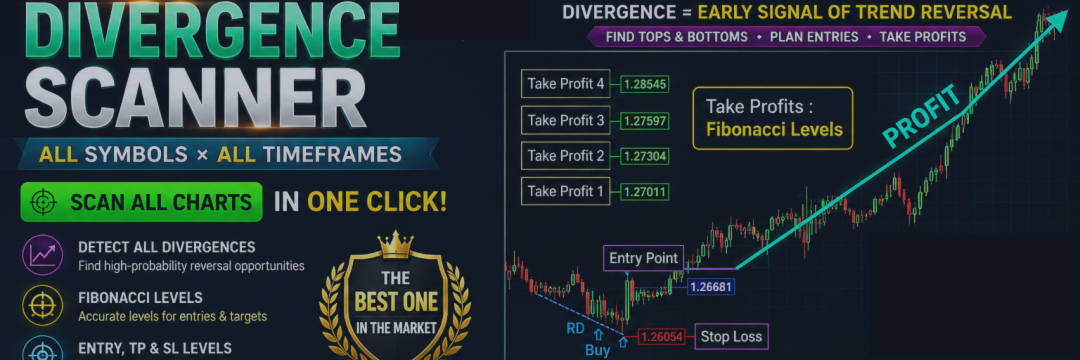
All Divergences Scanner watches your charts for divergences between price and an oscillator, and tells you the moment one appears.
It can work in two ways:
- On the open chart only — it marks every divergence it finds in the chart history.
- On your whole Market Watch list — it checks every symbol on every timeframe you choose, and alerts you when a new divergence shows up anywhere.
You pick one oscillator to work with:
RSI, CCI, MACD, OSMA, Stochastic, Awesome, Accelerator, Williams Percent Range, Relative Vigor Index, On Balance Volume. The chosen oscillator is drawn in the indicator window below the chart.2. Installation
3. The buttons on your chart
When the indicator starts, a small row of buttons appears at the top of the chart.
| Button | What it does |
|---|---|
| Scan All charts | Turns the full Market Watch scan on and off. Grey = off, green = on. |
| M1 … MN | The timeframes included in the scan. Green = included, grey = ignored. Click to toggle. |
| H | Hides and shows the whole button row, so it does not sit on top of your chart. |
The timeframe buttons start green or grey according to the TimeFrames input, so you can set your usual selection once and have it ready on every new chart.
4. The two scan modes
Open chart mode (this is the default)
The indicator marks the divergences it finds in the history of the chart you attached it to. Nothing else is scanned and no alerts are sent. This is the mode to use when you want to study one instrument, or check how the tool behaves on your favourite pair.
The number of candles examined comes from Scan the number of candles in open chart.
Scan All charts mode
Press the Scan All charts button. It turns green and the indicator starts checking every symbol in your Market Watch, on every green timeframe, and repeats that check every few minutes.
In this mode:
- Alerts, e-mails and push notifications are active.
- The chart you are looking at is still marked normally.
- Only the most recent candles are examined — set by Scan the number of candles, which is limited to 200 so the scan stays fast.
Press the button again to go back to open chart mode.
Tip: the more symbols and timeframes you switch on, the longer one full pass takes. Start with three or four timeframes, see how it feels, then add more.
5. Reading what you see on the chart
Arrows
- A down arrow above a candle marks a bearish (sell) divergence.
- An up arrow below a candle marks a bullish (buy) divergence.
Colours are set by the Bullish Divergence and Bearish Divergence inputs.
Lines
Two lines are drawn for every signal:
- One on the price chart, connecting the two highs or the two lows involved.
- One in the indicator window, connecting the matching two points on the oscillator.
Seeing both at once is the quickest way to judge the quality of a signal: the further the two lines lean in opposite directions, the stronger the divergence.
RD and HD labels
A small label sits on the price line:
| Label | Meaning |
|---|---|
| RD | Regular Divergence — often read as a sign that the current move is losing strength. |
| HD | Hidden Divergence — often read as a sign that the current trend may continue. |
Stop loss, entry and take profit levels
If TP&SL levels is on, the indicator also draws price labels on the right of the chart for the signal:
- one stop loss level,
- one entry level,
- take profit levels at the 38.2, 50, 61.8, 100 and 161.8 ratios of the move.
These are suggestions for where to look, not instructions. Always check them against your own plan and your own risk rules.
6. Alerts
Alerts only fire in Scan All charts mode, and only for a divergence the indicator has not reported before, so you do not get the same message twice.
| Type | How to switch it on |
|---|---|
| Pop-up alert | Automatic whenever Scan All charts is on. |
| Push notification (phone) | Set Push Notification to true . In MetaTrader go to Tools → Options → Notifications, tick Enable Push Notifications and enter the MetaQuotes ID from your mobile app. |
| Set Send email to true . In MetaTrader go to Tools → Options → Email and fill in your mail server details, then press Test. |
A push notification carries the direction, the symbol, the timeframe, the oscillator used, and the stop loss, entry and first four take profit levels.
Use Alert Time Start and Alert Time End to keep alerts inside your working hours. The hours follow your computer clock, not the broker clock.
How many candles are past a pattern controls how fresh a signal must be to be worth an alert. With the default 1 , you are told about divergences that have just formed. Raise it if you also want to hear about signals from a few candles back.
7. Settings reference
Scanner
| Input | Meaning |
|---|---|
| Divergence Mode | Which oscillator to use: RSI, CCI, %R, Stochastic, MACD or osMA. |
| Scan the number of candles | How many recent candles are checked in Scan All charts mode. Maximum 200. |
| Scan the number of candles in open chart | How many candles are checked on the open chart. Lower this if your charts feel slow. |
| Rescan Timer (Minute) | How often the full scan is repeated. |
| TimeFrames | Which timeframe buttons start switched on, for example M15,H1,H4,D1 . |
| Symbols for scan | All Symbols in market watch list, or Just symbol in open chart. |
Pattern Feature
These control how sensitive the indicator is when it picks out the swing highs and lows a divergence is measured between.
| Input | Meaning |
|---|---|
| Swing Period | Larger value = only bigger swings are considered, fewer and cleaner signals. Smaller value = more signals, more noise. |
| Deviation | How far price must move before a new swing counts. |
| Backstep | Minimum distance between two swings. |
| Wing length | Reserved, has no effect on the current version. |
Oscillator settings
Each oscillator has its own group. Only the group of the mode you selected is used; the rest are ignored.
| Group | Inputs |
|---|---|
| RSI Feature | RSI Period, RSI Low sensitive, RSI High sensitive |
| MACD Feature | Fast EMA, Slow EMA, Signal SMA |
| CCI Feature | CCI Period, CCI Low sensitive, CCI High sensitive |
| %R Feature | %R Period, %R Low sensitive, %R High sensitive |
| Stochastic Feature | K Period, D Period, Slowing |
| osMA Feature | Fast EMA, Slow EMA, Signal SMA |
The Low sensitive and High sensitive values are the oversold and overbought levels the scanner uses. Move them closer together for more signals, further apart for fewer and more selective ones.
Note on %R: Williams %R runs from −100 to 0, so its two levels are negative (defaults −80 and −20). The Stochastic mode shares the two RSI sensitivity values, since both run from 0 to 100.
Display Options
| Input | Meaning |
|---|---|
| Chart view | Switches the chart to a white or black theme, or leaves it as it is. |
| Name in chart | Shows the oscillator name in the chart comment. |
| Bullish Divergence / Bearish Divergence | Colours of the arrows, lines and labels. |
| Clear old drawings before repaint | Keep this on. Old markings are removed before the chart is drawn again, so signals never pile up on top of each other. |
| Repaint the open chart on a new bar | Keeps the open chart up to date as new candles form. |
Stop Loss / Take Profit style
| Input | Meaning |
|---|---|
| TP&SL levels | Draws the stop loss, entry and take profit labels. Turn off for a cleaner chart. |
| Stop loss / Take Profit / Entry Point | Colour of each level. |
| Line size | Thickness of the stop loss line. |
Alert settings
| Input | Meaning |
|---|---|
| Push Notification | Send signals to the MetaTrader mobile app. |
| Send email | Send signals to your e-mail address. |
| How many candles are past a pattern | How fresh a signal must be to trigger an alert. |
| Alert Buffer Size | How many past alerts are remembered, so the same signal is not repeated. |
| Alert Time Start / End | The hours of your computer clock in which alerts are allowed. |
8. Strategy Tester
You can run the indicator in the Strategy Tester in visual mode to watch the signals appear candle by candle. In the tester the indicator works on the tested symbol only, which is what the tester provides.
Signals are drawn in RSI mode. For the other oscillators the tester shows a short message on the chart instead — please contact the author for the free tester version if you want to check one of them.
If the visual test runs slowly, lower Scan the number of candles in open chart to around 500. It does not change anything about live scanning.
9. Suggested starting points
- Trading one pair on H1 or H4: leave Scan All charts off, use RSI mode, Swing Period around 10 to 12.
- Watching a basket of pairs: turn Scan All charts on, switch on M15, H1, H4 and D1 only, set Rescan Timer to 15 minutes, and enable push notifications.
- Fewer, stronger signals: raise Swing Period, and widen the two sensitivity levels.
- More signals to study: lower Swing Period, and narrow the two sensitivity levels.
A divergence is a warning that a move is losing momentum, not a trade on its own. Most traders wait for a confirmation — a break of a level, a candle pattern, a change of structure — before acting on one.
10. If something does not look right
No arrows on the chart at all The chart may not hold enough history. Scroll back, or press Home to load more candles. Also check that the timeframe button for the chart's timeframe is green.
The scan button will not turn green Scan the number of candles must be 200 or less. A message appears on the chart if it is higher.
A symbol in Market Watch is never reported Its history may still be downloading. Open the symbol chart once so MetaTrader loads it, then scan again. Symbols that are disabled for trading at your broker are skipped.
No push notification arrives Check Tools → Options → Notifications, that the MetaQuotes ID is correct, and that Scan All charts is on. Also check the current hour against Alert Time Start and Alert Time End.
Charts feel heavy Reduce the number of green timeframes, lower Scan the number of candles in open chart, or raise Rescan Timer.
The button row is in the way Press H to hide it.
All Divergences Scanner · MetaTrader 5 / 4 · developed by Reza Aghajanpour