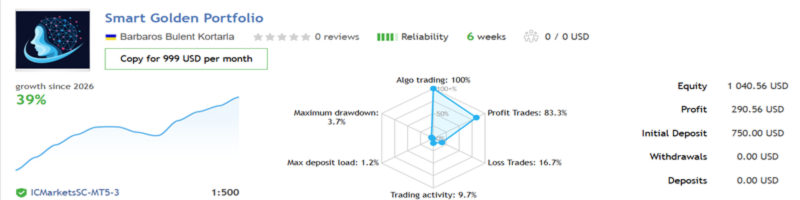
My AI Gold vs Smart Golden Portfolio— Live Performance Update (October 24, 2026)

On October 12, I published a data-driven comparison between Smart Golden Portfolio (SGP) and My AI Gold, using their publicly available MQL5 live trading statistics.
Nearly two weeks later, both systems remain profitable, but the updated numbers reveal some interesting developments.
Updated Live Performance
Both comparison accounts operate on the same ICMarketsSC-MT5-3 server with 1:500 leverage.
| Metric | Smart Golden Portfolio | My AI Gold |
|---|---|---|
| EA Price | $299 | $799.95 |
| Total Growth | +38.74% | +11.76% |
| Closed Trades | 12 | 25 |
| Win Rate | 83.33% | 84.00% |
| Profit Factor | 9.47 | 2.43 |
| Recovery Factor | 8.47 | 3.14 |
| Equity Drawdown | 2.63% | 3.74% |
| Average Win | $32.49 | $95.05 |
| Average Loss | -$17.15 | -$204.93 |
Figures reflect the MQL5 statistics retrieved for this update. Account sizes and risk settings differ.
What Changed Since October 12?
Smart Golden Portfolio
-
Growth: 26.28% → 38.74%
-
Profit Factor: 6.75 → 9.47
-
Win Rate: 77.77% → 83.33%
My AI Gold
-
Growth: 9.52% → 11.76%
-
Profit Factor: 2.54 → 2.43
-
Win Rate: 84.21% → 84.00%
Both systems continued generating positive cumulative results, but SGP showed stronger improvement in growth and profit factor.
The Most Important Difference: Risk vs Reward
The real distinction is not the win rate.
SGP's average winning trade is approximately 1.89 times its average losing trade.
My AI Gold shows the opposite relationship: its average loss is approximately 2.16 times its average win.
This means My AI Gold relies more heavily on maintaining a high percentage of winning trades, while SGP currently benefits from a more favorable realized win-to-loss relationship.
Final Verdict
Two weeks after our initial comparison, Smart Golden Portfolio has strengthened its position in the reported live statistics.
It currently leads in growth, profit factor, recovery factor, relative equity drawdown, and average win-to-loss ratio.
However, SGP has completed only 12 trades. Both signals need longer monitoring periods before their long-term reliability can be assessed.
The most encouraging development is not simply SGP's 38.74% growth, but its combination of profitability, controlled historical drawdown, and favorable trade distribution
Verify the Results
Data reviewed October 24, 2026. Results are based on publicly displayed MQL5 signal statistics. Historical performance does not guarantee future results.