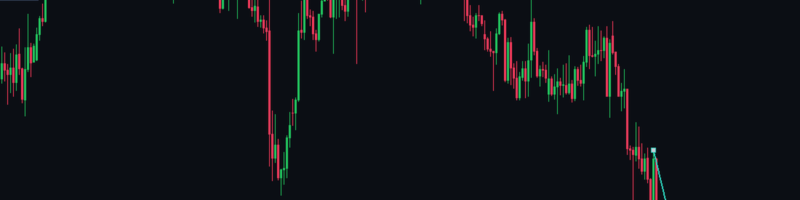

A ruler tells you a move was 500 points. It does not tell you whether 500 points in 12 bars is ordinary or rare on this symbol. Move Ruler does: drag it over any move and it compares the move with every past span of the same number of bars.
What you see
- On the chart: a ruler you drag by its ends, and a label with the move in points, the number of bars and how rare it is ("1 in 24"). Pink when under 10% of past spans got as far, grey when over half did.
- The panel: the move in points and percent, the bars and time it took, the value per 1 lot in your account currency, the share of past spans that got as far, and the usual and 1-in-10 reach for that many bars.
The figures
On gold H1 (last 5000 spans), a usual 5-bar span reached 4,782 points and 1 in 10 reached 10,089 points. On EURUSD M15, a usual 5-bar span reached 101 points and 1 in 10 reached 221 points. Every figure is recomputed by a separate implementation before each release.
A fair comparison
Each past span is measured by its full reach, the distance between its high and its low, so a measured move is never compared with something smaller than it could have been.
Settings in brief
Past spans compared (5000 by default), where the ruler starts, colours, panel corner and size, and a key (H) that hides or shows everything.
Move Ruler is free: https://www.mql5.com/en/market/product/203576