
A long wick is the part of a candle where price went and came back. Traders read them all day, but few have counted them. Wick Map counts every one on your symbol and puts the result on a clock.
Midnight on EURUSD
At 00:00 broker time, 32% of EURUSD M15 candles had a long lower wick, against 17% over all hours: about twice as often. If you watch EURUSD around midnight on your server, you have probably seen these candles; now you can see how often they happen on your own broker's data.
Upper or lower?
Over the last 5000 bars:
| Market | Long upper wicks | Long lower wicks |
|---|---|---|
| US500 (D1) | 11.8% of days | 19.8% of days |
| USDJPY (H4) | 13.6% | 18.9% |
| Gold (H1) | 15.6% | 16.7% |
| EURUSD (M15) | 16.5% | 17.2% |
On US500 daily, long lower wicks were about 1.7 times as common as long upper wicks.
How to read the clock
- One column per hour of the day, in your broker's time; on daily charts, one column per weekday.
- Pink above the line: the share of candles in that hour with a long upper wick. Aqua below: long lower wicks.
- The hour now is underlined; hours with fewer than 20 candles are grey.
A wick counts as long when it covers at least half of the candle's range (you can set this from 20% to 90%). Only finished candles count.
On the chart and in the panel
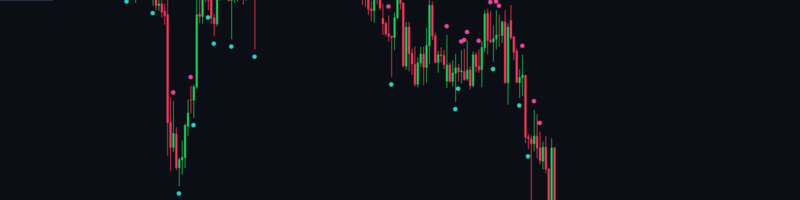
Every long wick gets a small dot at its tip. The panel adds the shares for the hour now, the peak hour for each kind of wick, and today's long wicks so far against the usual number for the same hours.
Useful? A short review on its Market page helps other traders find it.
Wick Map is free: https://www.mql5.com/en/market/product/204287. The figures describe past candles on that chart, not future ones.