Why Standard AI Fails on Candlestick Charts: Continuous OHLCV Ratios, Volume, and Multi-Timeframe Volatility

Why do standard language models fail so badly when you feed them raw candlestick and volume data across multiple timeframes?
Two empirical time-series studies released this month—the KiT Financial Time-Series Foundation Model paper (trained across 3 billion OHLCV bars from M1 to D1) and this week's out-of-sample financial evaluation of Mistral's new Timestral architecture—point directly to the mathematical root cause.
📊 Key Findings from October 2026 Time-Series Research
- Discrete Tokens Break Candlestick Math: Standard LLMs chop continuous numbers into discrete text tokens and predict step-by-step. Small quantization errors compound across bars until multi-timeframe structure dissolves into noise.
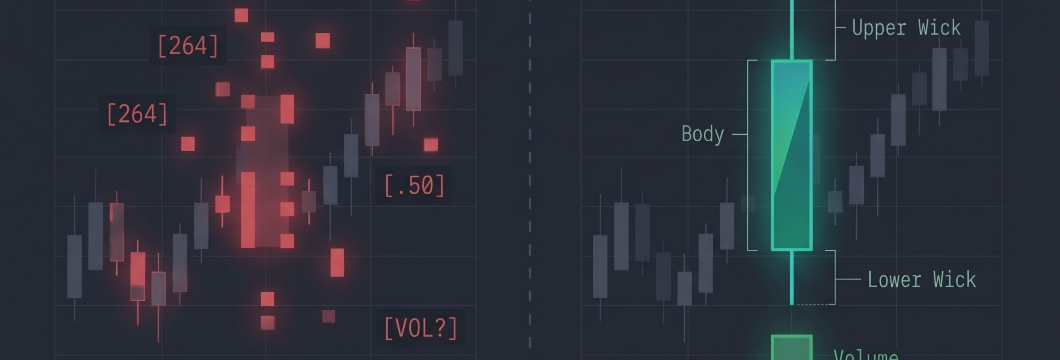
- Continuous OHLCV Log-Ratios Work: By decomposing each bar into five continuous log-ratio components—open gap, candle body, upper shadow, lower shadow, and log-volume—the KiT model preserved scale invariance across seven timeframes (M1 to D1).
- Volume & Volatility Beat Price Guessing: Across both the KiT benchmark (0.66 RankIC on volatility) and the October 2026 Timestral replication, the strongest out-of-sample predictability was found in volume dynamics and volatility regimes—not raw directional price guessing.
Markets Move in Continuous Ratios, Not Text Chunks
If you have ever watched an indicator read -0.01 on one chart and 508,887,146 on another simply because you changed the instrument or the timeframe dropdown, you have seen scale-variance break a formula in real time.
Financial markets do not move in isolated, discrete steps. A candlestick is a structural summary of an auction: how far price gapped, how much of the range held in the body versus the wicks, and how much tick volume drove the displacement. If you do not normalize volume and volatility relative to the active regime, the math breaks the moment you switch from Daily bars to M5.
Stop Guessing Price—Measure Volume Flow and Volatility Bounds
The clearest takeaway from current foundation-model research is something veteran quantitative developers already practice: stop forcing math to predict tomorrow's price tick, and start measuring today's volume and volatility state accurately.
Every tool I publish is built as a falsification-first measurement instrument on closed bars—describing what volume, momentum, and volatility have actually done within adaptive statistical bounds, without repainting or performance claims:
📈 VOLUME AND ORDER FLOW — Measuring displacement & adaptive bounds
- ▸ Anchored Volume Delta with Adaptive Bands (MT5) · 🆓 · MT4 Version (🆓)
- ▸ OBVCD Pro (MT5) · $49 · OBVCD Pro MT4 ($49)
⚡ MOMENTUM AND VOLATILITY — Price velocity scaled by volume
📊 MULTI-TIMEFRAME DECOMPOSITION — All 8 majors across 28 pairs
👉 Explore all 18 measurement tools on my MQL5 profile: mql5.com/en/users/naamo (@naamo)
💬 How do you handle multi-timeframe volume and volatility normalization in your own indicators or Python research pipelines?
📚 References & Further Reading:
- KiT: A Foundation Model for Financial Time-Series Forecasting (arXiv: 2609.34507): https://arxiv.org/abs/2609.34507
- Forecasting Financial Markets with Timestral (Out-of-sample evaluation, Oct 23, 2026): https://philippdubach.com/posts/forecasting-financial-markets-with-timestral/