Drawdown Map: how deep is this fall, how long has it lasted, and how often did price get back?

A chart shows where price is. It does not show how far it has fallen from its last peak, or for how long. Drawdown Map adds that missing view: a window under the chart that paints every drawdown in the history, and a panel with the numbers for today.
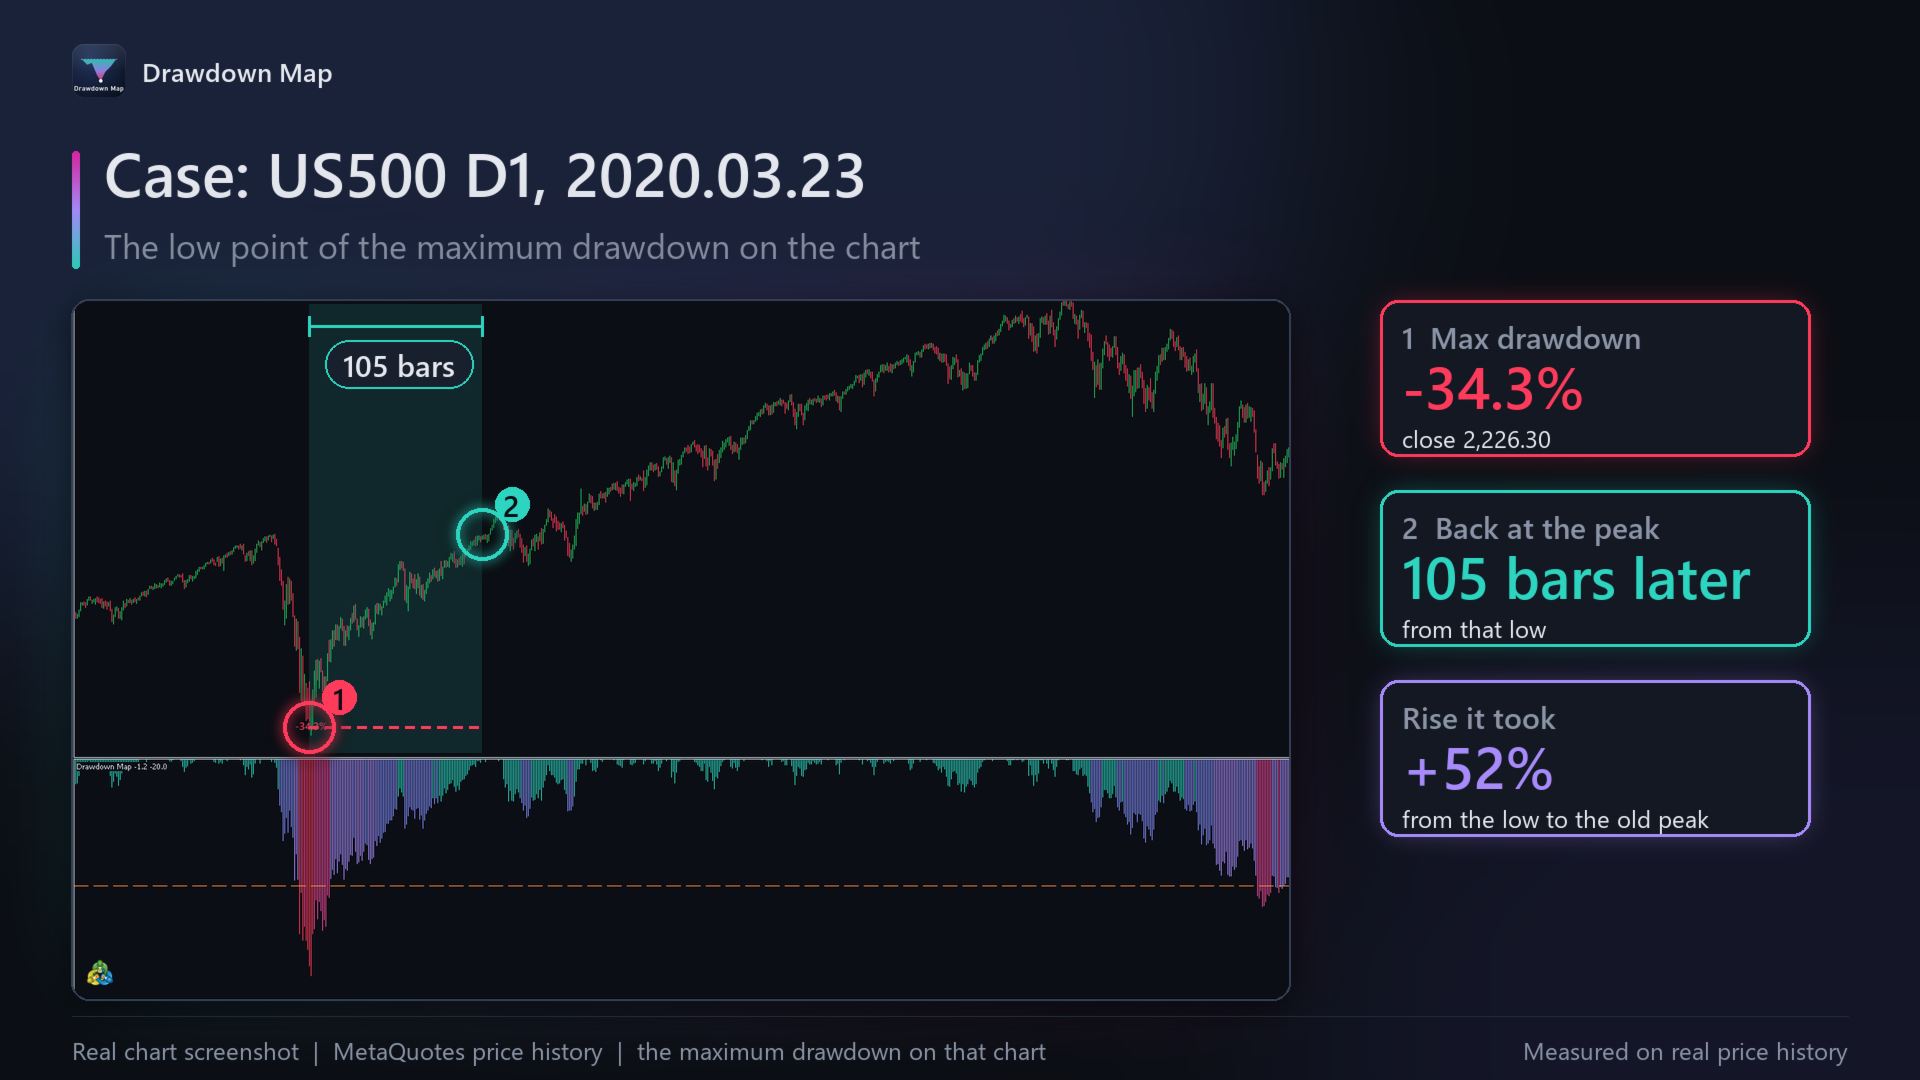
Two crashes, measured
| Market | Maximum drawdown | Low point | Bars to the old peak | Rise it took |
|---|---|---|---|---|
| US500 (D1) | 34.3% | 23 March 2020 | 105 | +52% |
| Gold (D1) | 44.6% | 17 December 2015 | 1186 | +81% |
Same tool, very different stories: US500 was back at its peak in about five months; gold needed four and a half years.
Why depth matters
A fall needs a bigger rise to undo it: -10% needs +11.1%, -20% needs +25%, -30% needs +42.9%, and -50% needs +100%. The panel shows that rise for the drawdown you are in now.
How often it came back
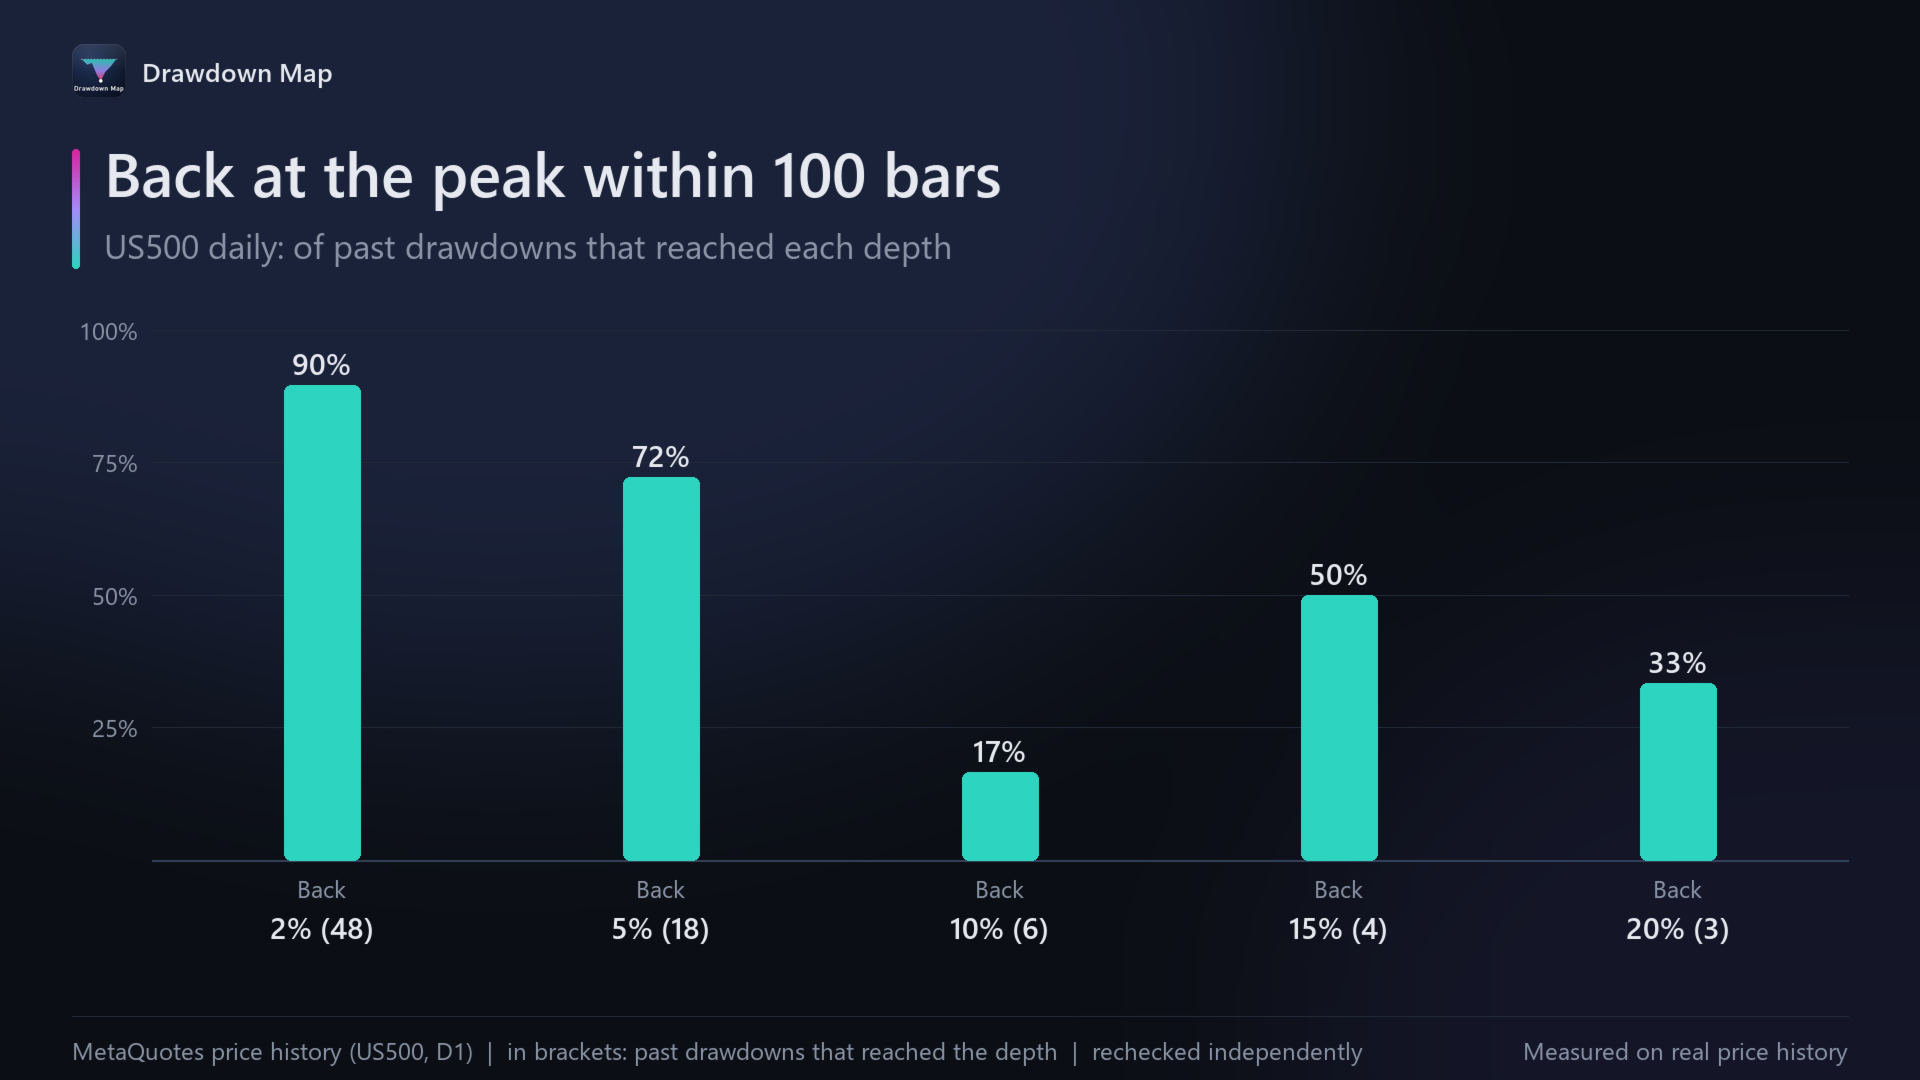
For the depth of the drawdown you are in now, the panel counts the past drawdowns on the same chart that reached it and shows what happened next: how many got back to the peak within 100 bars, how many went 1.5 times deeper first, and the typical number of bars the way back took. On US500 daily, 18 past drawdowns reached 5%: 72% got back to the peak within 100 bars, 61% went 1.5 times deeper first, and the typical way back took 18 bars.
What is on the chart
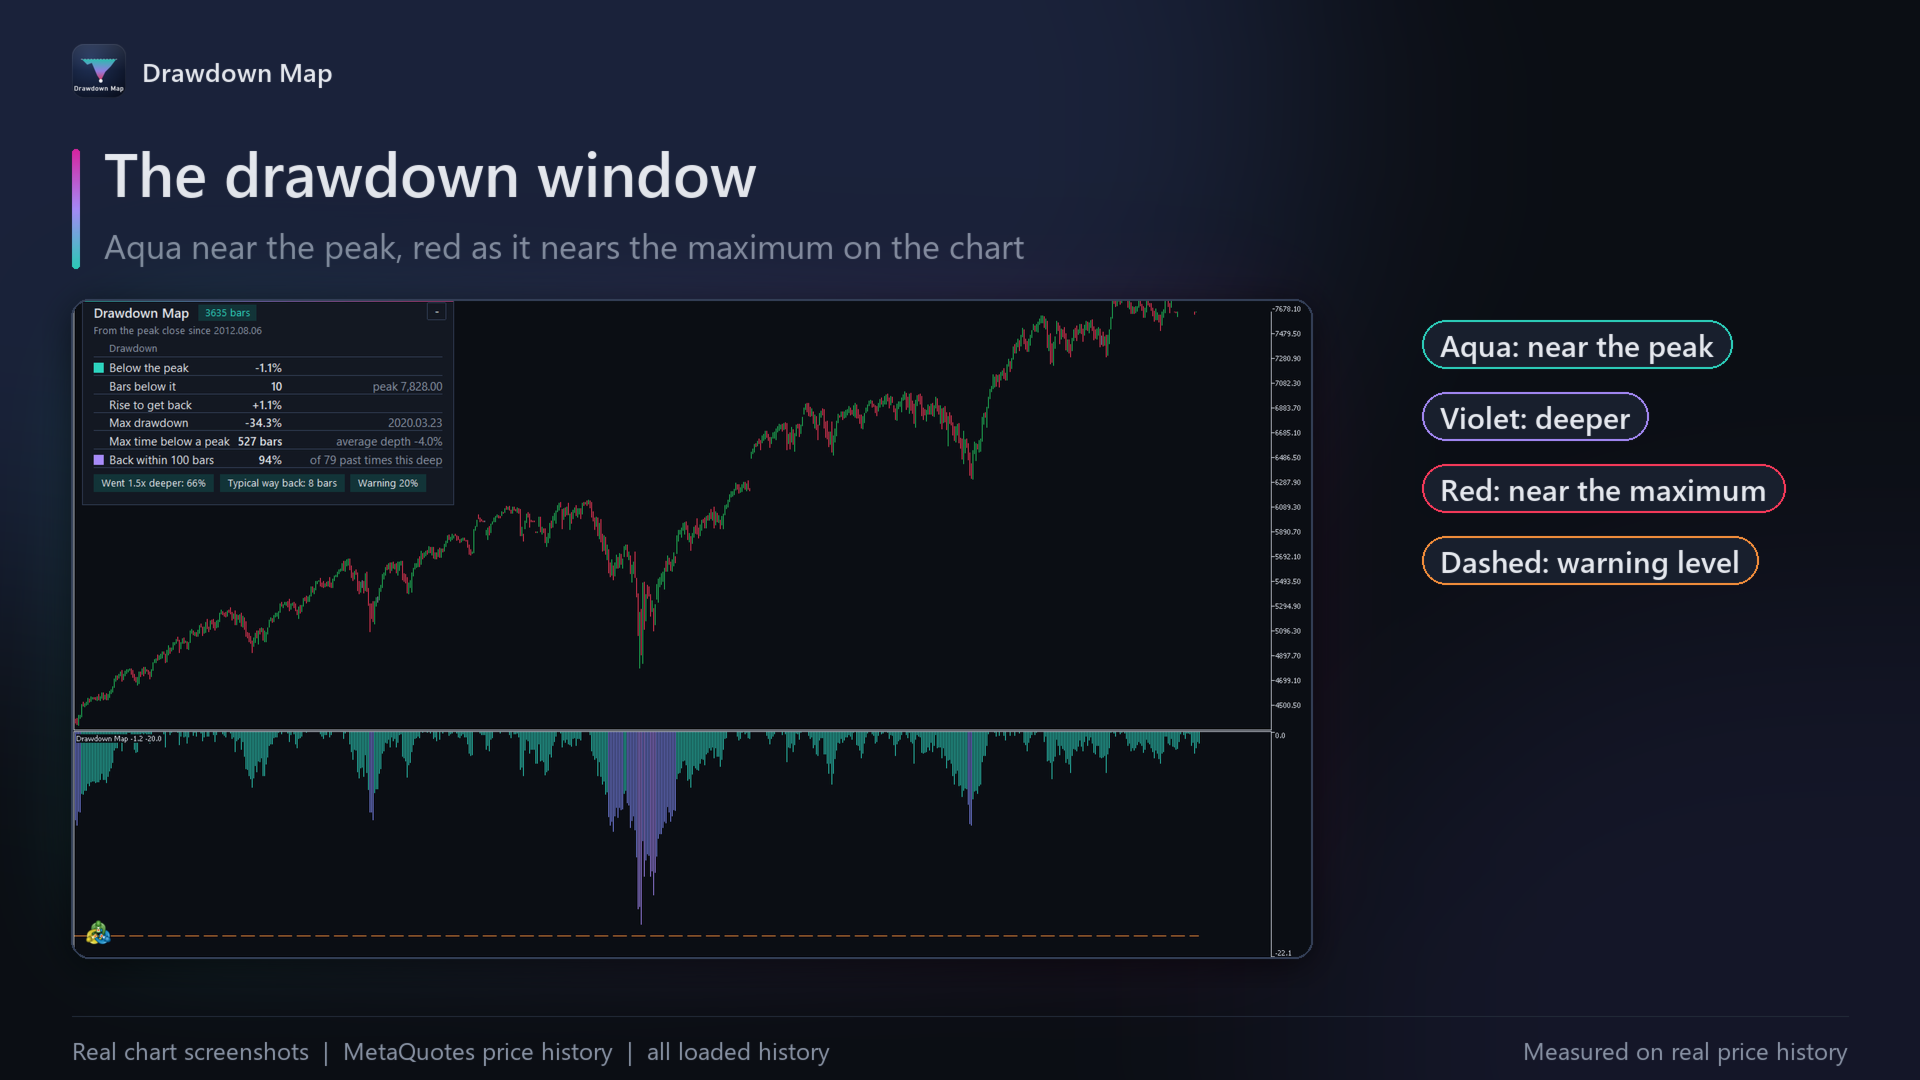
- The drawdown window: every bar's distance below its peak, aqua near the peak, violet deeper, red near the maximum on the chart, with a dashed warning line.
- Labels: the low point of each past drawdown that went beyond the warning level.
- The panel: below the peak now, bars below it, rise to get back, maximum drawdown and its date, maximum time below a peak, and the record of past drawdowns this deep.
Good to know
- Closes or highs and lows, your choice; only closed bars, so it never repaints.
- Any symbol and timeframe; daily charts show the long story clearly.
- Alerts at the warning level, at a new maximum drawdown and at a new peak.
Drawdown Map is free: https://www.mql5.com/en/market/product/202856. The figures describe the past on that chart: a drawdown can go further than any before it.