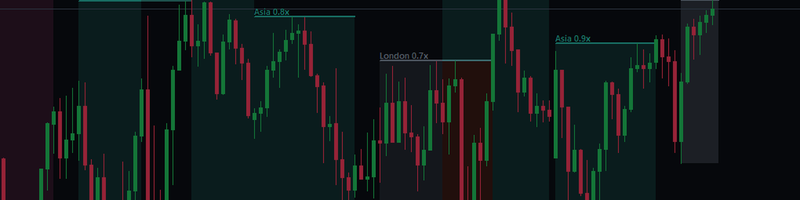
"London is busy today" means little without knowing what a normal London session looks like on that symbol. Session Ranges measures it from the symbol's own history and shows every session against its own normal.
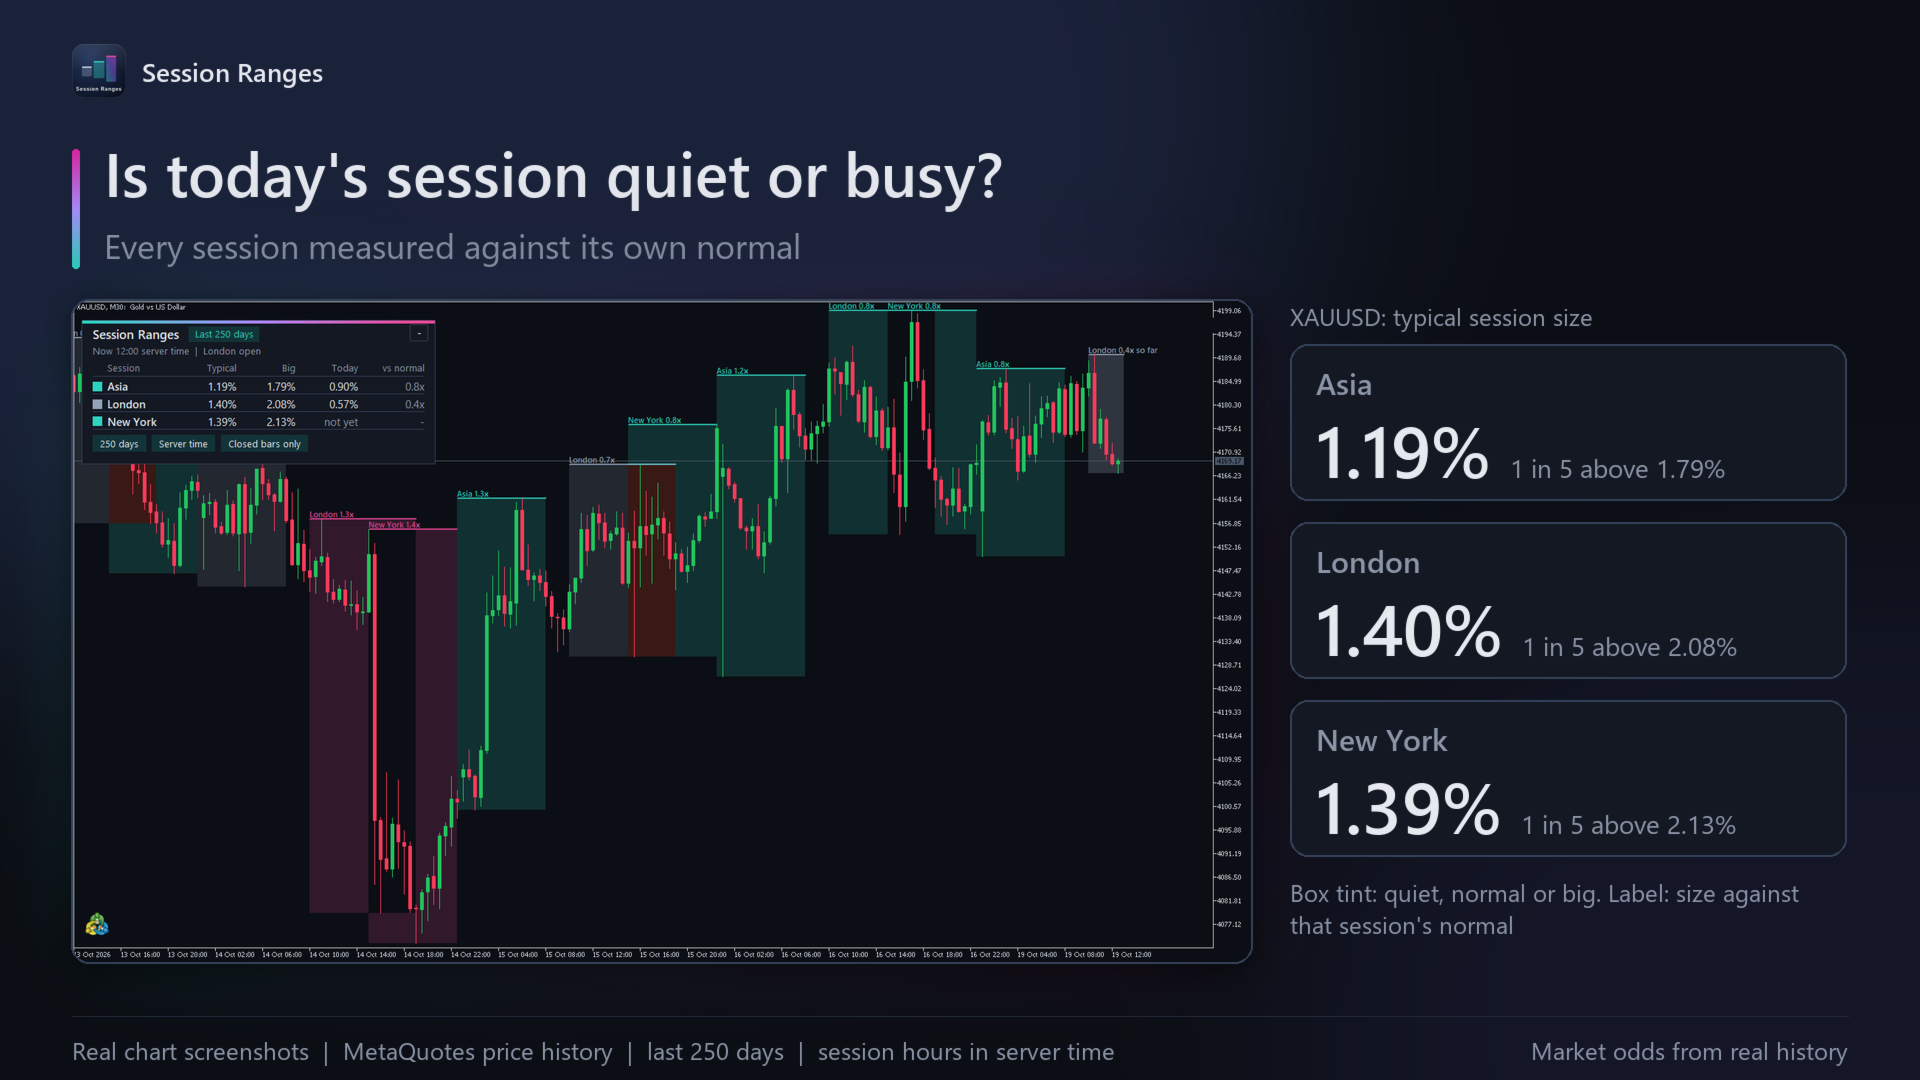
What you see
A box is drawn around each Asia, London and New York session of the last days, from the session's high to its low. The tint tells you its size at a glance:
- quiet: under 0.7 times that session's normal size,
- normal,
- big: 1.3 times normal or more.
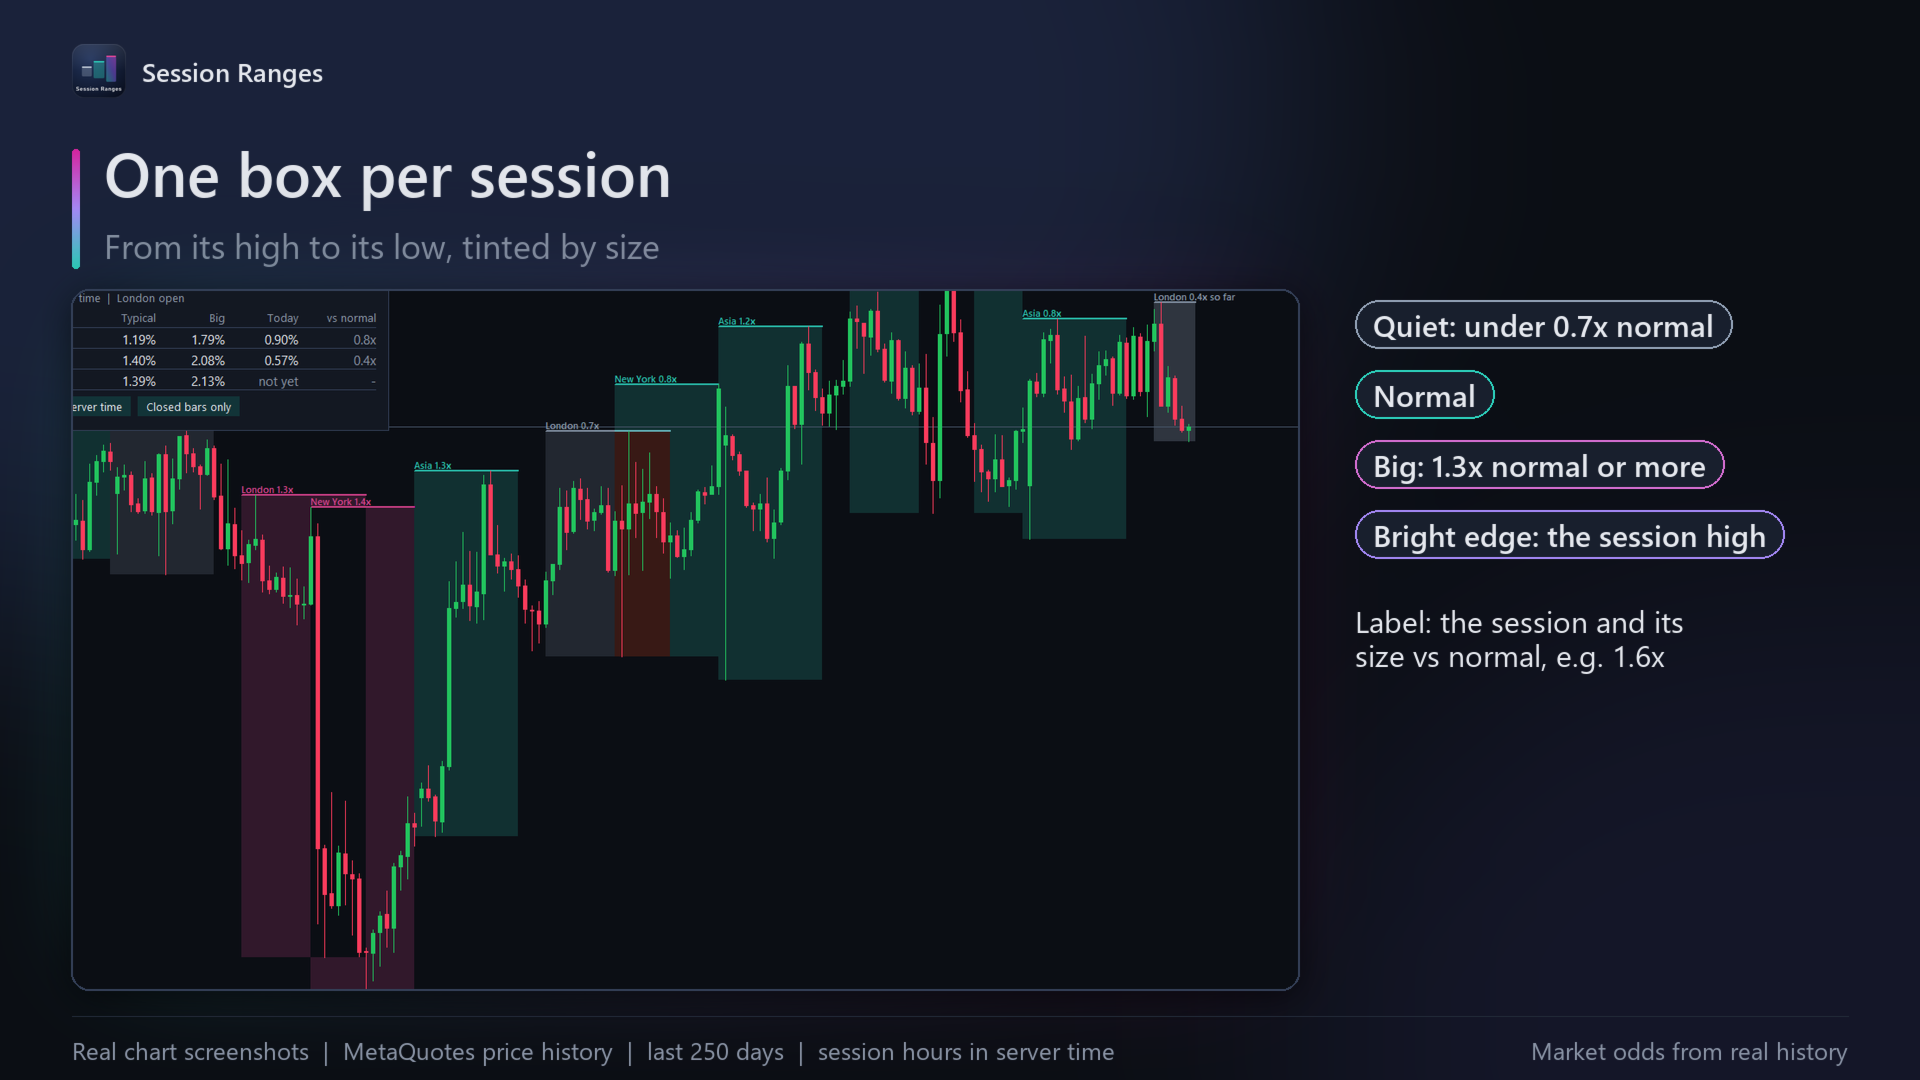
Each box is labelled with its multiple, for example "London 1.6x". Today's sessions are drawn as they form.
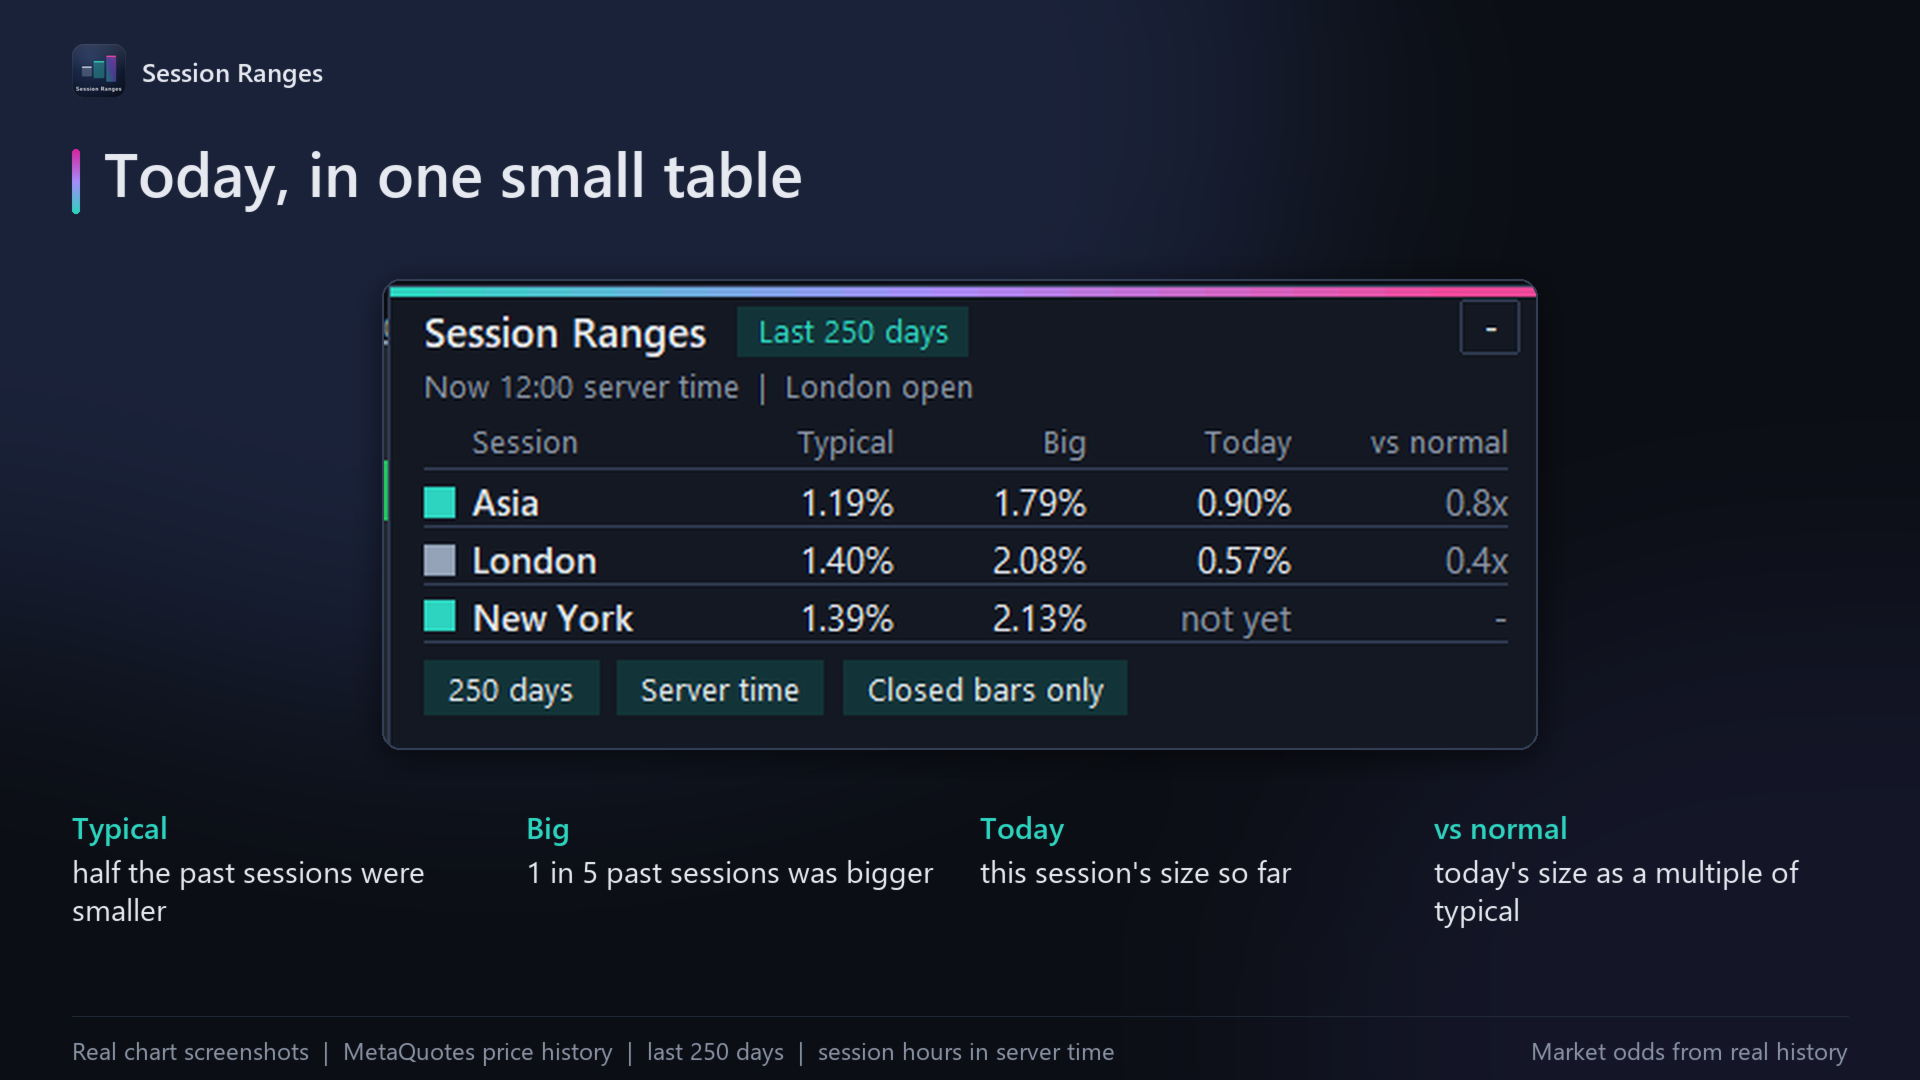
A small table in the corner gives, for each session, its typical size, its big size (1 in 5 past sessions was bigger), today's size so far and today's multiple of normal.
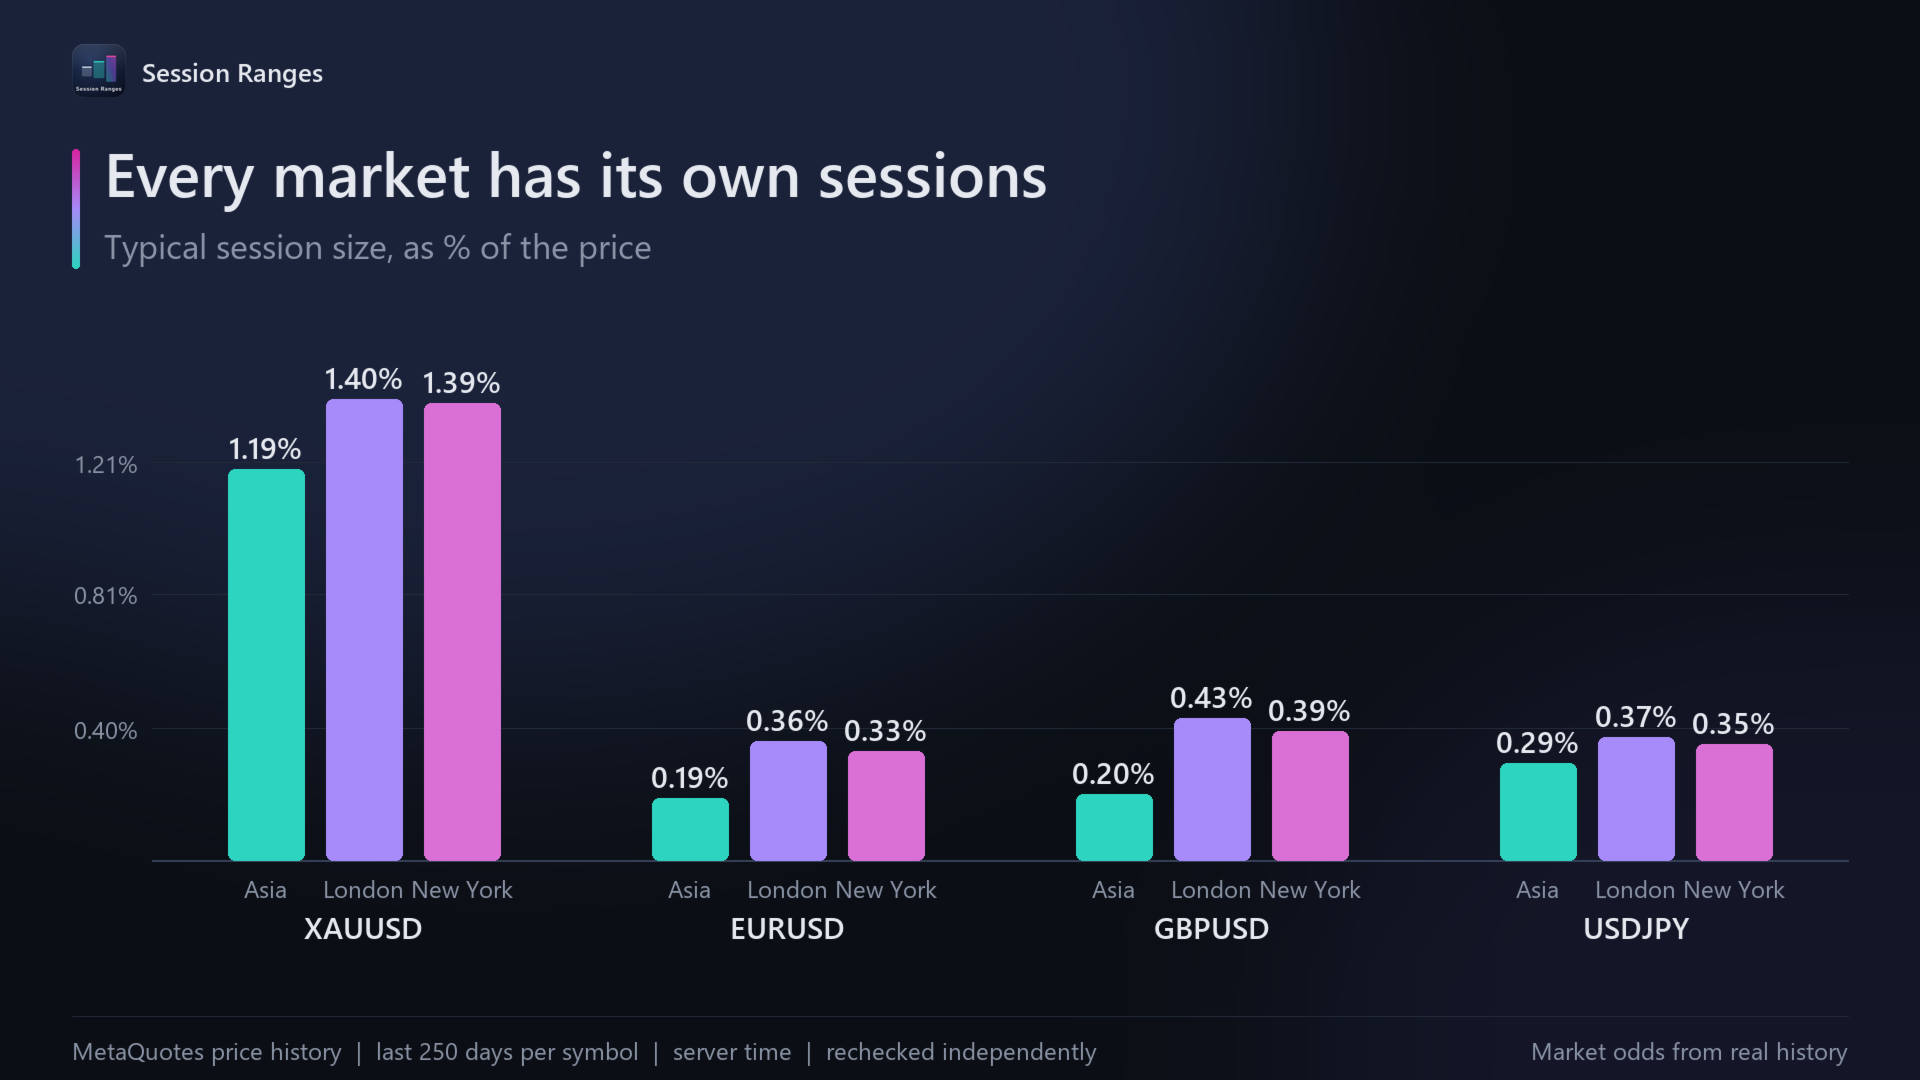
Every market has its own sessions
On EURUSD a typical London session was almost twice a typical Asia session over the last 250 days. On gold the three sessions were much closer. Sizes are measured as a percentage of price, so calm and busy years compare fairly.
Your hours
Brokers use different server times. The start and end hour of each session are settings, on your broker's server time by default or on New York, London, Tokyo or UTC time, each with its own daylight saving, so the sessions stay on the market's hours through the clock changes. Killzone hours are one click away.
No repainting
Only closed hourly bars count towards the statistics. Today's boxes follow today's prices as the session forms.
Settings in brief
Past days used (250 by default), the clock and the hours of each session, how many past days get boxes, colours, size labels, short session names (AS, LDN, NY), panel corner and size, a key (H) that hides or shows everything, and an alert when today's session becomes big. Charts from M1 to H1.
Try it
Session Ranges on the MQL5 Market: https://www.mql5.com/en/market/product/202307. Free. The figures describe past sessions, not the future.