
Flow Anchor Indicator: Non-Repainting RMI Trend Engine with Range-Weighted Anchor and Adaptive Flow Band for MT4 and MT5

Introduction
Most trend indicators struggle with two persistent problems. The first is direction confidence — a moving average tells you "up" or "down" but gives no measure of whether market participation actually supports the move. The second is location — a moving average tells you direction but rarely matches where, on the chart, the trend is anchored relative to current price.
Flow Anchor Indicator addresses both. It combines a Relative Momentum Index (RMI) — a hybrid of the standard RSI and Money Flow Index — with a custom range-weighted moving average and an ATR-derived adaptive band. The RMI handles direction confidence. The range-weighted moving average handles structural location. The adaptive band offsets the anchor line so it acts as a trailing reference rather than a coincident one.
Download the indicator:
- MetaTrader 5: Flow Anchor MT5
- MetaTrader 4: Flow Anchor MT4
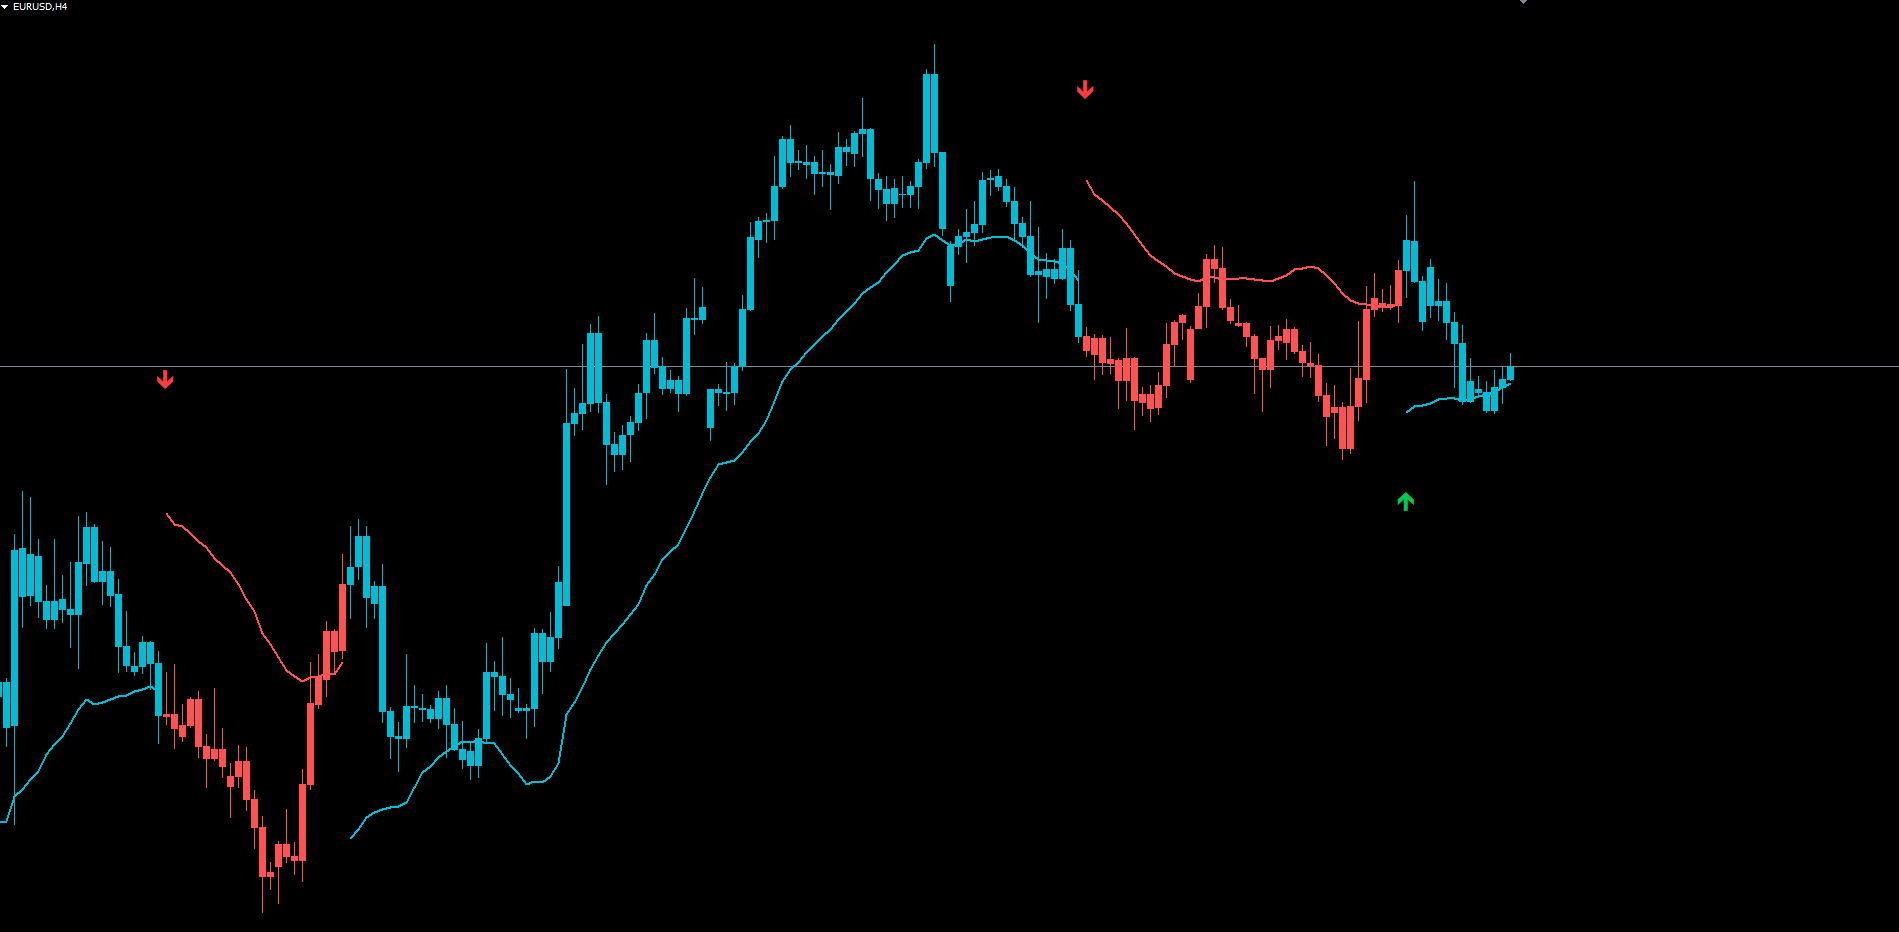
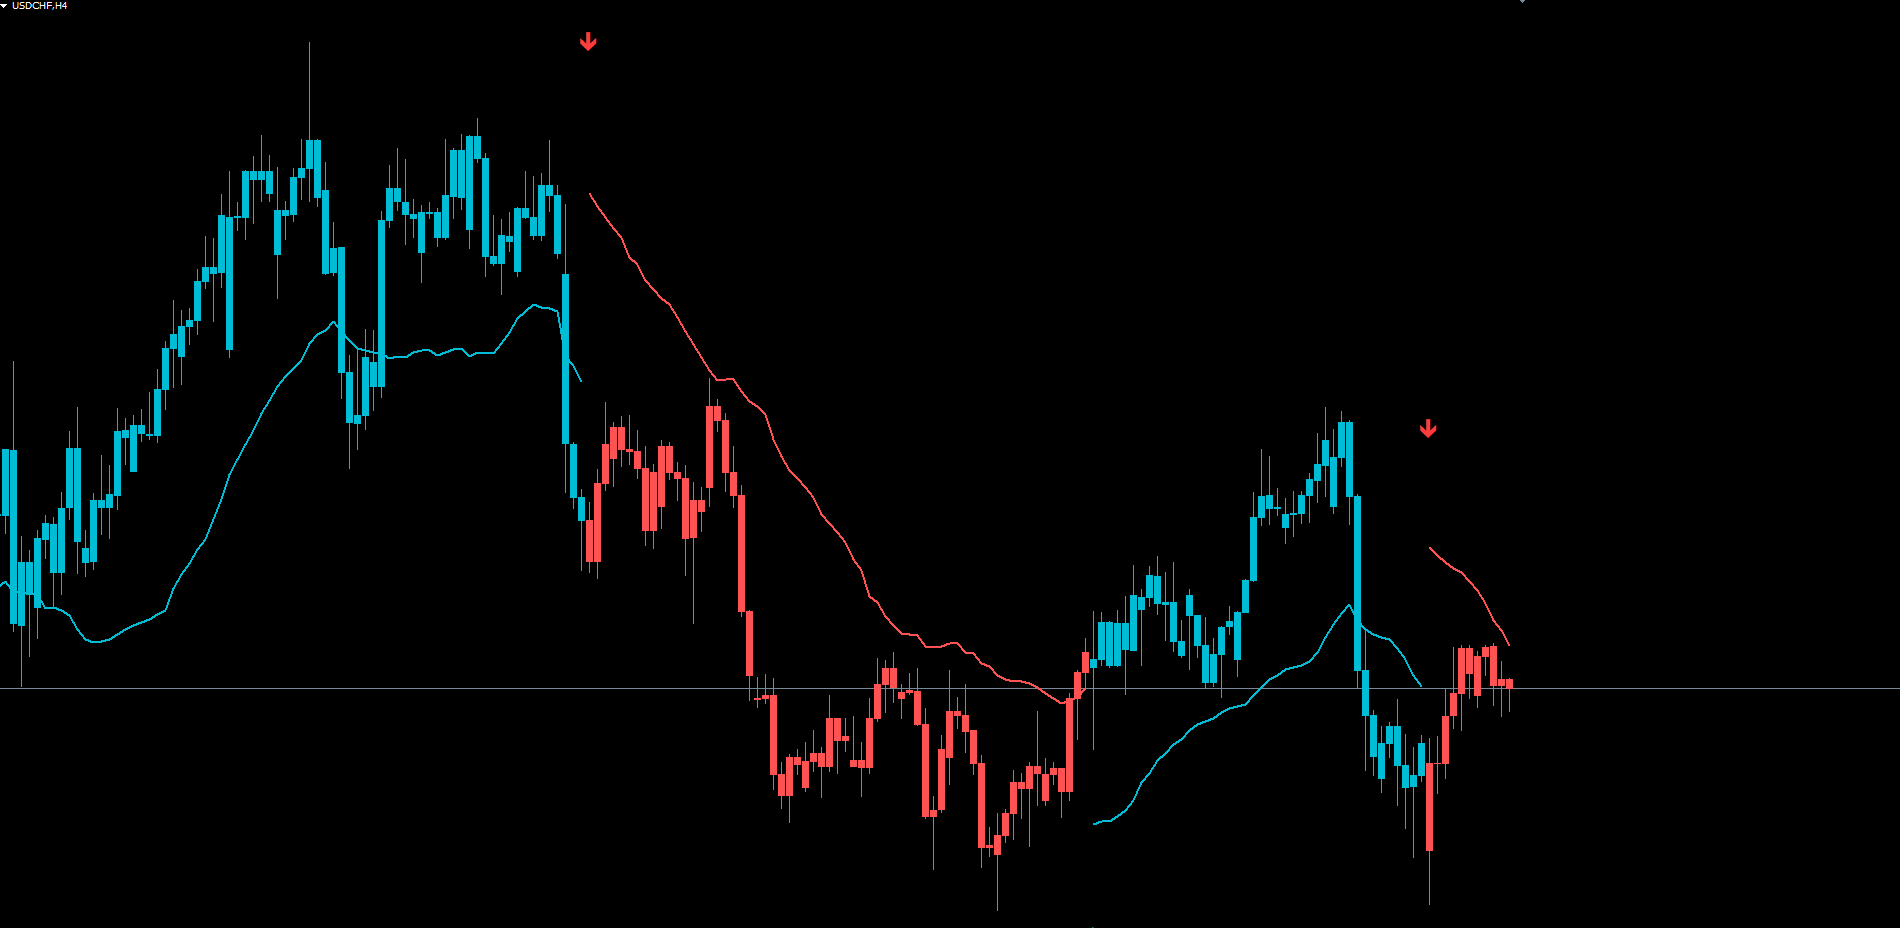
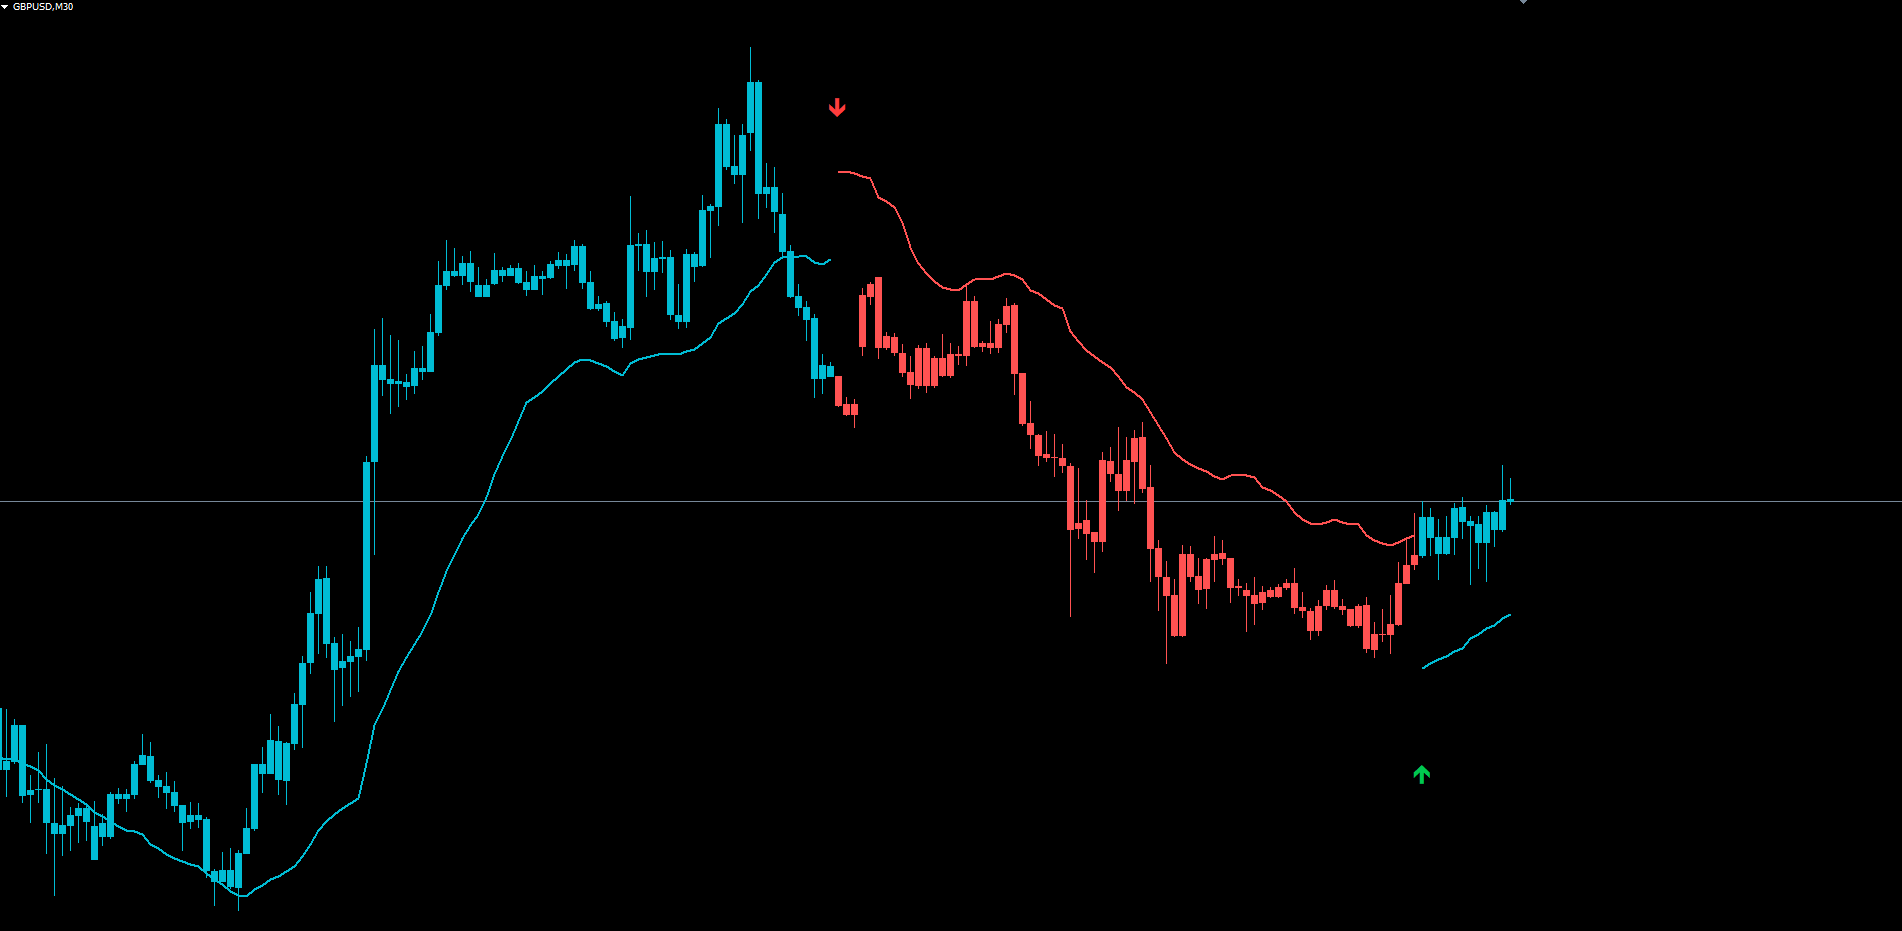
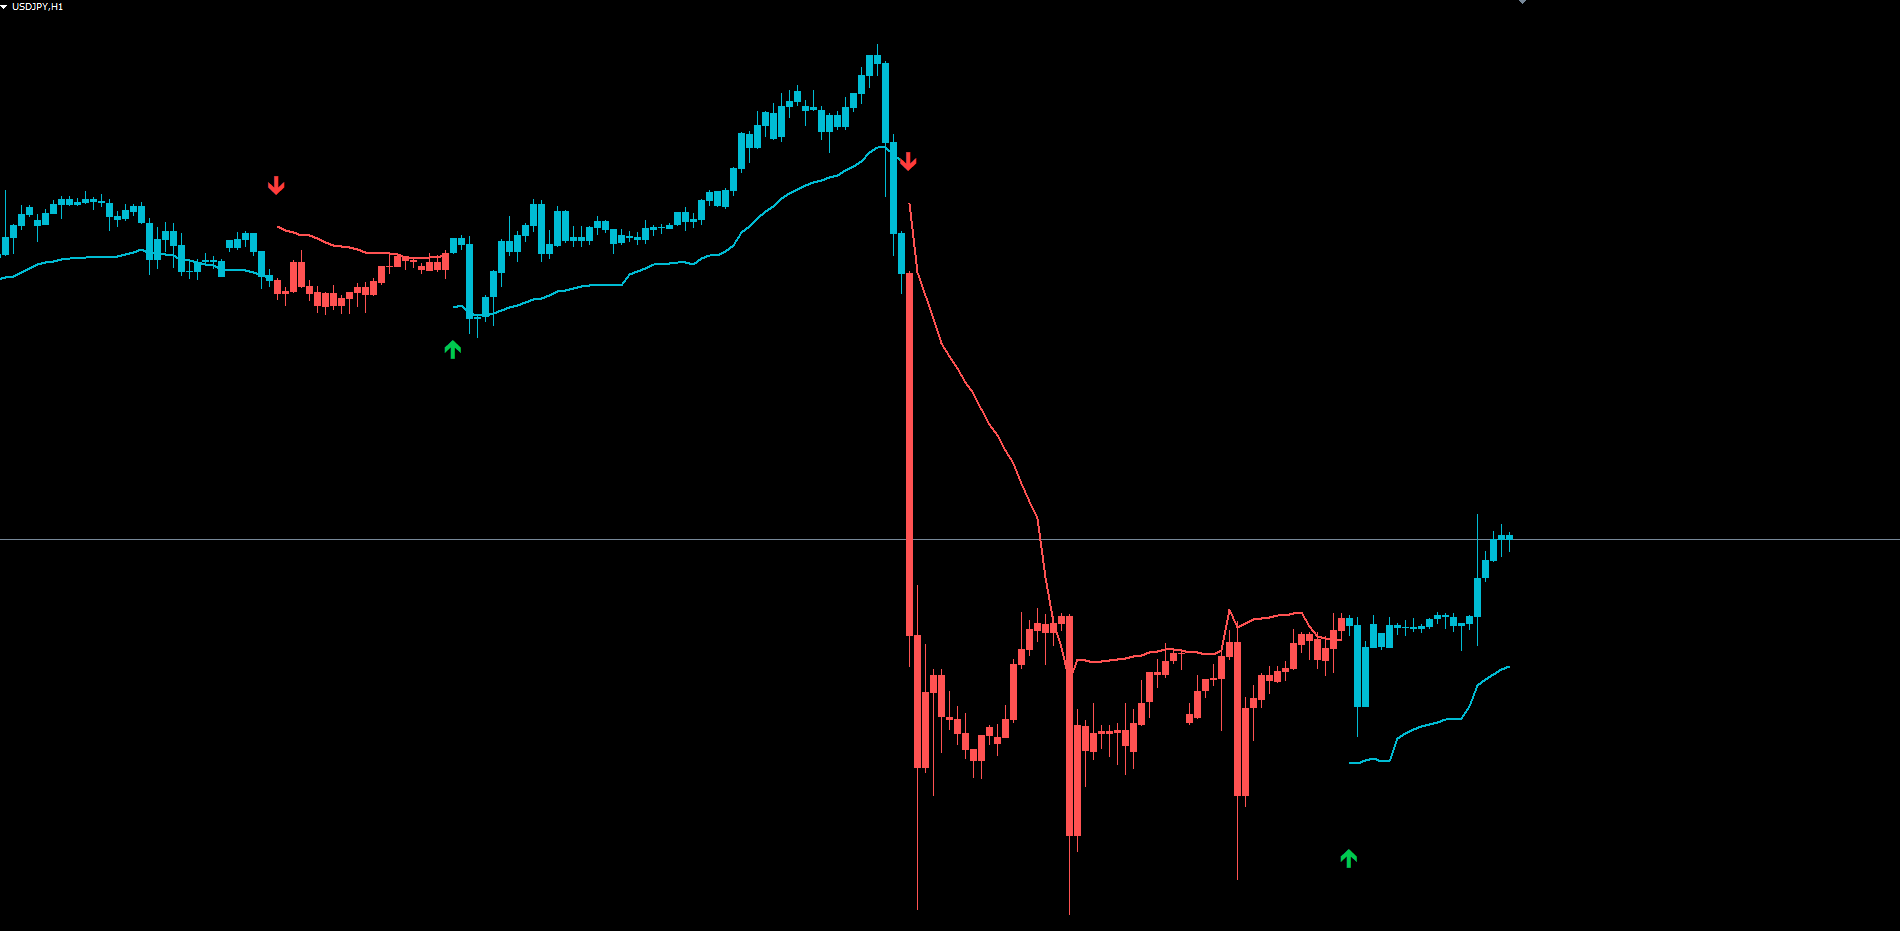
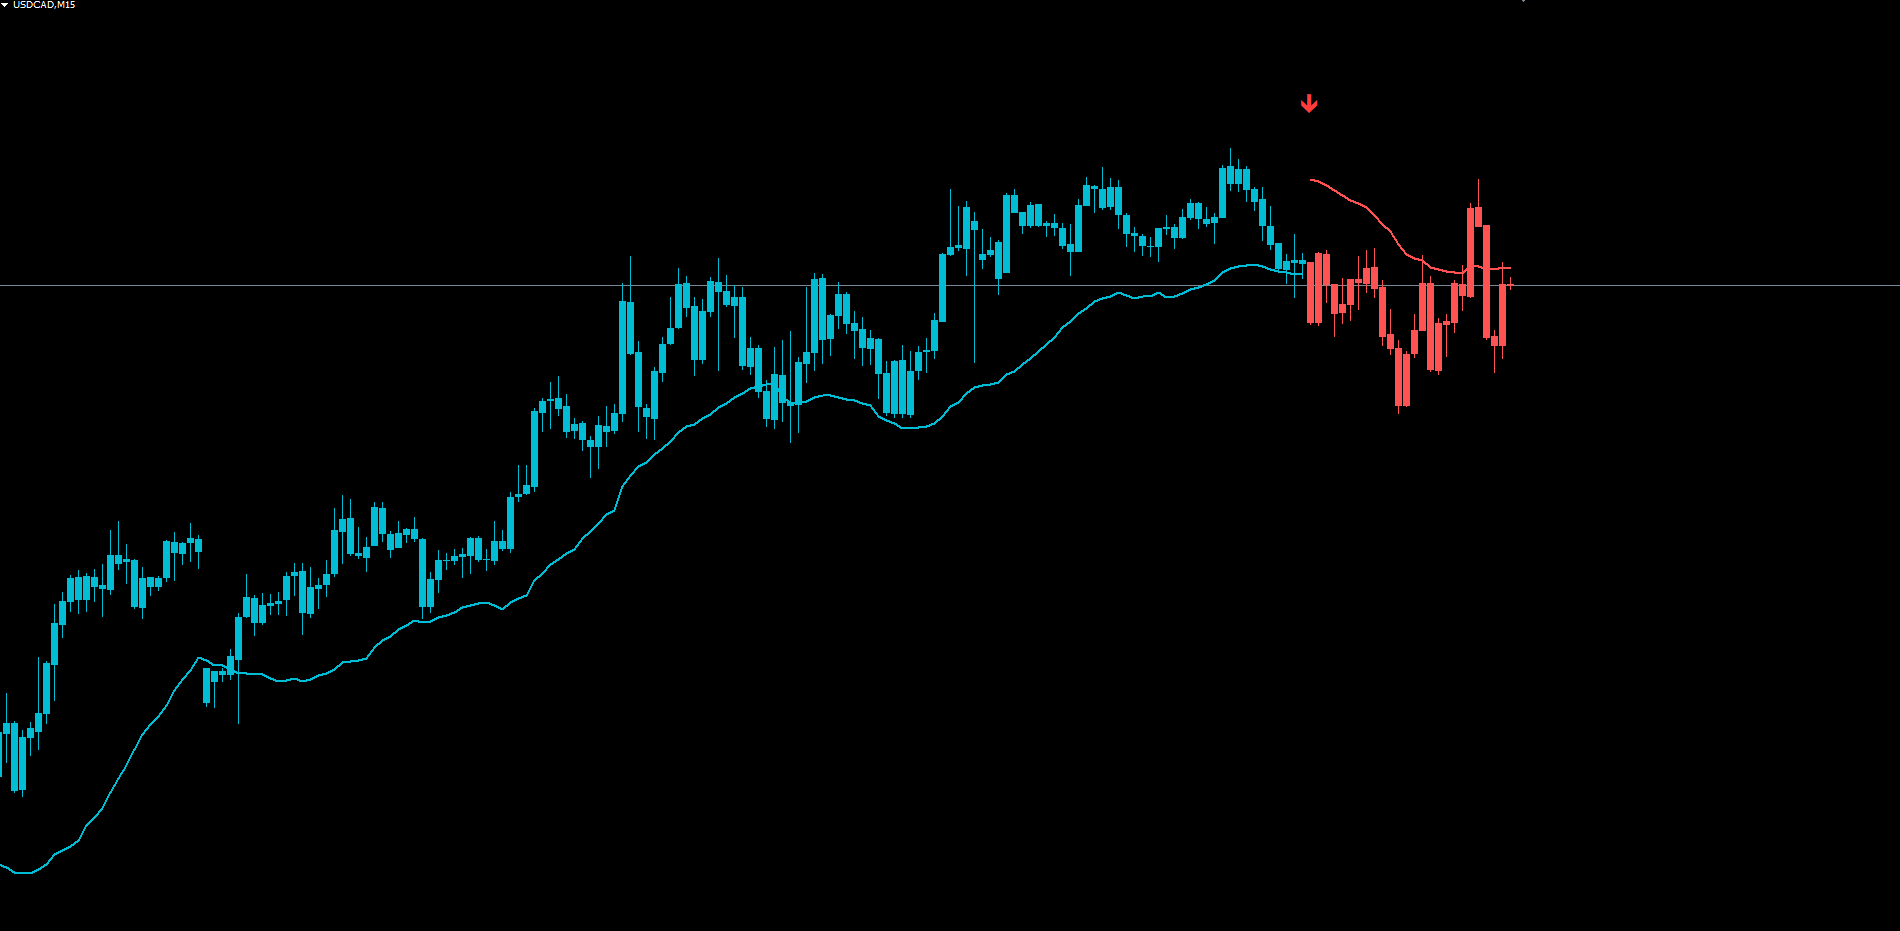
The result is a single colored anchor line that follows the dominant trend, sitting below price during bullish phases or above during bearish phases. Candles are recolored to match the state. BUY and SELL arrows appear at every confirmed state transition. The engine is non-repainting — historical signals are calculated on closed bars and never move once drawn.
This article walks through the concepts behind the indicator, explains each computational layer, and provides a complete parameter reference.
The Core Idea: RMI-Driven Trend Anchor
A trend anchor is a single line drawn on the chart that represents where the current trend is "rooted." When the trend is bullish, the anchor sits below price, acting as a dynamic support level. When the trend is bearish, the anchor sits above price, acting as a dynamic resistance level. Unlike a moving average that crosses through price during transitions, an anchor line is offset from price by a calculated band so that it never sits on top of the candles.
Flow Anchor Indicator computes the anchor in three stages. First, it determines the current trend state using a momentum indicator. Second, it calculates a range-weighted moving average (RWMA) that emphasizes high-range bars and de-emphasizes consolidation bars. Third, it offsets the RWMA by a volatility-adaptive band so that the anchor line remains visually separated from price.
The trend state is determined by the Relative Momentum Index, which is the average of the standard 14-period Relative Strength Index calculated on closing prices and the 14-period Money Flow Index calculated on the typical price (the average of high, low, and close). When the RMI crosses above 66 and a short-term EMA is rising, the trend state flips to positive. When the RMI falls below 30 and the same short-term EMA is falling, the state flips to negative. Once latched, the state persists until the opposite condition fires, providing immunity to brief intra-bar fluctuations.
This latched approach matters because trends, by definition, persist. A momentum dip during a confirmed uptrend should not flip the indicator to bearish — it should simply leave the bullish state in place until a clear bearish trigger occurs. Flow Anchor's state machine implements this rule explicitly.
Why a Hybrid Momentum Index
The Relative Strength Index measures the velocity of price change. It compares the average size of recent up-bars to the average size of recent down-bars. This is a clean measure of price-only momentum.
The Money Flow Index introduces a different dimension: volume. It compares the total dollar volume of recent up-bars to the dollar volume of down-bars. Where the RSI sees only that price moved up, the MFI also sees how much volume confirmed that move. A small upward price change on heavy volume produces a strong MFI reading; a large upward price change on weak volume produces a muted MFI reading.
Averaging the two produces a hybrid that responds to both price and participation. A market that rallies on strong volume registers high readings on both inputs, and the average exceeds 66 quickly. A market that drifts upward on thin volume registers a high RSI but a moderate MFI, and the average barely crosses the threshold. Strong-participation rallies produce high-confidence positive states; drift-up moves produce weak or absent state changes.
The 66 and 30 thresholds are intentionally asymmetric relative to the conventional 70 and 30 RSI levels. The 66 trigger is slightly more sensitive on the bullish side, reflecting that uptrends often build slowly while downtrends accelerate. These defaults can be adjusted for traders who prefer stricter or looser triggers.
The Trend State Latch
The state machine that controls the trend is straightforward. Two boolean flags — positive and negative — represent the current trend. At any given moment, one of them is true and the other is false (or both are false during the warmup period before any signal has fired).
The flag flips to positive when three conditions align simultaneously. First, the RMI on the previous bar was below 66. Second, the RMI on the current bar is above 66. Third, the 5-period EMA of close has risen since the previous bar. The first two conditions ensure that the trigger fires on a true cross-up, not on a continuation reading where the RMI was already above 66. The third condition adds a price-velocity confirmation: the underlying market must actually be moving up, not just registering a momentum spike on otherwise flat price.
The flag flips to negative when the RMI is below 30 and the 5-period EMA of close has fallen since the previous bar. The negative trigger is intentionally simpler than the positive trigger because downside reversals tend to be sharper and require less filtering. A market that drops the RMI below 30 with declining price velocity is in the early stages of a downtrend.
Once a flip occurs, the state persists until the opposite trigger fires. A market in the positive state will remain positive even if the RMI temporarily dips below 66 — only an explicit negative trigger can flip it. This persistence is crucial: it means the colored candles, anchor line, and signal labels remain consistent throughout a trend, rather than flickering on every minor RMI oscillation.
This latched behavior also means the indicator does not generate countless intra-trend signals. A trader receives one BUY arrow at the start of a bullish phase, the candles turn cyan, the anchor line tracks below price, and that visual configuration remains stable until a SELL arrow appears at the next state transition. The signal density is low by design — typically a few signals per chart per week on the 1-hour timeframe — which favors swing traders and trend-followers over scalpers.
The Range-Weighted Moving Average
A standard moving average treats every bar in its lookback window equally. A 20-period SMA is just the arithmetic mean of the last 20 closes. This works in steady markets but produces a sluggish response in volatile or directional ones. A 5-bar pullback that erases weeks of grind moves a 20-period SMA only marginally, even though the pullback is more informative about current structure than the preceding consolidation.
The range-weighted moving average used in Flow Anchor scales each bar's weight by its true range. A bar with a high range contributes more to the average than a bar with a low range. Within a 20-bar window, a single high-range breakout bar can shift the RWMA significantly more than several consecutive low-range consolidation bars.
The mathematics are simple. Each bar's weight equals its range (high minus low) divided by the sum of ranges over the last 20 bars. The weighted average is the sum of (close × weight) over those 20 bars, divided by the sum of weights. The result emphasizes bars where the market was actually moving and de-emphasizes bars where it was waiting.
The practical consequence is a moving average that tracks the dominant trend more responsively than a simple average without the high-frequency noise of an EMA. During tight consolidations the RWMA flattens dramatically; during breakouts it pivots sharply toward the new direction. This responsiveness is what makes the RWMA suitable as the trend-anchor base — close enough to current structure to remain meaningful, far enough from immediate noise to function as a stable reference.
The Adaptive Flow Band
The RWMA on its own would still cross through price during transitions, just like any moving average. To prevent this, Flow Anchor offsets the RWMA by a band that scales with current volatility. The anchor line itself is the RWMA minus the band during bullish phases and the RWMA plus the band during bearish phases. This offset ensures the anchor line is always visibly separated from price.
The band is calculated using the smaller of two values: 30 percent of the current 30-period ATR, or 0.3 percent of the current close price. The minimum function caps the band size during volatile periods (where ATR alone would produce excessive offsets) while the close-based component caps it during low-volatility periods (where ATR alone would produce insufficient offsets). The result is a band that adapts smoothly to changing market conditions without exploding during volatility spikes.
The chosen value is then shifted backward by 20 bars and multiplied by 4. The 20-bar shift means the band reflects volatility from one full cycle ago — typically a few hours back on a 1-hour chart — which prevents the band from reacting to the same bars that triggered the trend state change. The multiplication by 4 produces a band size that is visually distinct on the chart: large enough to clearly separate the anchor line from price, small enough that it does not dominate the chart visually.
During bullish phases, the anchor line sits exactly Band points below the RWMA. During bearish phases, it sits exactly Band points above. As price advances during the trend, the RWMA itself climbs (in bull) or descends (in bear), and the anchor line tracks along with it, maintaining its offset. The visual effect is a smooth, trailing reference line that stays out of price action while still moving in step with the dominant trend.
For traders, the anchor line serves several purposes. It acts as a dynamic support or resistance level. It can be used as a stop-loss reference — a violation of the anchor line is one valid signal to exit a trend trade. It also provides a quick visual confirmation of which direction the indicator considers dominant: if the line is cyan and below price, the trend is bullish; if it is red and above price, the trend is bearish.
Non-Repainting Architecture
Repainting indicators are one of the most insidious problems in retail trading. An indicator that evaluates conditions on the current, still-forming bar can show a signal that vanishes when the bar closes at a different price. During the bar's life, price may briefly satisfy the trigger conditions, causing a buy arrow to appear. If price then pulls back before the bar closes, the arrow disappears, and historical chart screenshots show a perfect signal that never actually existed in real time.
Flow Anchor Indicator is non-repainting by construction. State transitions are evaluated on closed bars only. The state of any bar more than zero shifts back from the current bar is locked once that bar has closed. The colored candles, anchor line, and signal arrows on those bars are calculated once and never modified.
The current bar (shift 0) does update on each tick, because the RMI, EMA, and RWMA values for the current bar are still being formed. This is unavoidable in any tick-by-tick indicator and matches the standard behavior of every Pine Script and MetaTrader indicator that includes the current bar in its calculation. However, the indicator's BUY and SELL alert system fires only on bars that have already closed (shift 1 in the indicator's processing order), with each alert protected by a per-bar deduplication guard that records the bar timestamp on which an alert fired and refuses to fire the same alert twice on the same bar.
This means that traders receive alerts only at confirmed state transitions on closed bars. If the RMI briefly crosses 66 mid-bar and then pulls back below before the bar closes, no alert fires. If the cross holds through bar close, an alert fires once and never again for that transition.
The arrows drawn on the chart match the alert behavior. An arrow appears at a state transition and remains on the chart from that moment forward. It is never removed. Traders looking at historical signals can be confident that what they see is what would have appeared in real time. Backtests and forward-tests produce equivalent results.
Colored Candles for State Visibility
In addition to the anchor line, Flow Anchor recolors the chart candles to reflect the current trend state. During positive (bullish) phases, candles are drawn in cyan. During negative (bearish) phases, candles are drawn in red. Candles before any state has been established (during the initial warmup period) retain their original chart colors.
This recoloring serves two purposes. First, it provides at-a-glance trend confirmation that does not require the trader to locate the most recent arrow or check the dashboard. A trader scanning multiple charts can immediately identify which symbols are in bullish phases and which are in bearish phases simply by candle color. Second, it provides a continuous visual record of the trend's persistence. A long stretch of cyan candles indicates a sustained bullish phase; a transition to red marks the moment the state flipped, with the SELL arrow appearing on that bar.
The MT5 implementation uses DRAW_COLOR_CANDLES, a single plot type that draws standard OHLC candles with a color index buffer determining the color of each candle. The MT4 implementation uses the equivalent four-buffer paired DRAW_HISTOGRAM technique (high, low, open, close) because MT4 lacks a native colored-candle plot type. Both produce visually identical output.
Traders who prefer the standard chart colors can hide Flow Anchor's candle layer entirely by removing the indicator from the chart or by setting its visibility through the standard MetaTrader indicator properties dialog. The anchor line and arrows remain functional independently.
BUY and SELL Signal Logic
A BUY signal fires when the trend state transitions from any prior state (negative or neutral) to positive. A SELL signal fires when the state transitions to negative. Within a single state, no additional signals fire — the indicator deliberately does not generate continuation alerts because the latched state machine treats the entire bullish or bearish phase as a single trade.
When a BUY signal fires, an upward green arrow appears below the bar at a position calculated from the anchor line and band: specifically, at the anchor minus 1.5 times the band. This places the arrow visibly below the bullish anchor line, in the lower portion of the chart's price range, where it does not collide with the candles. When a SELL signal fires, a downward red arrow appears above the bar at the anchor plus 1.5 times the band, in the upper portion of the chart's range.
The arrow positions adjust automatically with band size. On a high-volatility instrument with a wide band, arrows are placed further from price. On a low-volatility instrument with a narrow band, they are placed closer. This ensures the arrows are visually proportional regardless of the symbol or timeframe.
In addition to the chart arrow, each signal triggers an alert through up to four configurable channels:
- Popup dialog (on-screen MetaTrader notification)
- Sound (default alert.wav for BUY, alert2.wav for SELL — both customizable)
- Email (requires SMTP configuration in MetaTrader)
- Push notification (requires MetaQuotes ID configuration in MetaTrader and the MetaTrader mobile app)
Each alert message includes the signal direction, symbol, timeframe, and current bid price at the time of firing. This information is sufficient for traders monitoring multiple instruments to identify which signal fired and on which chart.
The BUY and SELL alert toggles are independent. A trader who only wants to be notified of new bullish entries can disable the SELL alert toggle without affecting the BUY behavior. Similarly, the four delivery channels are independent — popup and sound can be enabled while email and push are disabled, or any other combination.
Practical Trading Workflow
A consistent workflow turns a tool into a system. The following five-step approach describes how to use Flow Anchor Indicator for swing trading on the 1-hour and 4-hour timeframes.
Step 1: Apply the indicator. Open any chart in MetaTrader 4 or MetaTrader 5. Find Flow Anchor Indicator in the Navigator under Indicators > Market. Drag it onto the chart. The default parameters work for most Forex majors and major indices on the H1 and H4 timeframes. For instruments with unusual volatility profiles (exotic Forex pairs, low-volume crypto pairs, certain stocks), consider adjusting the RMI Length input — increasing it produces fewer but stronger signals, while decreasing it produces more frequent signals.
Step 2: Wait for a state transition. Once applied, the indicator immediately renders historical state transitions on the visible portion of the chart, so a trader can see at a glance the most recent BUY or SELL arrow and the colored candles since that transition. Live trading begins when the next state transition occurs. Do not enter trades within an existing state — the indicator's design intends for one entry per bullish or bearish phase, taken at the arrow.
Step 3: Confirm direction with the anchor line. When a BUY arrow fires, the anchor line should sit below price in cyan. When a SELL arrow fires, the anchor line should sit above price in red. If the anchor line position contradicts the arrow (which can happen briefly during the bar that contains the transition, as the line is recalculated), wait for the next bar to close before entering. This adds a small confirmation delay but eliminates false starts.
Step 4: Manage the trade with the anchor line as a reference. The anchor line serves as a dynamic stop-loss reference for trend-followers. A common approach is to enter at the arrow's bar and place a stop-loss at the anchor line on entry, then trail the stop along the anchor as the trend develops. The band's adaptive sizing means the stop trails more tightly during low-volatility periods and more loosely during high-volatility periods, automatically adjusting to current market conditions without manual intervention.
Step 5: Exit on the opposite signal. The simplest exit rule is to close the trade when the opposite-direction arrow fires. A BUY trade closes when the next SELL arrow appears, and vice versa. This produces a continuous always-in-market strategy that aligns with the indicator's latched state design. For traders who prefer to take profits at predefined levels, the anchor line and band can be used to derive take-profit targets — for example, 2 or 3 times the band size from entry — though Flow Anchor does not draw these targets automatically.
Timeframe Considerations
The indicator works on all timeframes but produces different signal characteristics depending on the timeframe selected.
On lower timeframes (M5, M15), state transitions happen more frequently because the RMI oscillates more often and the EMA changes direction faster. Signals are best suited for intraday scalping. The anchor line responds quickly to short-term momentum shifts, which is useful for tight stop-management but increases the rate of premature reversals.
On medium timeframes (M30, H1, H4), the indicator produces well-spaced signals that align with multi-day market structure. Each bullish or bearish phase typically lasts several days to a few weeks. This is the sweet spot for swing traders and the recommended starting point for new users.
On higher timeframes (D1, W1), state transitions are rare but each one tends to mark a significant structural shift. Position traders can use the daily timeframe to confirm long-term direction and the 4-hour timeframe to time individual entries within that direction.
Multi-Symbol Setup
Because the indicator runs independently on each chart, traders can apply it to a watchlist of 10 or more instruments and use push notifications to receive alerts when any of them generates a signal. A practical setup is to apply Flow Anchor to the H1 chart of each major Forex pair, enable AlertPush, and let MetaTrader run in the background. When a notification arrives, open the relevant chart, confirm the state transition is consistent with the broader market context, and decide whether to take the trade.
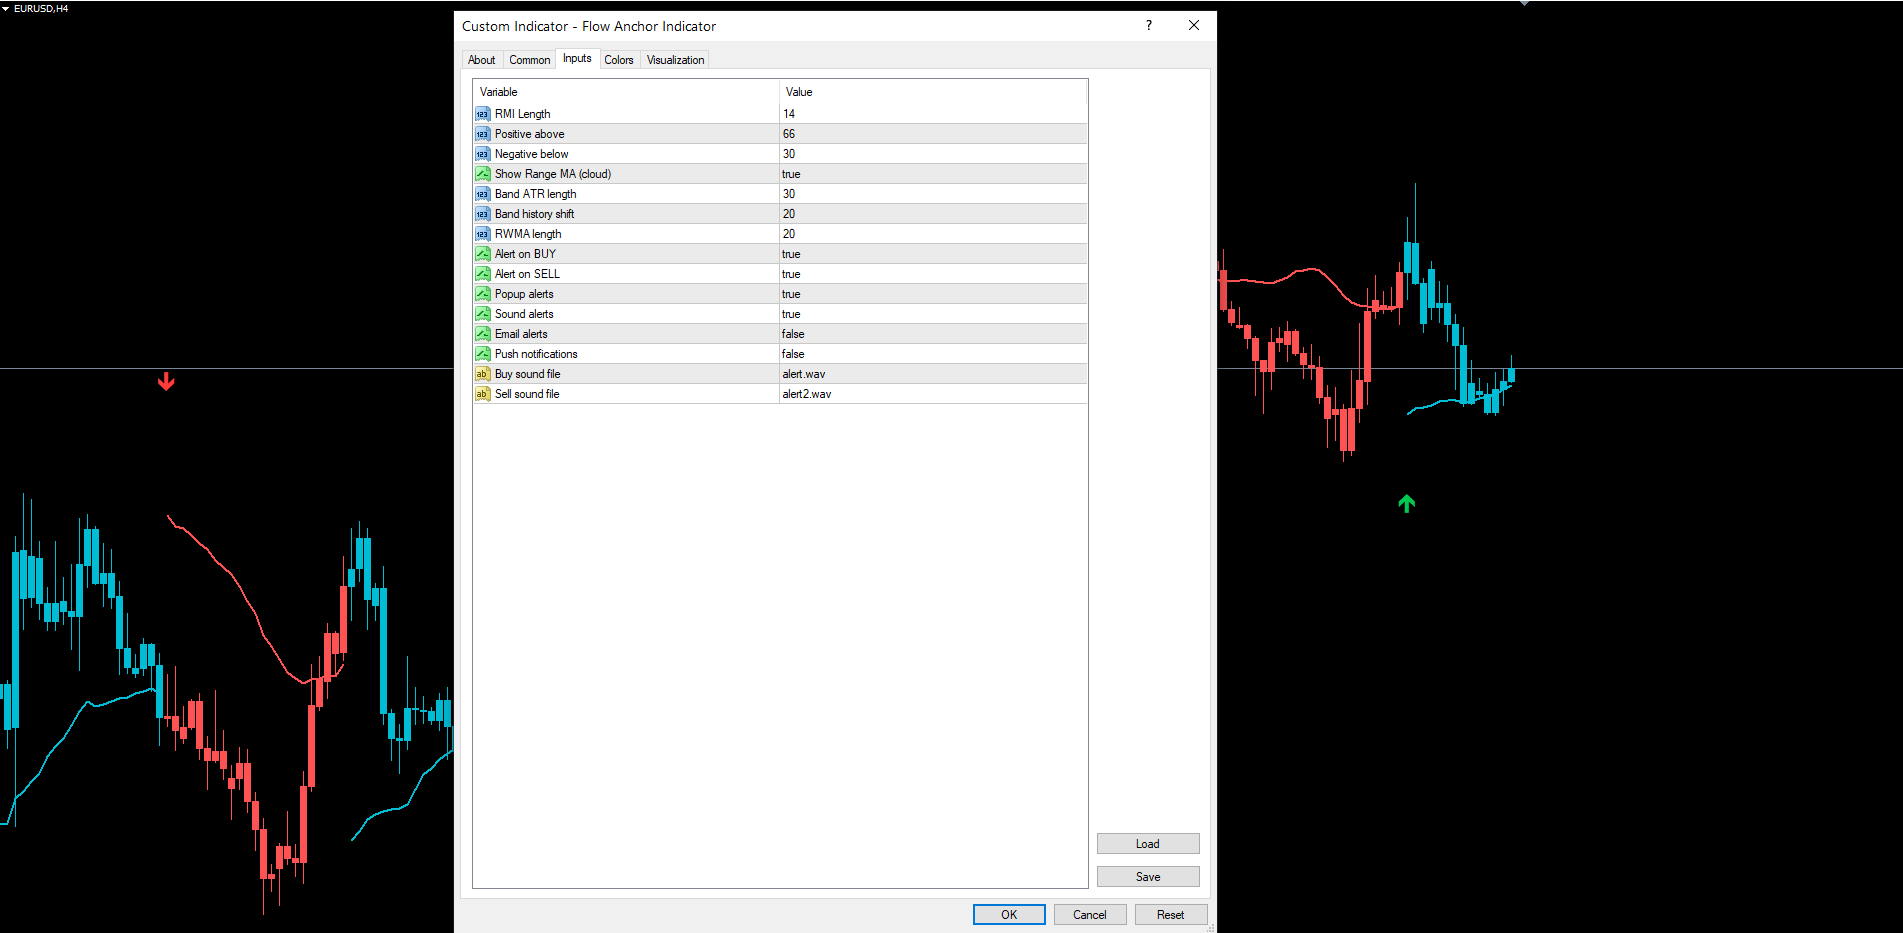
Parameter Reference
All input parameters are listed below with their default values. Defaults are set conservatively to produce reliable signals on H1 and H4 Forex majors without further tuning.
Calculation Parameters
| Parameter | Default | Description |
|---|---|---|
| InpLength | 14 | RMI length (RSI and MFI both use this) |
| InpPositiveAbove | 66 | RMI threshold above which the bullish trigger fires |
| InpNegativeBelow | 30 | RMI threshold below which the bearish trigger fires |
| InpBandLen | 30 | ATR period used in the band calculation |
| InpBandShift | 20 | Number of bars to shift the band source backward |
| InpRwmaLen | 20 | Period for the range-weighted moving average |
Display Parameters
| Parameter | Default | Description |
|---|---|---|
| InpShowAnchor | true | Show the colored anchor line on the chart |
Alert Parameters
| Parameter | Default | Description |
|---|---|---|
| InpAlertBuy | true | Enable BUY signal alerts |
| InpAlertSell | true | Enable SELL signal alerts |
| InpAlertPopup | true | Show on-screen popup dialog |
| InpAlertSound | true | Play sound file on alert |
| InpAlertEmail | false | Send email alert |
| InpAlertPush | false | Send mobile push notification |
| InpSoundBuy | "alert.wav" | Sound file for BUY alerts |
| InpSoundSell | "alert2.wav" | Sound file for SELL alerts |
Recommended Configuration Profiles
Conservative (fewer, stronger signals). Increase InpLength to 20 and tighten the thresholds: InpPositiveAbove = 70, InpNegativeBelow = 25. This requires stronger momentum readings before flipping the state and produces fewer, higher-confidence signals. Best for traders who want to trade only major structural shifts.
Default (balanced). Use all default values. Suitable for most Forex pairs, major indices, and gold on the 1-hour and 4-hour timeframes.
Aggressive (more signals, faster response). Decrease InpLength to 10 and loosen the thresholds: InpPositiveAbove = 60, InpNegativeBelow = 35. This produces more frequent state transitions and is suited to lower-timeframe scalping or volatile instruments where slow signals miss too many opportunities.
Installation
Flow Anchor Indicator is distributed through the MQL5.com Market and installs automatically after purchase.
- Purchase the indicator from the MQL5.com Market product page.
- The indicator downloads and installs automatically into MetaTrader.
- Open the Navigator panel (Ctrl+N) and expand the Indicators section.
- Find Flow Anchor Indicator under Indicators > Market.
- Drag the indicator onto any chart.
- Adjust input parameters if needed, then click OK.
The indicator works on all timeframes and all instruments supported by your broker. No manual file copying is required.
For best results, allow the indicator a few moments to load its historical state calculation the first time it is applied to a chart. The warmup period is approximately 60 bars (the maximum of the RMI length plus a small buffer, the ATR length plus the band shift, and the RWMA length plus a small buffer).
Ensure the chart has sufficient historical data. The indicator requires at least 100 bars to produce reliable initial state. If your chart shows fewer bars, scroll back or increase the Max Bars in Chart setting in MetaTrader's Options menu.
Conclusion
Flow Anchor Indicator combines three independent ideas into a single chart layer. The Relative Momentum Index — the average of standard RSI and Money Flow Index — provides a hybrid momentum measure that responds to both price velocity and volume participation. The range-weighted moving average emphasizes high-range bars to produce a moving average that tracks dominant trends without lagging excessively. The adaptive flow band, derived from a capped function of ATR and close, offsets the RWMA so that the resulting anchor line stays visually separated from price.
The state machine that drives the indicator is intentionally simple: positive when RMI crosses up through 66 with a rising short EMA, negative when RMI falls below 30 with a falling short EMA, latched until the opposite trigger fires. This simplicity is what produces the indicator's stable visual output. Colored candles, anchor line, and signal arrows all reflect the same underlying state, and that state changes only at clearly defined transitions.
The non-repainting architecture means traders can trust historical signals as accurate representations of what would have appeared in real time. The four-channel alert system covers desktop, mobile, and email delivery for both BUY and SELL signals. The inputs are minimal — six calculation parameters and one display toggle — making the indicator easy to learn and tune.
The indicator is designed for swing traders and trend-followers who want a clean, visually distinct trend layer that stays out of the way of price action while still providing actionable BUY and SELL triggers at every confirmed state transition. It performs well on Forex majors, gold, silver, major indices, and large-cap crypto pairs on the 30-minute, 1-hour, and 4-hour timeframes.
Download the indicator:
- MetaTrader 5: Flow Anchor MT5
- MetaTrader 4: Flow Anchor MT4
CONTACT & SUPPORT
- Email: info@forexobroker.com
- Questions: Use the Comments section on the product page or send a private message
- Bug Reports: Please include your broker name, account type, and a screenshot
-
✅ All MQL Tools: https://www.mql5.com/en/users/forexobroker/ ✅
--------------------------------------------------------------------------------------------------------------
🏦 **Broker I use**: https://icmarkets.com/?camp=55869
🏦 **Broker For EU Traders I use 1**: https://www.ictrading.com?camp=91414
🏦 **Broker I use 2**: https://one.exnessonelink.com/boarding/sign-up/a/c_thuv62ocfq
💻 **VPS**: https://chocoping.com/processing/aff.php?aff=738
💼 **Companies I use for getting funded**:
Fundednext: https://fundednext.com/?fpr=kestutis39
The5ers: https://www.the5ers.com/?afmc=16kl
FTMO: https://trader.ftmo.com/?affiliates=nRAyOhmFRnEnFdOpdLeh
Risk Disclaimer
Trading foreign exchange and CFDs on margin carries a high level of risk and may not be suitable for all investors. You may sustain a loss exceeding your initial investment. Trend Quorum is a technical analysis tool and does not guarantee profitable trades. Past performance is not indicative of future results. The authors accept no liability for any loss arising from use of the indicator. By using Trend Quorum you acknowledge sole responsibility for your trading decisions.


")
![[XAUUSD]: Weekly Liquidity Activation Points (timings), June 22-26, 2026](https://c.mql5.com/6/1013/splash-preview-771790.png "[XAUUSD]: Weekly Liquidity Activation Points (timings), June 22-26, 2026")
