")

Introduction
The Flow Anchor Indicator is a non-repainting trend engine for MetaTrader 4 and MetaTrader 5. It calculates a Relative Momentum Index (RMI) — the average of the standard RSI and Money Flow Index — and uses it to drive a latched trend state (positive or negative). When the state flips, the indicator draws a colored anchor line, recolors candles, and fires a BUY or SELL arrow on the chart along with optional alerts.
Key Features:
- Hybrid Momentum Index: Average of RSI(close, 14) and MFI(hlc3, 14) for confirmed trend triggers
- Range-Weighted Anchor: Bar-range-weighted moving average emphasizes high-volatility bars
- Adaptive Flow Band: ATR-derived offset that scales with current market volatility
- Latched Trend State: Positive or negative state persists until the opposite trigger fires
- Colored Candles: Cyan during bullish phases, red during bearish phases
- Non-Repainting Signals: State transitions on closed bars, alerts deduplicated per bar
- Four Alert Channels: Popup, sound, email, and push notification
Download the indicator:
- MetaTrader 5: Flow Anchor MT5
- MetaTrader 4: Flow Anchor MT4
TIP: This indicator is designed for swing traders and trend-followers who want a clean trend-state visualization with one entry per bullish or bearish phase. It works on any symbol and any timeframe in MetaTrader.
How Flow Anchor Works
The indicator runs a four-stage pipeline on each bar:
- RMI computation. RSI(close, Length) and MFI(hlc3, Length) are computed and averaged. Length defaults to 14.
- State machine. If RMI crossed up through 66 with the 5-period EMA of close rising, the state flips to positive. If RMI is below 30 with the 5-period EMA falling, the state flips to negative. Otherwise the state persists from the previous bar.
- Anchor calculation. A range-weighted moving average (RWMA) is computed over the last 20 bars. An adaptive band, derived from ATR(30) and close price, is calculated and shifted backward by 20 bars. The anchor line equals RWMA minus the band during positive state, RWMA plus the band during negative state.
- Visual output. The anchor line is drawn in cyan (positive) or red (negative). Candles are recolored to match. At every state transition, a directional arrow is drawn on the chart and an alert fires on the next confirmed bar close.
NOTE: Because the state machine reads RMI on the previous bar (shift+1) and uses an EMA-direction filter, signals require both a momentum cross and a price-velocity confirmation. This dual requirement reduces false positives on flat or choppy price action.
Installation Guide
Flow Anchor Indicator is distributed through the MQL5.com Market. Installation is automatic.
Steps:
- Purchase the indicator from the MQL5 Market product page
- The indicator installs automatically into your MetaTrader terminal
- Open MetaTrader and press Ctrl+N to open the Navigator panel
- Expand Indicators > Market
- Locate Flow Anchor Indicator in the list
- Drag the indicator onto any chart, or double-click its name
- The settings dialog appears -- adjust parameters as needed
- Click OK to apply
After loading, you will see:
- Anchor line drawn in cyan (bull) or red (bear), positioned below or above price
- Colored candles matching the trend state (cyan for bull, red for bear)
- Signal arrows (Wingdings 233 up arrow for BUY, 234 down arrow for SELL) at state transitions
- Alerts (when enabled) firing once per state-flip on confirmed bar close
IMPORTANT: Do not manually copy files to the data folder. The MQL5 Market handles all file placement and updates automatically.
Signal System Overview
A signal is a state transition. The indicator does not generate continuation signals — it fires once per bullish or bearish phase, at the bar where the state changes.
1. BUY Signal
- Fires when the trend state flips from negative (or neutral) to positive
- Visual: green upward arrow (Wingdings 233) drawn below the bar
- Position: 1.5 times the band size below the cyan anchor line
- Alert: BUY notification through enabled channels
2. SELL Signal
- Fires when the trend state flips to negative
- Visual: red downward arrow (Wingdings 234) drawn above the bar
- Position: 1.5 times the band size above the red anchor line
- Alert: SELL notification through enabled channels
State Persistence:
- Once positive, the state remains positive until the negative trigger fires (RMI < 30 AND EMA5 falling)
- Once negative, the state remains negative until the positive trigger fires (RMI cross-up of 66 AND EMA5 rising)
- The state machine is immune to brief intra-bar fluctuations because the RMI cross-up requires the previous bar to have been below 66
Non-Repainting Confirmation:
- State transitions on bars more than zero shifts back are locked once the bar closes
- Alerts fire only on closed bars (shift 1 in the indicator's processing order)
- A per-bar deduplication guard prevents multiple alerts on the same bar
- Historical arrows on the chart never move, change, or disappear
Indicator Inputs
These parameters control the calculation of RMI, the state machine triggers, and the anchor / band geometry.
Calculation Parameters
| Parameter | Default | Description |
|---|---|---|
| InpLength | 14 | RMI length used for both RSI and MFI components |
| InpPositiveAbove | 66 | RMI threshold above which the bullish trigger fires (must be > InpNegativeBelow) |
| InpNegativeBelow | 30 | RMI threshold below which the bearish trigger fires |
| InpBandLen | 30 | Period of the ATR used in band calculation |
| InpBandShift | 20 | Number of bars to shift the band source data backward |
| InpRwmaLen | 20 | Period for the range-weighted moving average |
Logic: The RMI is the average of RSI(close, InpLength) and MFI(hlc3, InpLength). When the RMI crosses up through InpPositiveAbove and the 5-period EMA of close has risen since the previous bar, the state flips to positive. When the RMI is below InpNegativeBelow and the 5-period EMA has fallen, the state flips to negative.
Tuning notes:
- Increasing InpLength produces fewer, stronger signals (slower RMI response). Decreasing it produces more frequent, faster signals.
- Tightening the thresholds (InpPositiveAbove = 70, InpNegativeBelow = 25) requires stronger momentum readings before flipping the state.
- Loosening the thresholds (InpPositiveAbove = 60, InpNegativeBelow = 35) produces more frequent transitions and is suited to lower-timeframe scalping.
Display Parameters
| Parameter | Default | Description |
|---|---|---|
| InpShowAnchor | true | Show the colored anchor line on the chart |
When InpShowAnchor is set to false, the anchor line is hidden but candle coloring and signal arrows continue to display normally. This is useful for traders who want a less cluttered chart view.
Alert Configuration
Flow Anchor supports four delivery channels and two signal events. Each channel is independently configurable.
Alert Channels
| Parameter | Default | Description |
|---|---|---|
| InpAlertBuy | true | Enable BUY signal alerts |
| InpAlertSell | true | Enable SELL signal alerts |
| InpAlertPopup | true | Show popup dialog in MetaTrader on signal |
| InpAlertSound | true | Play sound file on signal |
| InpAlertEmail | false | Send email notification on signal |
| InpAlertPush | false | Send push notification to MetaTrader mobile app |
| InpSoundBuy | "alert.wav" | Sound file played for BUY signals |
| InpSoundSell | "alert2.wav" | Sound file played for SELL signals |
Alert Events
The indicator fires alerts for two events, each guarded by a per-bar deduplication mechanism:
| Alert Event | Example Message | |||
|---|---|---|---|---|
| BUY Signal | `Flow Anchor BUY \ | EURUSD \ | H1 \ | Bid=1.08542` |
| SELL Signal | `Flow Anchor SELL \ | EURUSD \ | H1 \ | Bid=1.08542` |
Each alert fires only on the bar following the state transition (shift 1 in the indicator's processing order), ensuring the signal is locked in by bar close. The deduplication guard records the timestamp of the last bar on which an alert fired and refuses to fire the same alert again on the same bar, even if the indicator is re-initialized or the chart is refreshed.
Enabling Push Notifications
- Install the MetaTrader mobile app on your phone (iOS or Android)
- Open the app and navigate to Settings > Messages
- Copy your MetaQuotes ID
- In the desktop MetaTrader, go to Tools > Options > Notifications
- Enter your MetaQuotes ID and enable notifications
- Set InpAlertPush = true in the indicator settings
Enabling Email Notifications
- In MetaTrader, go to Tools > Options > Email
- Check Enable
- Enter your SMTP server, port, login, password, and destination email address
- Click Test to verify the configuration works
- Set InpAlertEmail = true in the indicator settings
TIP: If you trade multiple symbols, enable AlertPush so notifications appear on your phone, and disable AlertPopup to avoid filling MetaTrader with on-screen dialogs.
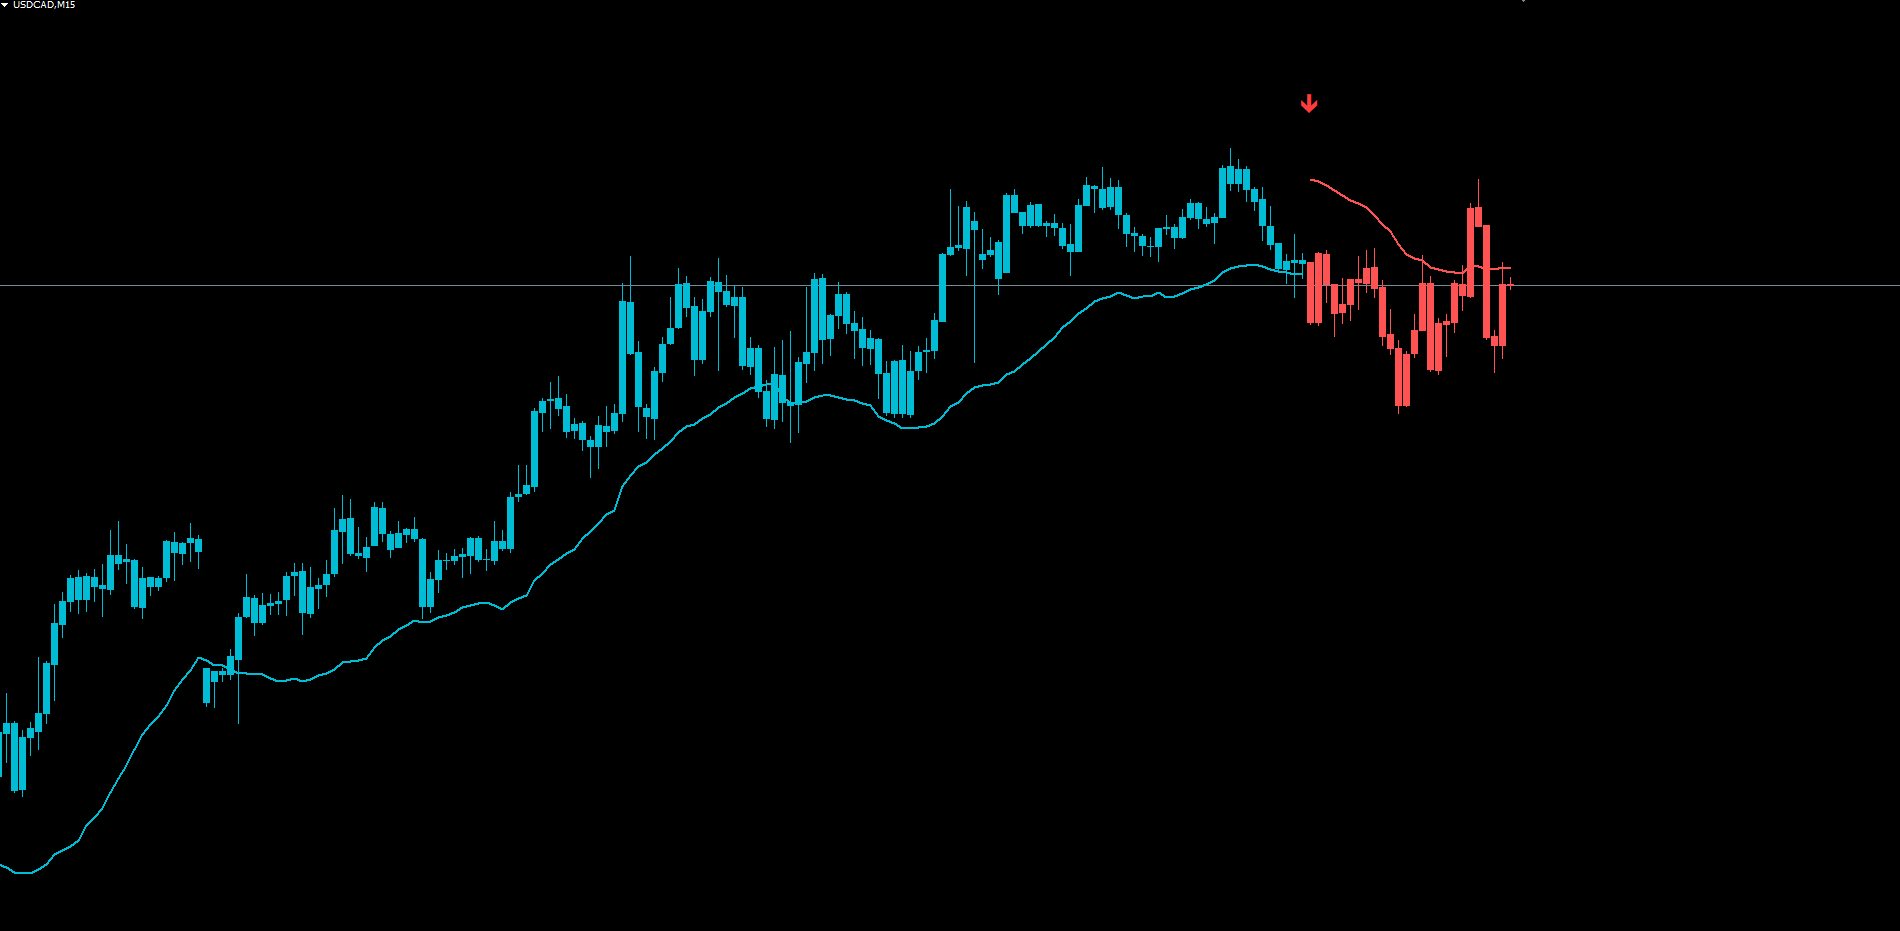
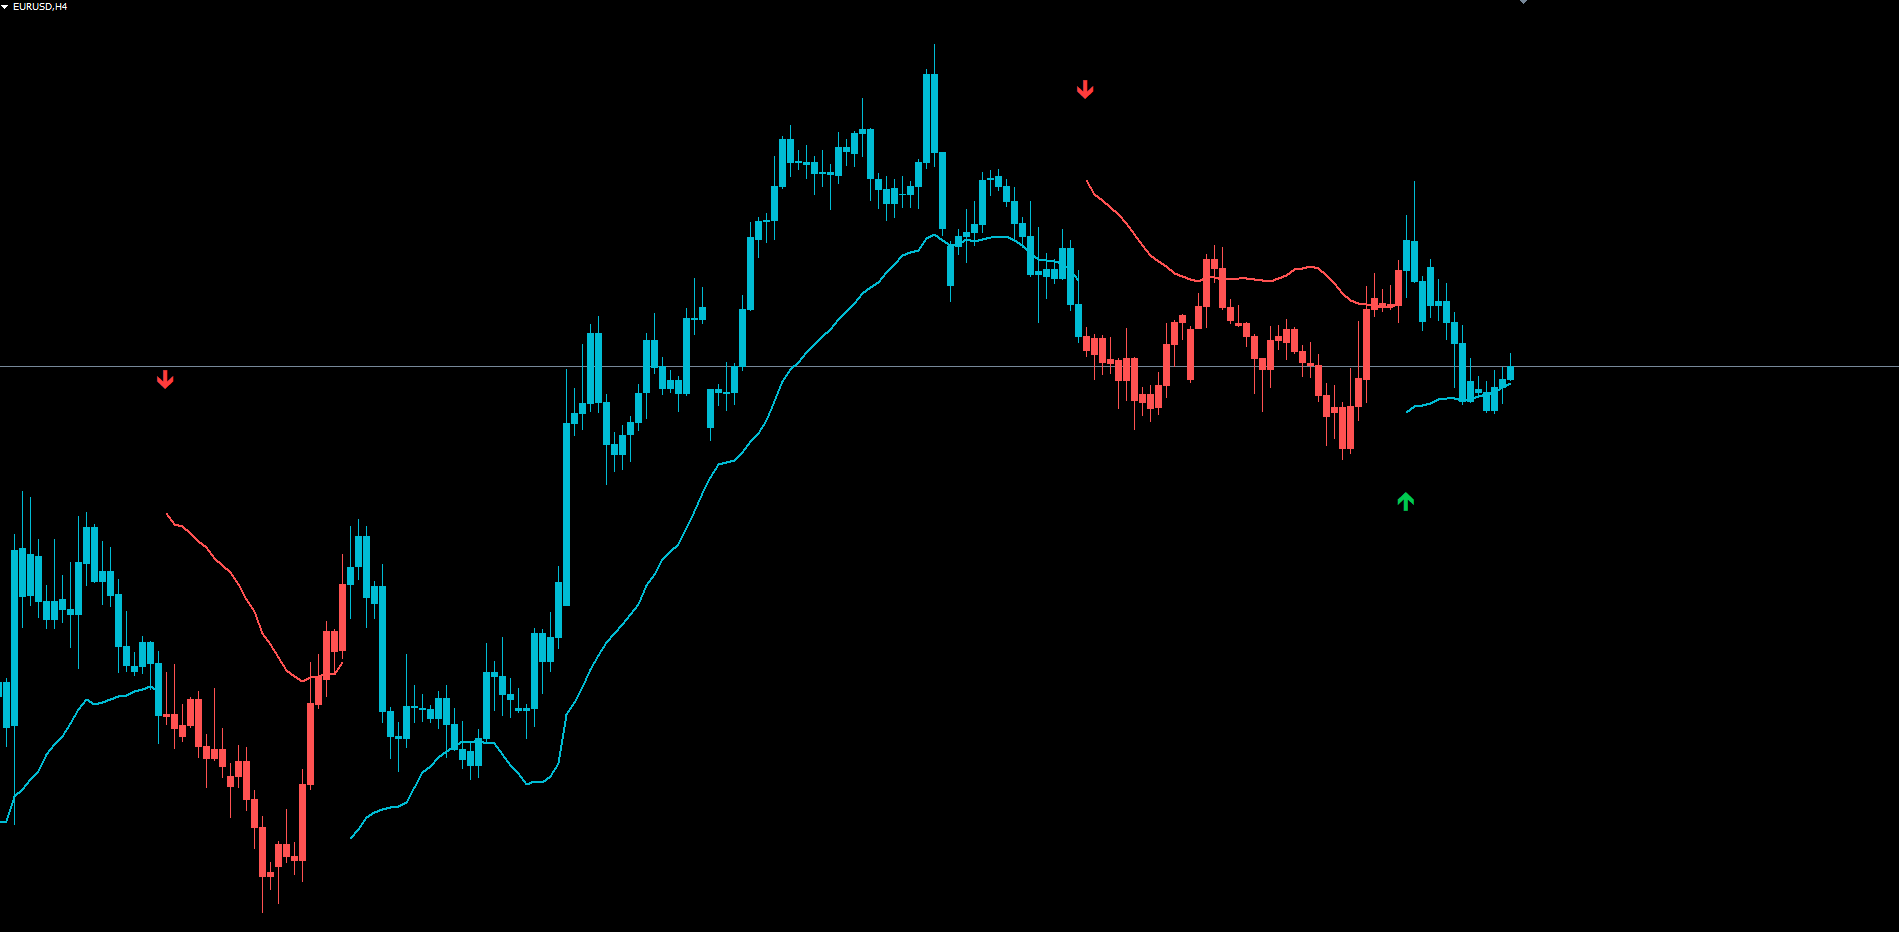
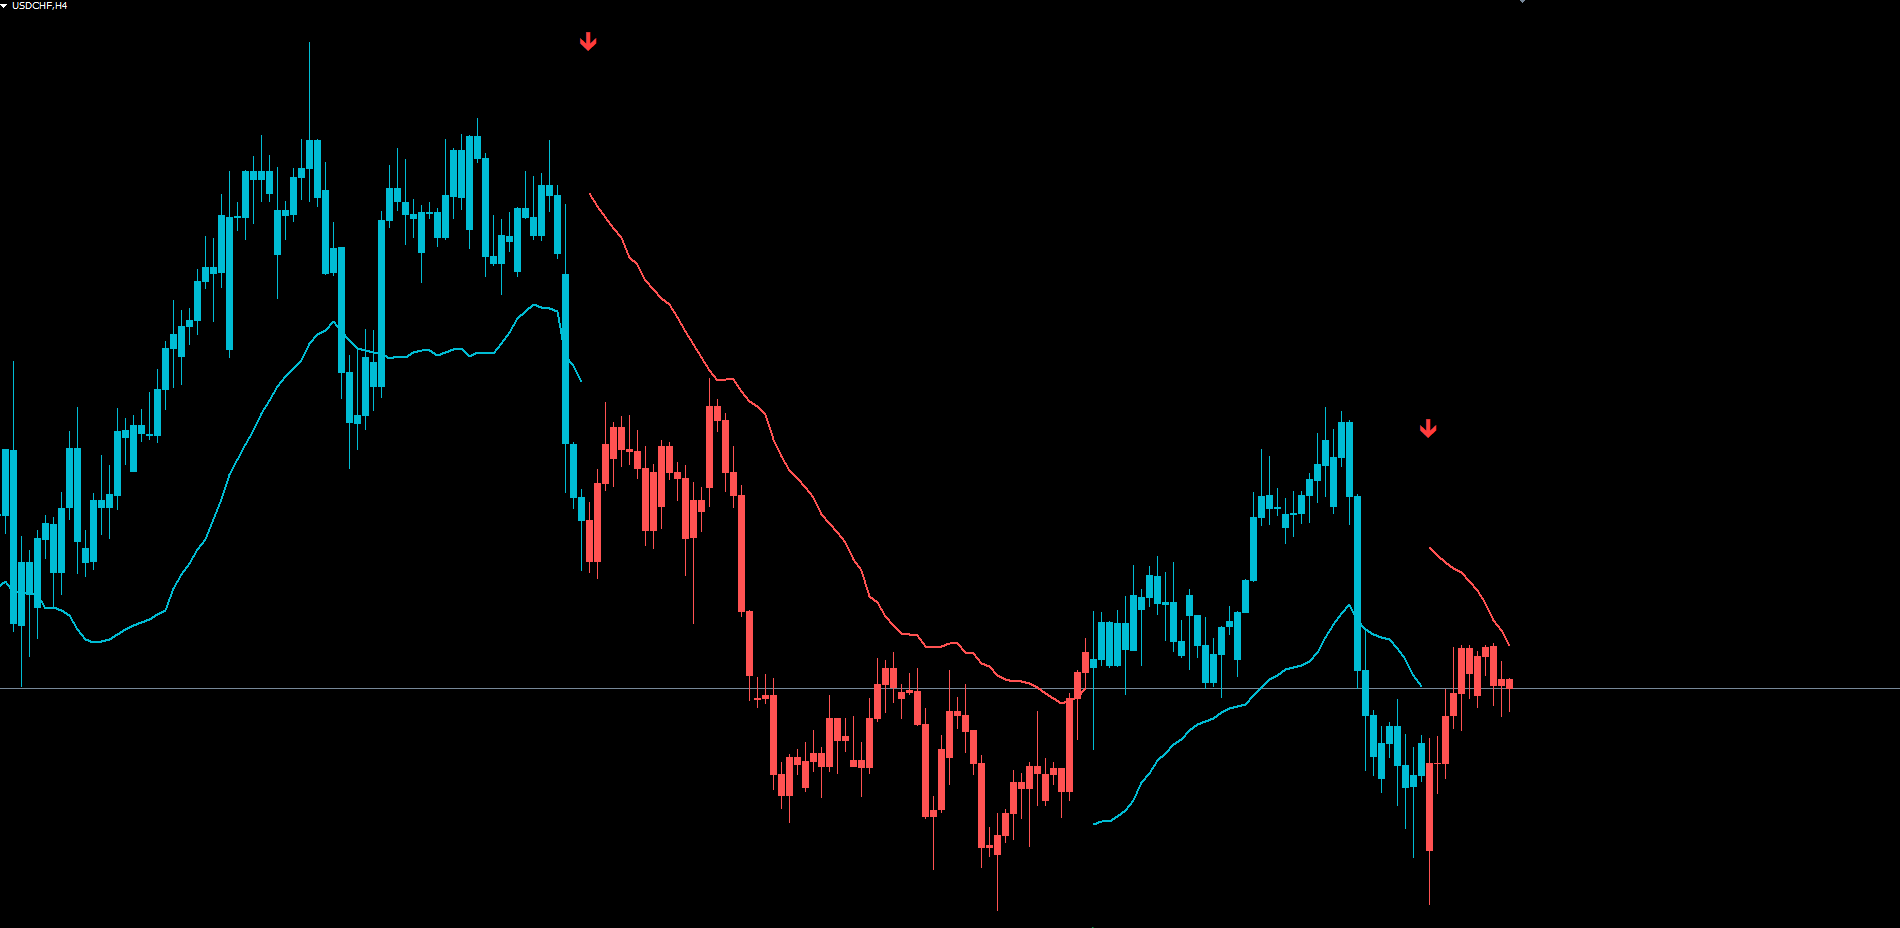
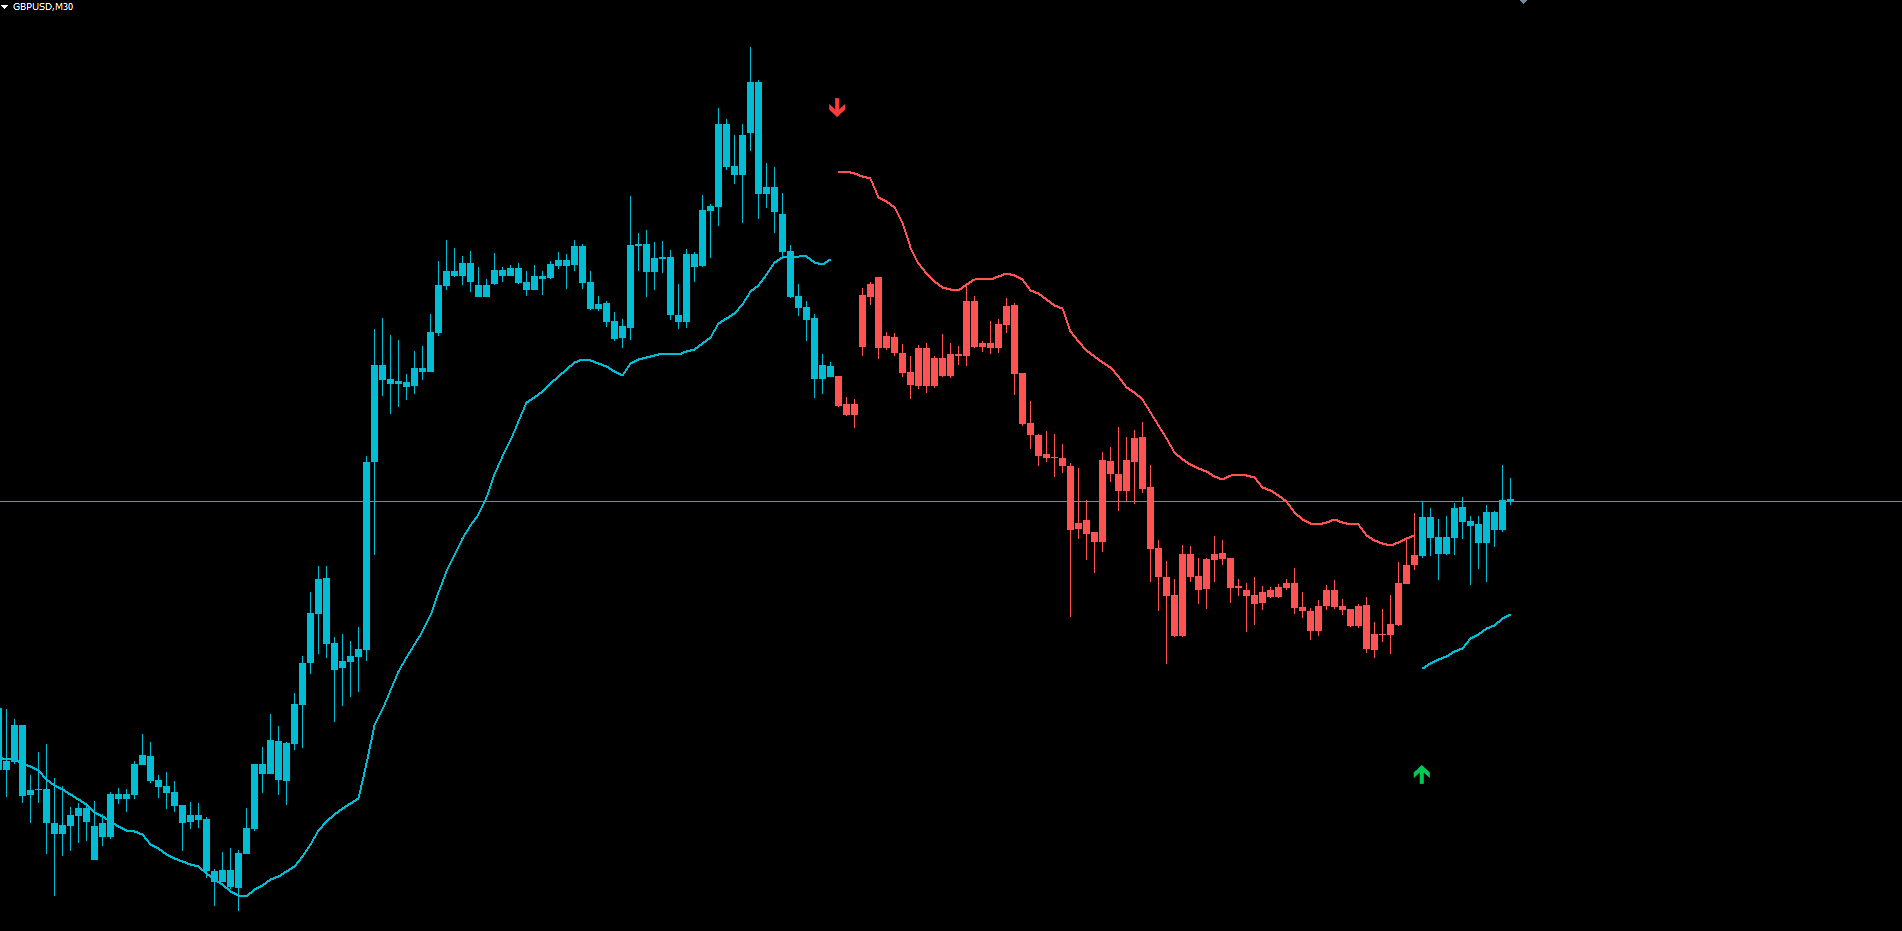
Reading the Chart
The indicator produces three on-chart layers, each visible at a glance.
The Anchor Line
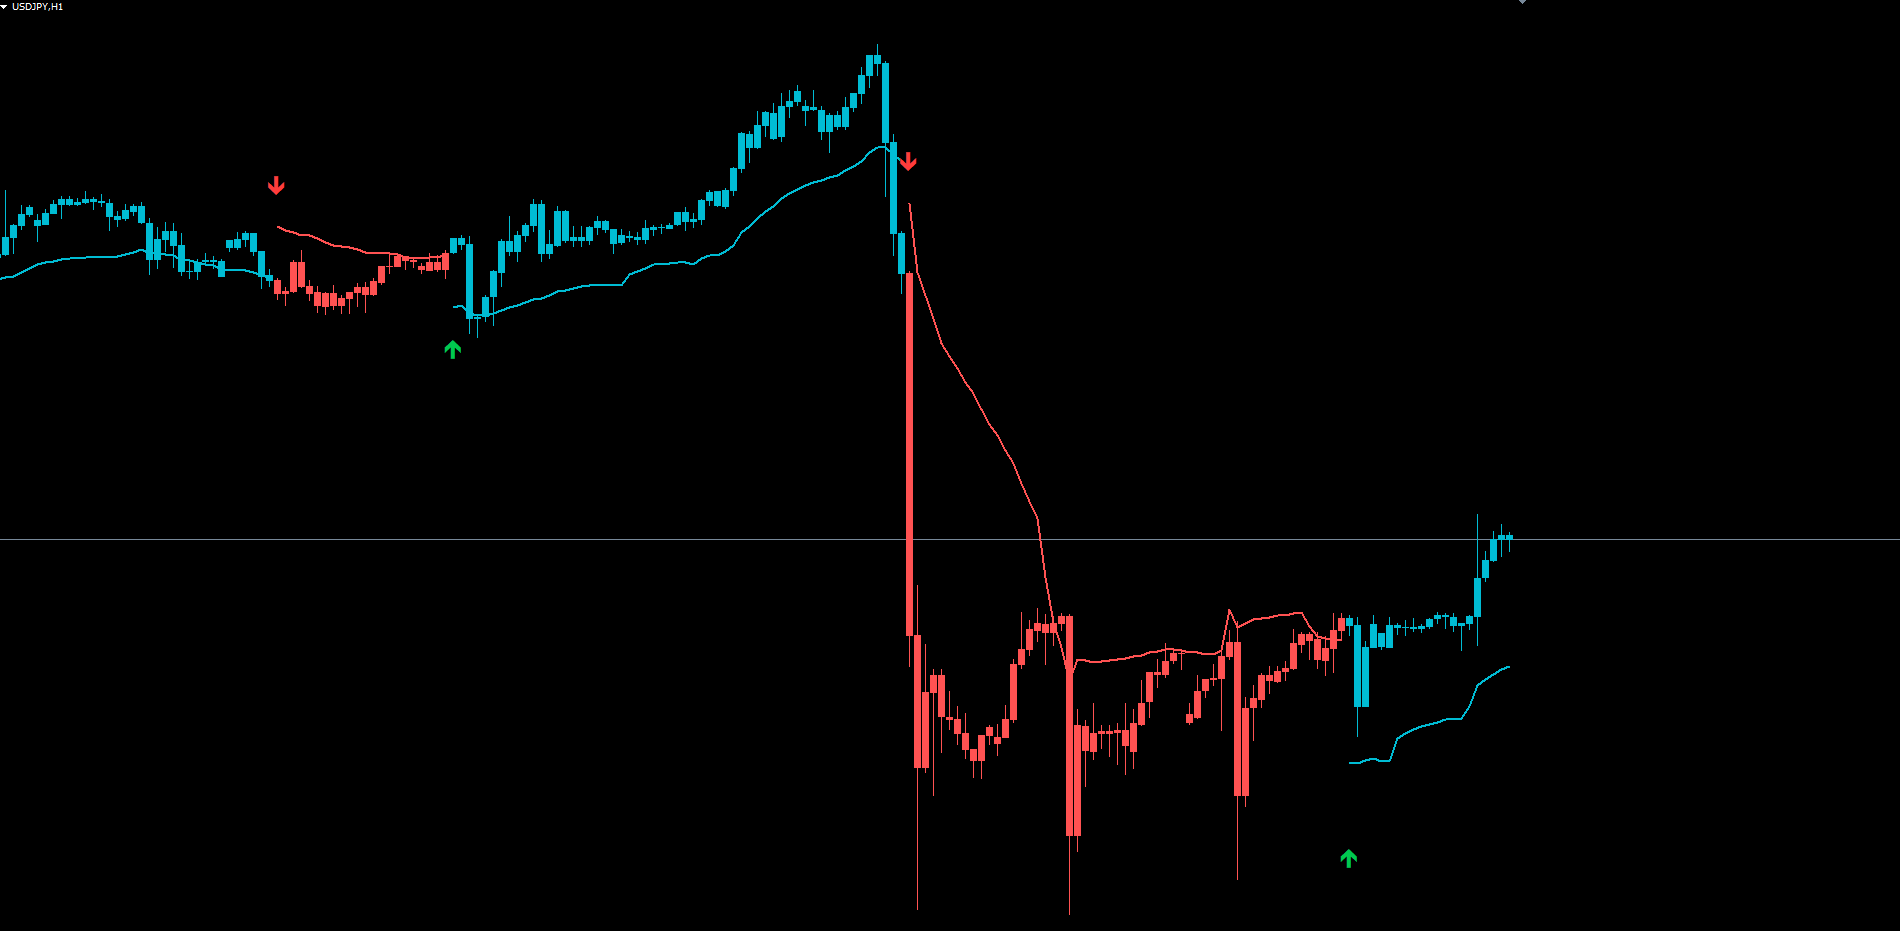
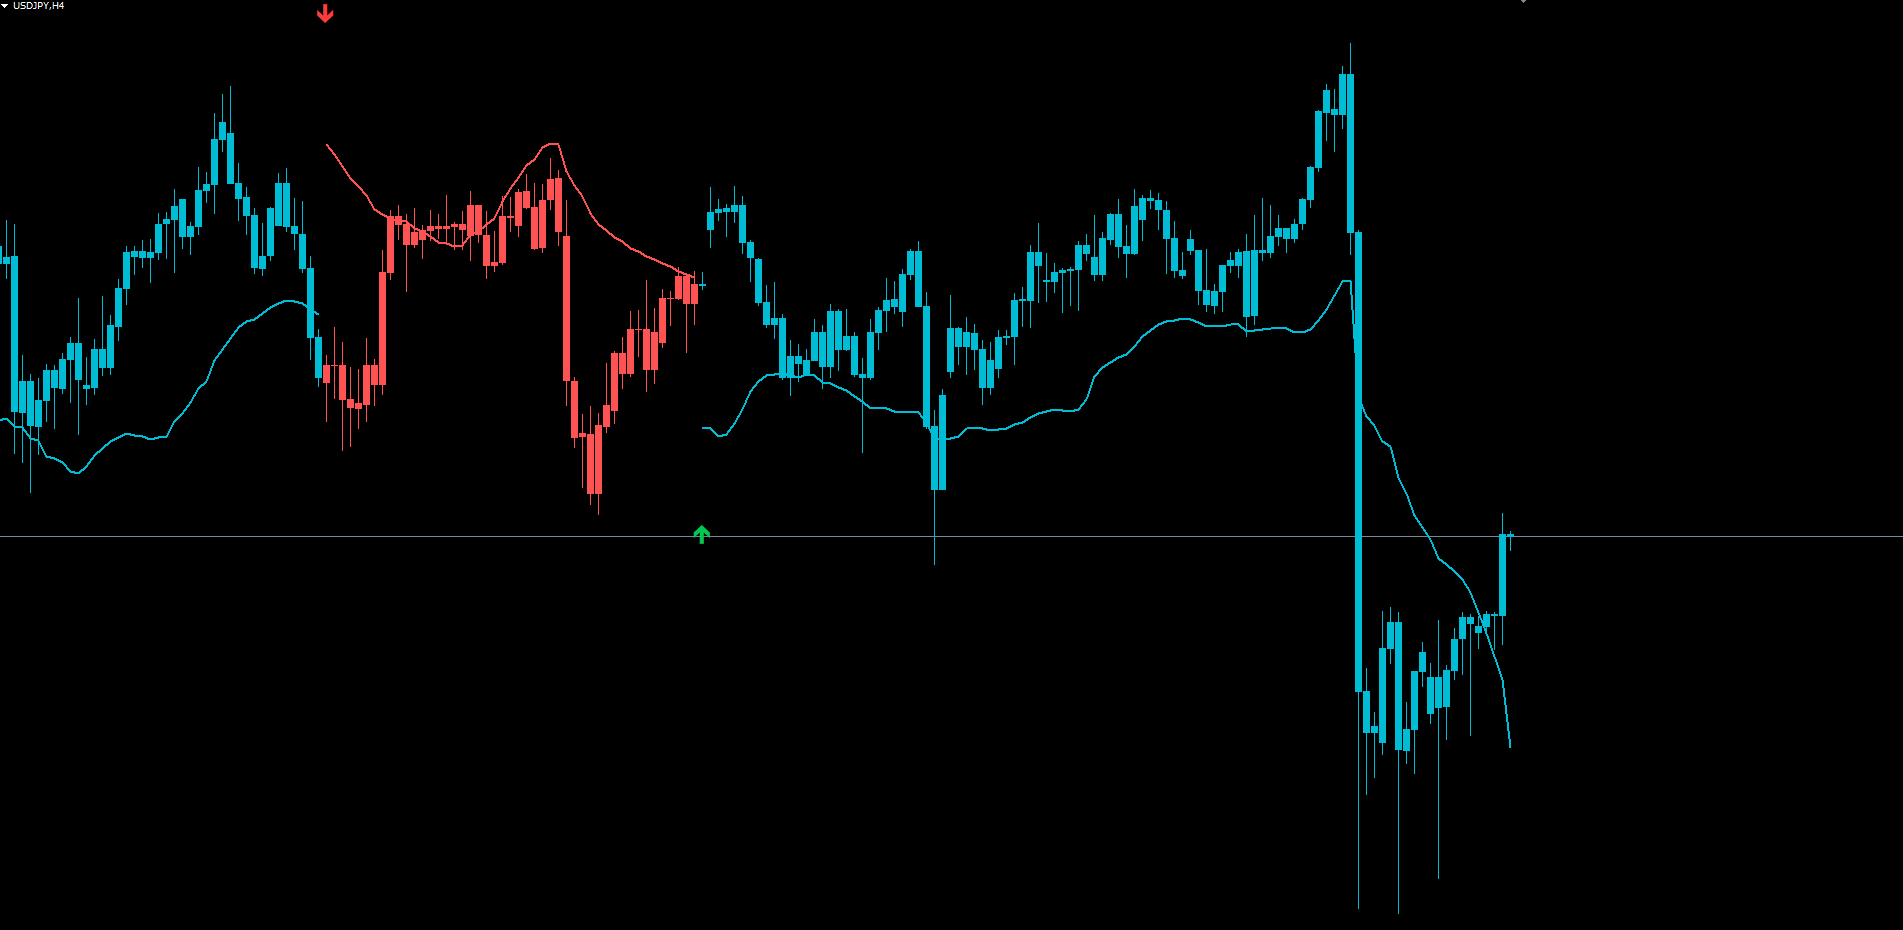
The anchor line is the central visual element. During positive (bullish) state, it is drawn in cyan and sits below price by approximately one band's width. During negative (bearish) state, it is drawn in red and sits above price.
The anchor line moves with the trend. As price advances, the underlying RWMA climbs (during bull) or descends (during bear), and the anchor line tracks along with it. The anchor line is not a price level you should expect price to return to — it is a dynamic reference that follows current structure.
Practical uses:
- Trend confirmation: A cyan line below price confirms bullish state; a red line above price confirms bearish state. If the line position contradicts your expectation, the indicator considers the trend uncommitted.
- Stop-loss reference: A common approach is to place stop-losses near the anchor line and trail them as the line moves with the trend. The adaptive band sizing means the stop is automatically tighter during low-volatility periods and looser during high-volatility periods.
- Re-entry timing: During an extended trend, price may pull back toward the anchor line. A bounce off the line that does not flip the state is often a continuation entry opportunity, though Flow Anchor does not generate explicit re-entry signals.
Colored Candles
Candles are recolored to match the current trend state. Cyan candles indicate bullish state; red candles indicate bearish state. Candles drawn before any state has been established (during the initial warmup period) retain their default chart color.
The recoloring is the fastest visual confirmation of trend direction. A trader scanning multiple charts can immediately identify which symbols are in bullish phases and which are in bearish phases.
Signal Arrows
At every state transition, an arrow is drawn at a fixed offset from the anchor line:
- BUY arrow (Wingdings 233, green): drawn below the bar at anchor minus 1.5 band-widths
- SELL arrow (Wingdings 234, red): drawn above the bar at anchor plus 1.5 band-widths
Arrow placement scales automatically with band size — larger on volatile instruments, smaller on calm ones — keeping the arrows visually proportional regardless of symbol or timeframe.
Trading Strategies
The following three approaches demonstrate different ways to use Flow Anchor. All strategies assume default parameters unless stated otherwise.
WARNING: Trading involves significant risk of loss. These strategies are provided for educational purposes only. Always test on a demo account first and never trade with money you cannot afford to lose.
Strategy A: Always-In-Market Trend Following (H1 - H4)
Goal: Stay aligned with the dominant trend at all times. Flip the position at every state transition.
Setup:
- Apply Flow Anchor to the H1 or H4 chart of your chosen symbol
- Use default parameters
- Enable AlertPopup and AlertSound for desktop awareness
Execution:
- When a BUY arrow fires, open a long position at the open of the next bar
- Place a stop-loss at the anchor line price on entry
- Trail the stop-loss along the anchor line as it moves with the trend
- When the next SELL arrow fires, close the long position and immediately open a short
- Repeat indefinitely
This strategy produces continuous market exposure with one entry per bullish or bearish phase. It works best in trending markets and underperforms during prolonged consolidations where the state flips back and forth without sustained price movement.
Strategy B: Selective Swing Trades (H4 - D1)
Goal: Take only the strongest signals, exit on opposite signal or at a predefined target.
Setup:
- Apply Flow Anchor to the H4 or D1 chart
- Increase InpLength to 20 for stronger filtering
- Tighten the thresholds: InpPositiveAbove = 70, InpNegativeBelow = 25
- Enable AlertPush for mobile notification
Execution:
- When a BUY signal fires on H4 or D1, check that the higher timeframe (D1 or W1 respectively) is also in a bullish state
- If both align, enter long at the open of the next bar
- Place a stop-loss 1.5 times the H4 ATR below entry
- Set a take-profit at 3 times the same ATR (1:2 risk-reward)
- Close the trade at TP, at the opposite-direction signal, or if the stop is hit
This strategy produces fewer trades but each one carries multi-timeframe confluence. Best for traders who cannot monitor charts continuously.
Strategy C: Multi-Symbol Push Alert Monitoring
Goal: Monitor a watchlist of 10+ instruments without sitting at the screen.
Setup:
- Open H1 charts for each symbol in your watchlist
- Apply Flow Anchor to each chart with default parameters
- Enable InpAlertPush = true and configure your MetaQuotes ID in MetaTrader
- Disable InpAlertPopup = false to avoid desktop noise
Execution:
- When a push notification arrives, open the relevant chart on phone or desktop
- Verify the anchor line position confirms the arrow direction
- Check broader market context (news events, session liquidity, correlated symbols)
- Decide whether to take the trade
TIP: For Strategy C, consider tightening the thresholds (InpPositiveAbove = 68, InpNegativeBelow = 28) to reduce notification frequency.
Parameter Tuning Presets
The following preset tables provide starting points for different trading styles. Adjust based on your symbol, broker conditions, and personal preference.
Scalping Preset (M5 - M15)
| Parameter | Scalping Value |
|---|---|
| InpLength | 10 |
| InpPositiveAbove | 60 |
| InpNegativeBelow | 35 |
| InpBandLen | 20 |
| InpBandShift | 10 |
| InpRwmaLen | 14 |
This preset trades faster RMI cycles and tighter bands, suited to intraday entries on liquid Forex majors.
Swing Trading Preset (H1 - H4)
| Parameter | Swing Value |
|---|---|
| InpLength | 14 |
| InpPositiveAbove | 66 |
| InpNegativeBelow | 30 |
| InpBandLen | 30 |
| InpBandShift | 20 |
| InpRwmaLen | 20 |
These are the indicator's defaults. Suitable for most Forex pairs, gold, silver, and major indices on the 1-hour and 4-hour timeframes.
Conservative / Position Preset (H4 - D1)
| Parameter | Conservative Value |
|---|---|
| InpLength | 20 |
| InpPositiveAbove | 70 |
| InpNegativeBelow | 25 |
| InpBandLen | 40 |
| InpBandShift | 25 |
| InpRwmaLen | 30 |
This preset produces fewer signals but each one represents a larger structural shift. Suitable for daily and weekly position trading on Forex majors and indices.
TIP: Start with the Swing Trading preset (defaults) and modify one parameter at a time to observe its effect on signal frequency and quality. Avoid changing multiple parameters at once until you understand each one's individual effect.
Troubleshooting
No Signals Appearing on the Chart
Possible causes and fixes:
- Warmup period not reached. The indicator requires approximately 60 bars of historical data before it can produce reliable state. Scroll back in history or wait for more bars to form.
- Range-bound market. If the RMI never crosses 66 or drops below 30, no state transition occurs. Range-bound markets produce few or no signals — this is expected behavior, not a malfunction.
- Thresholds too strict. If you have tightened InpPositiveAbove or InpNegativeBelow, the triggers may rarely fire. Try defaults (66 / 30) to verify the indicator is working before re-tightening.
Anchor Line Not Visible
- Verify InpShowAnchor = true
- Ensure the anchor line color (cyan or red) is not hidden by your chart background — try the indicator on a default white background to verify
- The anchor line is drawn only when the state is positive or negative; during initial warmup (no state yet established), it is not drawn
Candles Not Recoloring
- Candles are recolored only when the state is positive or negative. Before the first state transition (during initial warmup), candles retain their default chart colors.
- If you have multiple indicators applied to the chart that draw their own candles, the rendering order may cause Flow Anchor's candles to be hidden behind another indicator's. Right-click the chart, choose Indicators List, and reorder the indicators so Flow Anchor is on top.
Alerts Not Firing
- Check that InpAlertBuy and/or InpAlertSell are enabled (the channels are independent)
- For push notifications: verify your MetaQuotes ID is configured in Tools > Options > Notifications and that InpAlertPush = true
- For email alerts: verify SMTP settings in Tools > Options > Email and that InpAlertEmail = true
- Alerts fire once per bar per direction. If you missed an alert, you will not receive a duplicate on the same bar
- Alerts fire only on confirmed (closed) bars. The current bar's intra-tick state changes do not trigger alerts
Different Results Between MT4 and MT5
- The calculation logic is identical between MT4 and MT5. RMI, EMA, ATR, RWMA, and the state machine all use mathematically equivalent formulas
- Tick volume data may differ between MT4 and MT5 feeds because MT5 brokers sometimes provide real volume while MT4 brokers always provide tick volume. This can affect the MFI component of RMI and produce slight numerical differences
- The first few signals at the very edge of historical data (the warmup boundary) may appear at slightly different bar positions due to differences in how MT4 and MT5 initialize indicator buffers. These differences diminish as more historical bars are processed
Indicator Lag or Slow Performance
- Flow Anchor uses bulk calculation on the first chart load (cold start) and incremental updates thereafter. The cold start can take a few seconds on charts with many thousands of historical bars
- If performance is consistently slow, reduce the Max Bars in Chart setting in Tools > Options > Charts to limit the historical depth processed
Frequently Asked Questions
Q: Does the indicator repaint?
A: No. State transitions on bars more than zero shifts back from the current bar are locked once the bar closes. Alerts fire only on confirmed bars and are deduplicated per bar. The current bar (shift 0) does update on each tick because the RMI, EMA, and RWMA values are still being formed — this is normal for any tick-by-tick indicator.
Q: Can I use Flow Anchor on stocks, crypto, or commodities?
A: Yes. The indicator is symbol-agnostic and timeframe-agnostic. It works on any instrument supported by your broker. Note that the MFI component of RMI requires volume data, and some symbols (particularly synthetic indices and certain CFDs) may not provide reliable volume readings.
Q: What is the optimal timeframe?
A: H1 and H4 are the sweet spot for the default parameters. Lower timeframes (M5, M15) produce more frequent state transitions but more false signals. Higher timeframes (D1, W1) produce rare but high-significance transitions. The Scalping and Conservative presets in this manual provide adjusted parameters for non-default timeframes.
Q: How is the anchor line different from a moving average?
A: A standard moving average passes through price and crosses it during transitions. The anchor line is a moving average (RWMA) offset by an adaptive band, so it never sits on top of price — it always sits below in bullish states or above in bearish states. The offset makes it visually distinct and useful as a stop-loss reference.
Q: Why are the BUY and SELL thresholds asymmetric (66 and 30)?
A: The 66 threshold is slightly more sensitive than the conventional 70 RSI overbought level because uptrends often build slowly and would otherwise miss the early stages. The 30 threshold matches the conventional oversold level. This asymmetry can be removed by setting both inputs to symmetric values (e.g., 70 and 30).
Q: Can I use the indicator on multiple charts simultaneously?
A: Yes. Each chart instance maintains its own state. Combined with push notifications, this allows monitoring of a watchlist of many symbols without manually switching between charts.
Q: Does Flow Anchor work in MQL5 Strategy Tester?
A: Yes. The indicator runs in the visual mode and produces results equivalent to live trading. Backtests can be used to evaluate the indicator's signal characteristics on different symbols and timeframes.
Download the indicator:
- MetaTrader 5: Flow Anchor MT5
- MetaTrader 4: Flow Anchor MT4
CONTACT & SUPPORT
- Email: info@forexobroker.com
- Questions: Use the Comments section on the product page or send a private message
- Bug Reports: Please include your broker name, account type, and a screenshot
-
✅ All MQL Tools: https://www.mql5.com/en/users/forexobroker/ ✅
--------------------------------------------------------------------------------------------------------------
🏦 **Broker I use**: https://icmarkets.com/?camp=55869
🏦 **Broker For EU Traders I use 1**: https://www.ictrading.com?camp=91414
🏦 **Broker I use 2**: https://one.exnessonelink.com/boarding/sign-up/a/c_thuv62ocfq
💻 **VPS**: https://chocoping.com/processing/aff.php?aff=738
💼 **Companies I use for getting funded**:
Fundednext: https://fundednext.com/?fpr=kestutis39
The5ers: https://www.the5ers.com/?afmc=16kl
FTMO: https://trader.ftmo.com/?affiliates=nRAyOhmFRnEnFdOpdLeh
Risk Disclaimer
Trading foreign exchange and CFDs on margin carries a high level of risk and may not be suitable for all investors. You may sustain a loss exceeding your initial investment. Trend Quorum is a technical analysis tool and does not guarantee profitable trades. Past performance is not indicative of future results. The authors accept no liability for any loss arising from use of the indicator. By using Trend Quorum you acknowledge sole responsibility for your trading decisions.


")
![[XAUUSD]: Weekly Liquidity Activation Points (timings), June 22-26, 2026](https://c.mql5.com/6/1013/splash-preview-771790.png "[XAUUSD]: Weekly Liquidity Activation Points (timings), June 22-26, 2026")
")