
Deep Trend Curve Indicator: Volume-Weighted Trend with ATR Adaptive Bands for MT4 and MT5

Introduction
A moving average is the most common tool in technical analysis, yet most moving averages share a fundamental weakness. They treat every bar equally. A bar with millions of contracts of participation contributes the same weight to the average as a bar that traded almost nothing. This means a long quiet drift can pull the average sideways while a single high-volume reversal bar gets the same vote, making the line unreliable as a trend reference at exactly the moments when it matters most.
The Volume-Weighted Moving Average solves this by weighting each bar's price by its trading volume. Bars with strong participation count more, bars with thin participation count less, and the resulting line tracks the price level where committed money is actually transacting. Pair this with adaptive volatility bands derived from the Average True Range, and the result is a moving average that does not just track price but defines the boundary at which a trend is meaningfully challenged.
Deep Trend Curve Indicator implements this combination as a non-repainting trend indicator for MetaTrader 4 and MetaTrader 5. It draws a Volume Weighted Moving Average as the trend baseline, surrounds it with ATR adaptive bands at a configurable multiplier, and switches the entire visual stack between bullish and bearish color sets based on a deterministic state machine. Every signal is locked at bar close, so a green line can never become a red line on a previous bar.
The indicator is available for both MetaTrader 4 and MetaTrader 5.
Download the indicator:
- MetaTrader 5: Deep Trend Curve MT5
- MetaTrader 4: Deep Trend Curve MT4
This article explains the underlying concepts, walks through each component of the indicator, documents every input parameter, and provides a practical workflow for using it across different markets and timeframes.
What Is a Volume-Weighted Moving Average
A Simple Moving Average over the last N bars is the sum of those N closes divided by N. Each bar contributes equally regardless of how much actual trading took place. An Exponential Moving Average modifies this by weighting recent bars more heavily, but the weighting depends only on time, not on participation. Both calculations produce a line that smooths price, but neither tells you which price levels actually attracted buyer and seller commitment.
The Volume-Weighted Moving Average changes the formula in a subtle but important way. Each bar's close is multiplied by its volume, the products are summed, and the total is divided by the sum of the volumes. Mathematically, VWMA equals the sum of (close times volume) divided by the sum of volume, evaluated over the lookback window.
The effect is that bars with high volume have a larger influence on the resulting line than bars with low volume. A 30-minute bar that printed during a quiet Asian session contributes less to the VWMA than a 30-minute bar during the London-New York overlap when participation triples. A breakout candle that prints with five times the average volume pulls the VWMA toward its close more aggressively than a quiet drift candle of the same magnitude.
This matters for trend analysis because trend changes that occur on heavy participation are more likely to persist than those that occur in thin conditions. A simple MA cannot distinguish between the two, so it tends to lag in trending markets and whipsaw in ranges. A volume-weighted MA reflects where the committed money is actually positioned, making it a more honest reference line for trend direction.
For currency markets where official volume is not reported, MetaTrader supplies tick volume -- the count of price quotes received during the bar. Tick volume correlates strongly with actual transaction volume on liquid instruments. Deep Trend Curve Indicator uses tick volume as its weight, matching the approach used by the Pine Script reference on TradingView's currency feed.
The standard VWMA period is 34, which corresponds to roughly one and a half trading sessions on the 1-hour chart. Short enough to react meaningfully to changes in market structure, long enough to filter out single-bar noise.
ATR Adaptive Bands Explained
A moving average alone defines a center but does not define a boundary. To know whether price has decisively moved away from the trend baseline, you need a measure of normal volatility around that baseline. Without it, every small move beyond the line looks like a trend change, producing whipsaw behavior that frustrates traders who use only a single MA line.
The Average True Range was introduced by J. Welles Wilder Jr. in 1978 as a measure of recent price variability. Each bar's True Range is the largest of three values: the high minus the low, the absolute difference between the high and the previous close, or the absolute difference between the low and the previous close. The True Range captures the full distance traversed during the bar, including any gap between the previous close and the current open.
ATR averages the True Range values over a chosen period, producing a single number that represents the bar's expected range under recent conditions. On EURUSD H1 with 34 bars of lookback, ATR might read 8 pips during a quiet session and 25 pips during a news release. This adaptive nature is exactly what is needed to construct meaningful bands around a moving average.
Deep Trend Curve Indicator places its upper band at the VWMA plus ATR times the configurable multiplier, and the lower band at the same distance below. With the default multiplier of 1.5 and an ATR of 8 pips, the bands sit 12 pips above and below the VWMA. With the same multiplier and an ATR of 25 pips during volatility, the bands expand to 37.5 pips. The bands automatically scale to whatever the market is currently doing.
This adaptive scaling is essential for a single indicator to work across multiple instruments and timeframes. A pair like GBPJPY with wide daily ranges produces large ATR values and correspondingly wide bands. A pair like EURGBP with narrow ranges produces small ATR values and tight bands. The ATR multiplier remains the same in both cases, but the absolute distance from the VWMA adjusts to each instrument's character.
The ATR multiplier choice is a balance between false signals and slow signals. A multiplier of 1.0 produces tight bands that price pierces frequently, generating more trend changes but also more whipsaws. A multiplier of 2.5 produces wide bands that price only crosses on significant moves, generating fewer signals but with higher conviction. The default 1.5 captures meaningful trend changes without firing on every minor swing.
The Trend State Machine
A trend indicator that simply colors price above the band one way and below the band another way produces a flickering result. As price oscillates around the band edge, the indicator switches color back and forth on every minor probe, generating visual noise that distracts rather than informs. A useful trend indicator needs persistence: once a direction is established, it should hold until a meaningful counter-move occurs.
Deep Trend Curve Indicator implements this through a deterministic state machine with three possible states: bullish, bearish, and neutral. The state transitions according to two simple rules:
- If the close of the current bar is greater than the upper band, the state becomes bullish.
- If the close of the current bar is less than the lower band, the state becomes bearish.
- Otherwise, the state remains whatever it was on the previous bar.
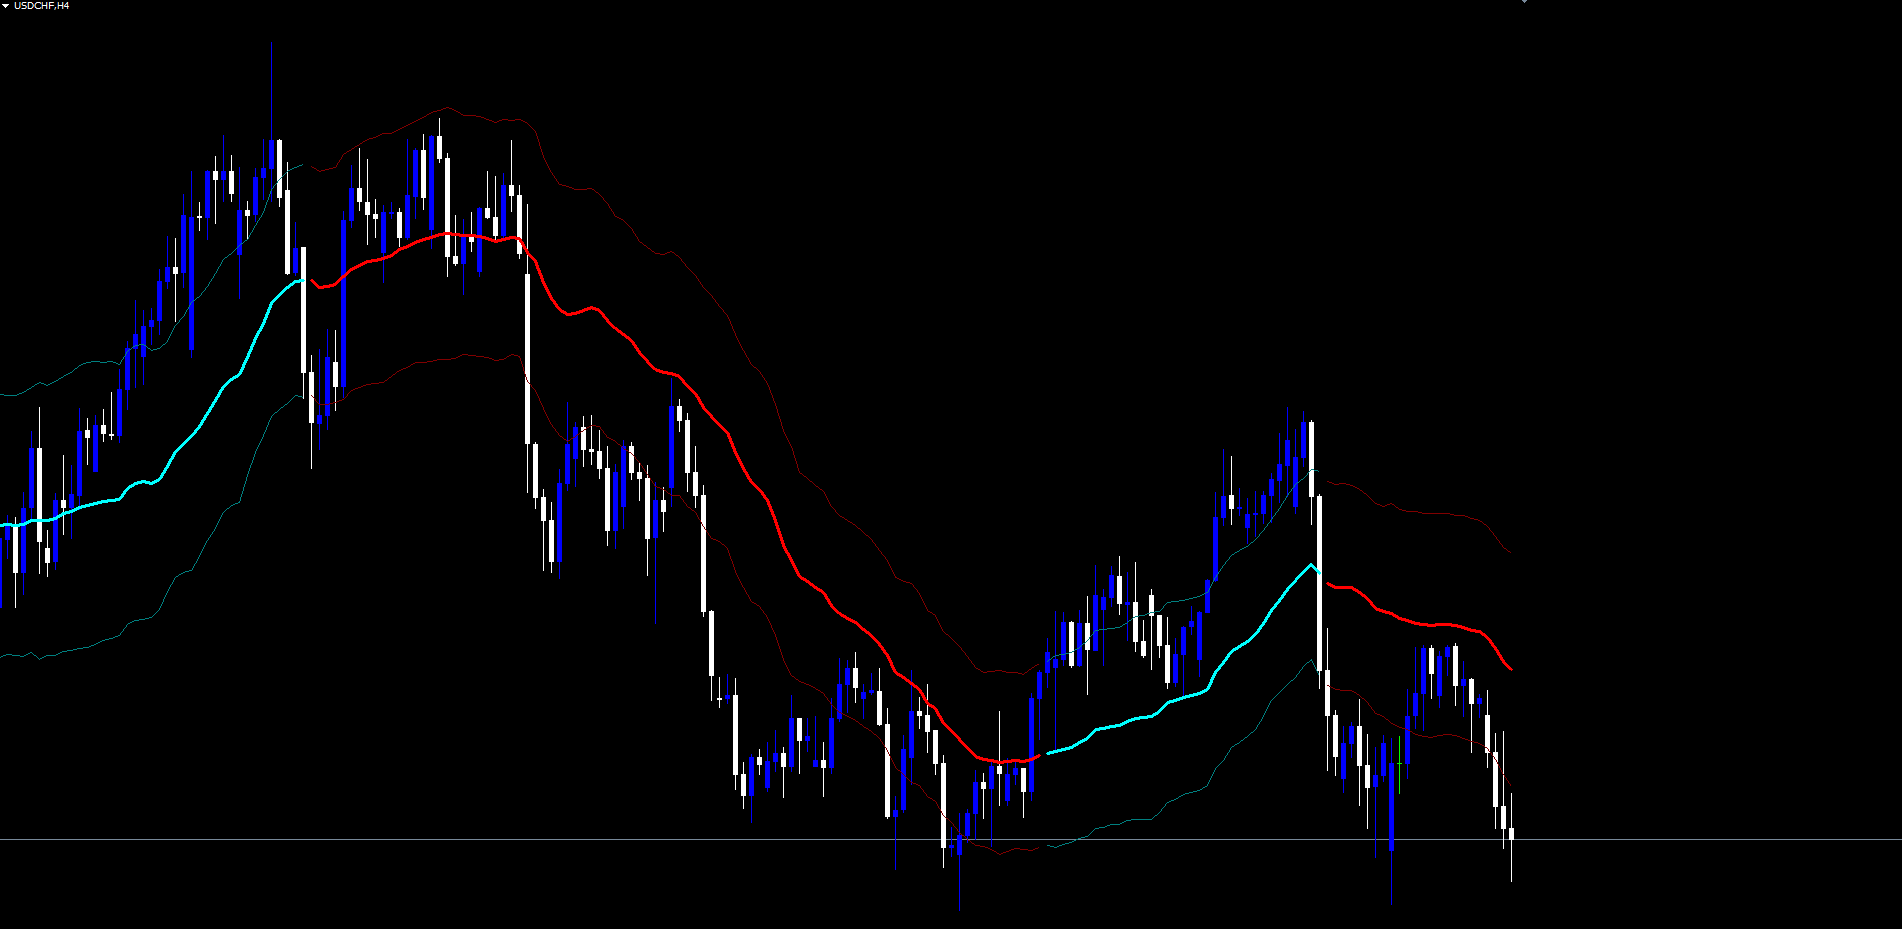
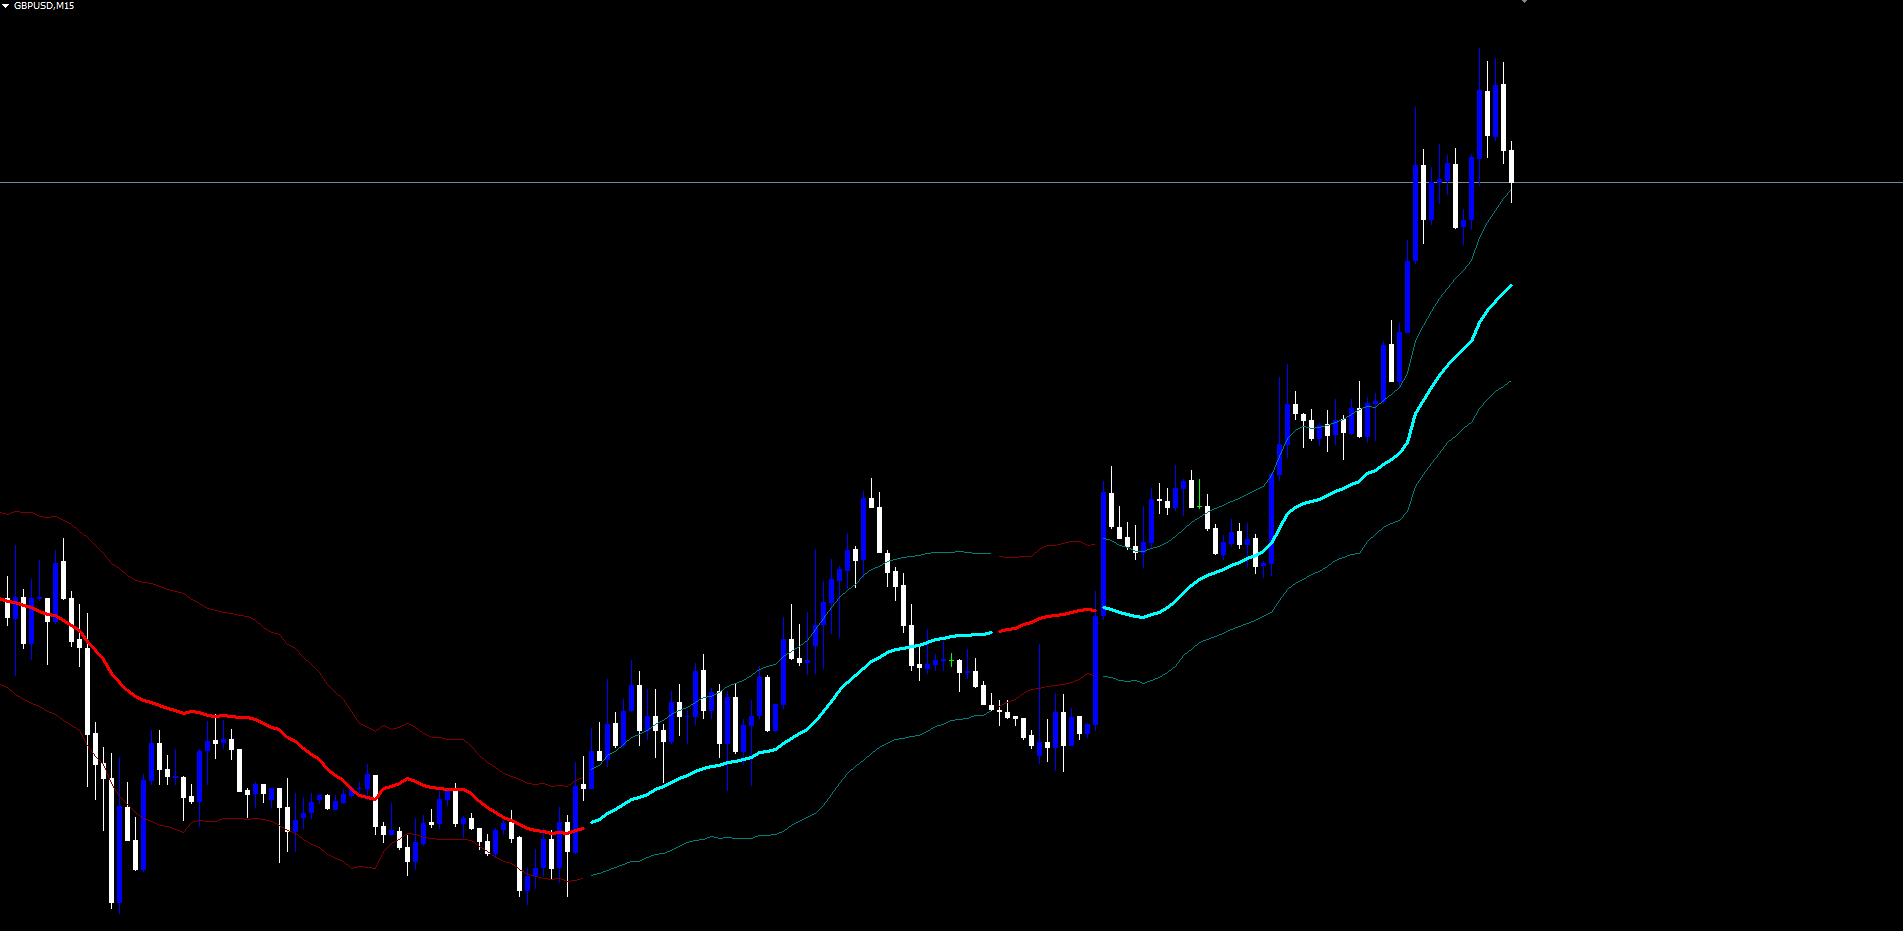
The third rule is what gives the indicator its persistence. When price moves between the upper and lower bands, no transition occurs, and the trend color stays the same. The indicator only flips when price decisively crosses one of the band edges, and once it flips, the new color persists until price decisively crosses the opposite band.
This behavior produces a clean, readable trend visualization. During a strong uptrend, the line stays bullish color for many bars even as price oscillates above the VWMA. During a clear downtrend, it stays bearish for many bars. During chop, it remains in whichever state was last established, until a new breakout confirms the next direction.
The state machine has another important property: it has memory but no lookahead. Each bar's state depends only on its own close and the previous bar's state. Future bars cannot retroactively modify earlier states. This makes the indicator non-repainting by construction, because the state evaluation rule is deterministic and depends only on data that was already final at the moment the bar closed.
The trend state determines which set of buffers receives the visible plot. The indicator maintains six buffers internally: bullish-color VWMA, bearish-color VWMA, bullish upper band, bearish upper band, bullish lower band, bearish lower band. On each bar, only one set is populated based on the trend state, while the other set is set to an empty value that the rendering engine skips. The result is a visually unified line that appears to change color cleanly at each turn.
Non-Repainting Architecture
Repainting is the most important question to ask of any trend indicator. A repainting indicator is one that modifies historical bar values when new data arrives. The most common form happens when the value at the most recent bar is computed using still-forming live tick data, and the value changes as the bar continues to develop.
Deep Trend Curve Indicator handles the live bar with explicit care. The state machine that determines the trend direction evaluates only on closed bars. For the live bar (the rightmost bar still receiving ticks), the trend state is mirrored from the previous closed bar. This means the live bar's color cannot change as ticks arrive, even if intra-bar price action briefly pierces the upper or lower band.
When the live bar closes and a new bar opens, the now-closed bar is re-evaluated against the upper and lower band that existed at its close. If the close exceeded the upper band, the bar transitions to bullish; if below the lower band, to bearish; otherwise, it inherits the previous bar's state. This re-evaluation happens once, at bar close, and the resulting trend state is then permanent.
The visual VWMA and band values do continue to update on the live bar with each new tick, because they are derived from the live close and live ATR. This is normal and expected for any moving average. What does not change is the trend color: the live bar inherits the previous bar's state, so the user is never shown a phantom trend turn that vanishes when the bar closes.
This architecture provides a strict non-repaint guarantee: any signal you saw on a closed bar in your chart is the same signal that was generated in real time when that bar closed. There is no rewriting of history, no signals that look perfect in backtests but disappear in live trading.
The trade-off is that trend changes are confirmed at bar close, not intra-bar. A trader watching the indicator must wait for the bar to complete before the new color is locked in. This one-bar lag is the cost of non-repainting integrity, and it is a trade-off serious traders universally prefer over the alternative.
The Bicolor Visual System
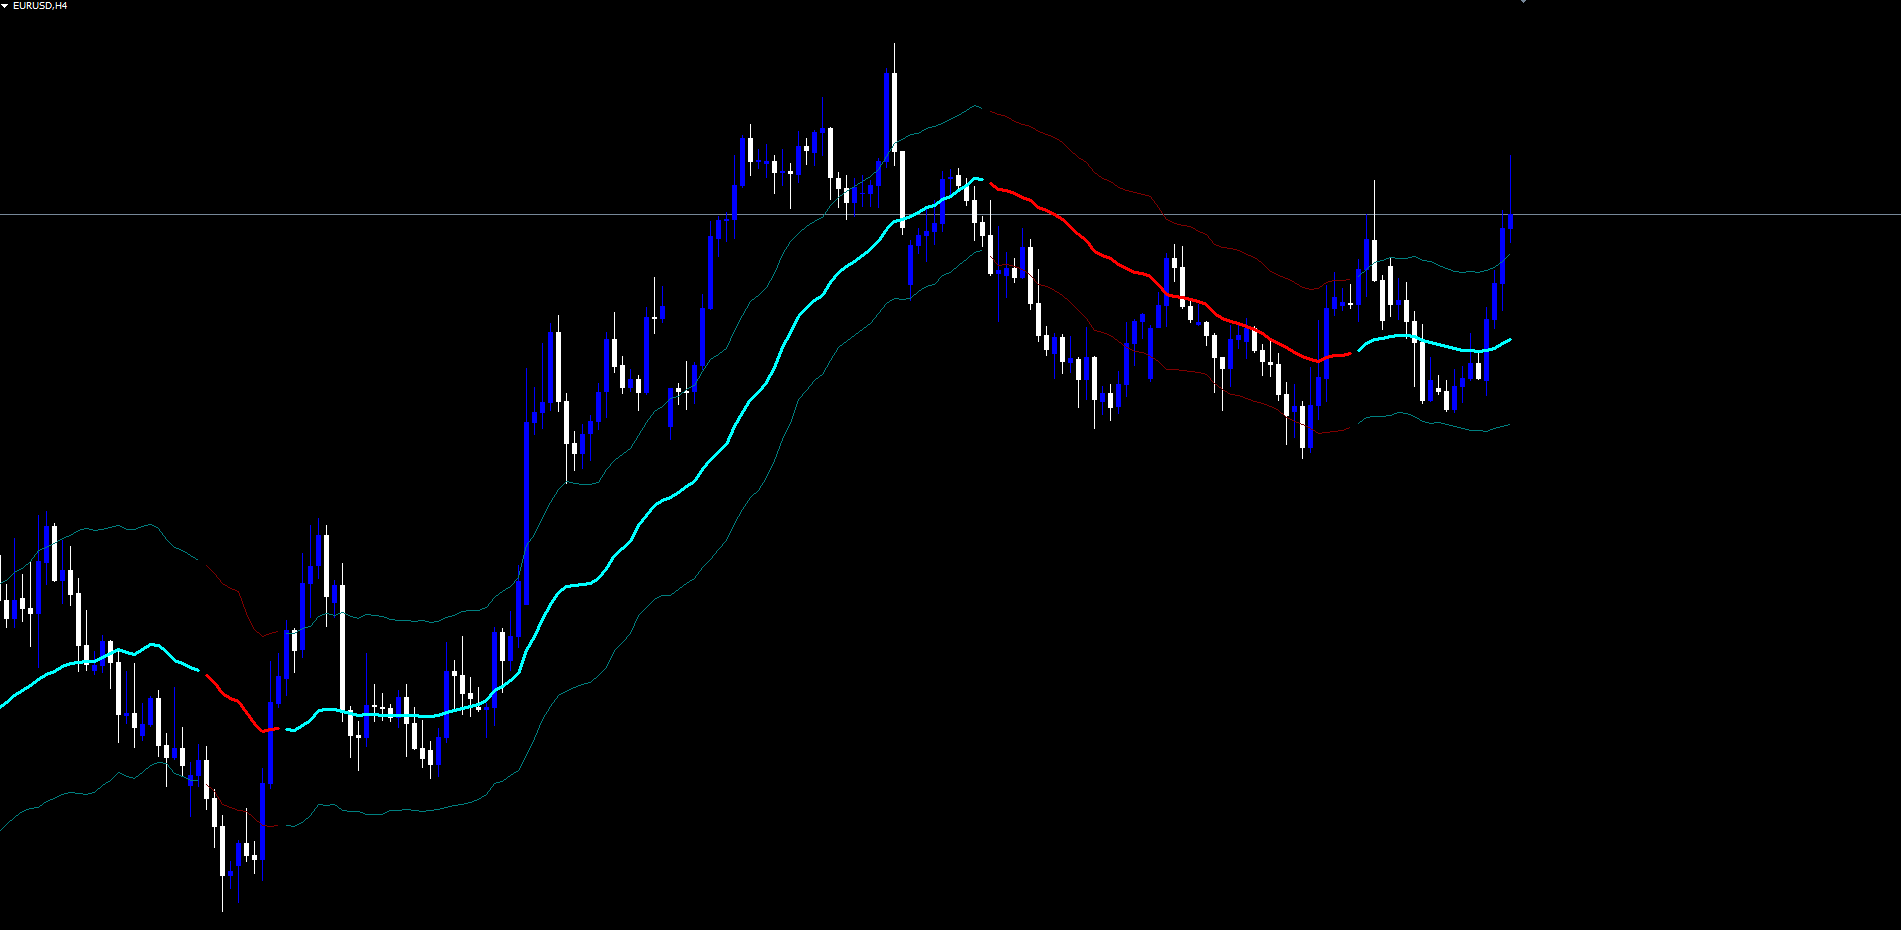
The visual output of Deep Trend Curve Indicator consists of three lines drawn at three different price levels: the VWMA itself in the middle, the upper band above it, and the lower band below. Each of these lines exists in two color variants, bullish and bearish, controlled by the trend state.
The VWMA line uses a thick line width (default 3 pixels) and bright colors (aqua for bullish, red for bearish) to make the trend baseline immediately visible. This is the primary visual element that traders track. When the trend is bullish, the line is drawn in aqua; when bearish, in red. The transitions occur cleanly at bar close because of the state machine's persistence rule.
The upper and lower bands use thinner line widths (default 1 pixel) and darker color variants (teal for bullish, maroon for bearish) to provide volatility context without overwhelming the chart. These lines mark the boundaries that price must cross for a trend transition. Because the bands inherit the trend color, traders can see at a glance whether the current trend's volatility envelope is expanding or contracting.
The color separation between bullish and bearish states is deliberately chosen for high contrast and color-blind accessibility. Aqua and red are nearly opposite on the color wheel and remain distinguishable under most forms of color vision deficiency. The teal and maroon band variants are darker shades of the same hues, preserving the visual association with the trend direction while remaining secondary to the main VWMA line.
The visual stack is organized so the VWMA line is drawn last and therefore appears on top of the bands. This is essential when bands and VWMA cross or run close together, ensuring the central trend reference is never obscured by its own volatility envelope.
Why Tick Volume on Forex
A common question with VWMA implementations is whether the volume figure is meaningful on currency markets. The forex spot market is decentralized, with no central exchange reporting consolidated volume. Each broker sees only its own client transactions, and there is no industry-wide volume tape comparable to what exists for stocks or futures.
What MetaTrader provides instead is tick volume, the count of price ticks received during each bar. A tick is a price quote update from the broker's data feed. During quiet sessions with little activity, the broker sends fewer ticks per bar. During active sessions and around news releases, ticks arrive in rapid succession, producing higher tick counts.
Empirical studies have found that tick volume correlates strongly with actual transaction volume on liquid currency pairs. The correlation is not perfect, but it is sufficient for the relative weighting needed by a volume-weighted moving average. A bar with twice the tick volume of its neighbors generally represents twice the activity, regardless of whether actual transaction counts are reported.
Deep Trend Curve Indicator uses tick volume directly as the weight in its VWMA calculation. On forex pairs, indices, and crypto, this produces a meaningful weighted average. The indicator does not attempt to switch between volume types; it consistently uses tick volume to ensure cross-platform reproducibility. For instruments where tick volume is somehow zero, the indicator falls back to using close prices alone, effectively becoming a Simple Moving Average for those bars.
The Alert System
Automated alerts allow traders to monitor multiple instruments without continuous chart observation. Deep Trend Curve Indicator supports two distinct alert events tied to confirmed trend transitions:
- Bullish trend confirmed -- fires when the trend state transitions to bullish on bar close.
- Bearish trend confirmed -- fires when the trend state transitions to bearish on bar close.
Each alert message includes the symbol name and the alert state description, providing enough information to identify which chart and which event without opening MetaTrader.
Four delivery channels can be configured independently:
| Channel | Default | Parameter |
|---|---|---|
| Popup (on-screen dialog) | Enabled | InpAlertPopup = true |
| Sound (alert.wav) | Disabled | InpAlertSound = false |
| Disabled | InpAlertEmail = false | |
| Push notification (mobile) | Disabled | InpAlertPush = false |
Alerts are guarded by a once-per-bar mechanism keyed on bar time. The indicator stores the timestamp of the most recent bar that triggered an alert and refuses to fire again on the same bar. This prevents duplicate notifications during volatile bar formations.
The master switches InpAlertBull and InpAlertBear allow traders to enable or disable each alert direction independently. For mobile push to work, MetaTrader must be configured with a valid MetaQuotes ID in Tools > Options > Notifications. For email alerts, SMTP server settings must be entered in Tools > Options > Email.
A recommended setup for active traders is to enable Popup and Push, leave Sound and Email disabled to avoid notification fatigue, and configure push delivery to a dedicated mobile device. This combination provides immediate awareness on the desktop and mobile alerting away from the chart.
Practical Trading Workflow
Understanding each component individually is important, but applying them in a structured workflow is what produces consistent results.
Step 1: Add the indicator to a chart. Open any chart in MT4 or MT5. Find Deep Trend Curve Indicator in the Navigator panel under Indicators > Market. Drag it onto the chart. The default settings work on most instruments without modification. Start with a 1-hour or 4-hour chart to see clearly defined trend states with reasonable bar counts.
Step 2: Confirm trend direction. Look at the VWMA line color. Aqua means bullish; red means bearish. The state persists until a confirmed close beyond the opposite band. New trend directions are not chased intra-bar -- the color updates at bar close and remains stable until the next confirmed transition.
Step 3: Use the bands as volatility context. The upper and lower bands mark the levels where a trend transition would be triggered. When price approaches the opposite band (the lower band during a bullish trend, or the upper band during a bearish trend), the current trend is being challenged. When price stays comfortably between the bands, the existing trend is being maintained.
Step 4: Wait for confirmation alerts. Enable popup or push alerts to be notified when a confirmed trend transition occurs. The alert fires once at bar close, with no repainting. A bullish alert means the close just exceeded the upper band, locking in a bullish state. A bearish alert means the close just dropped below the lower band.
Step 5: Combine with your trading framework. Deep Trend Curve Indicator is a trend filter, not a complete trading system. Use it to confirm directional bias before applying your own entry, exit, and risk management rules. A common workflow is to take long entries only during bullish trends and short entries only during bearish trends, using a separate signal source for the precise entry trigger.
Timeframe Considerations
The indicator adapts to any timeframe through its ATR-based bands.
On lower timeframes (M5, M15), trend transitions occur frequently. The VWMA at 34 bars covers a few hours of price action, so the trend state changes several times per session. Suitable for scalping or short-duration intraday trades.
On medium timeframes (M30, H1, H4), trend transitions are less frequent and tend to align with intraday or multi-day structural moves. The VWMA covers approximately one to several trading days, producing trend states that persist long enough to capture meaningful swing moves. This is the most natural fit for the indicator's defaults.
On higher timeframes (D1, W1), each trend transition reflects a multi-week structural shift and is comparatively rare. Position traders may see only a few changes per quarter, but each one carries significant weight.
Multi-Chart Setup
Because the indicator operates independently on each chart, traders can add it to multiple instruments and timeframes simultaneously. Combined with push notification alerts, this allows monitoring of a watchlist of 10 or more instruments without manually switching between charts.
A practical approach is to run Deep Trend Curve Indicator on the H1 chart for each of your primary trading instruments, with InpAlertPush enabled and InpAlertPopup disabled. Push notifications arrive only on confirmed bar close, providing clean awareness without desktop interruptions.
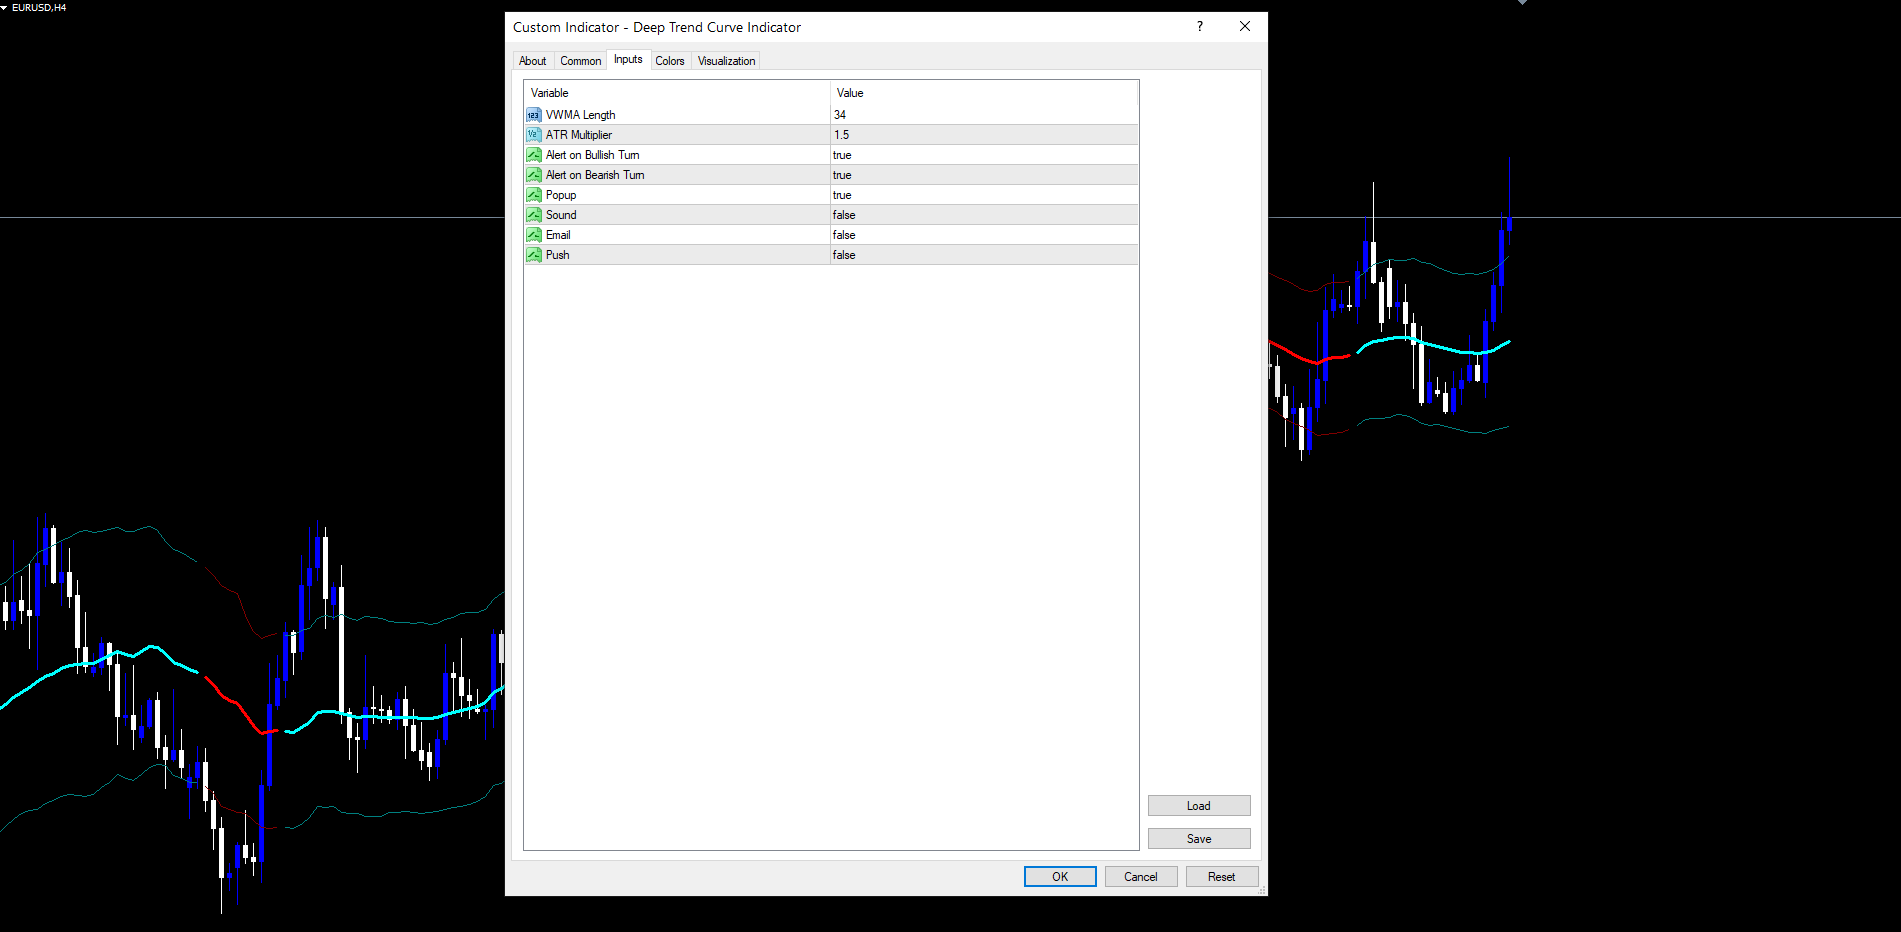
Parameter Reference
All input parameters are listed below. Default values match the source code exactly.
Calculation Parameters
| Parameter | Default | Description |
|---|---|---|
| InpVwmaLength | 34 | Number of bars in the VWMA and ATR calculations |
| InpAtrMult | 1.5 | Multiplier applied to ATR for upper and lower band distance |
Visualization Settings
The visual color scheme is controlled by the indicator_color directives in the source. The default colors are:
| Element | Bullish Color | Bearish Color |
|---|---|---|
| VWMA main line | clrAqua | clrRed |
| Upper band | clrTeal | clrMaroon |
| Lower band | clrTeal | clrMaroon |
Line widths default to 3 pixels for the VWMA and 1 pixel for the bands.
Alert Settings
| Parameter | Default | Description |
|---|---|---|
| InpAlertBull | true | Fire alert when trend transitions to bullish |
| InpAlertBear | true | Fire alert when trend transitions to bearish |
| InpAlertPopup | true | Show on-screen popup dialog |
| InpAlertSound | false | Play alert.wav sound file |
| InpAlertEmail | false | Send email notification |
| InpAlertPush | false | Send push notification to mobile |
Recommended Configuration Profiles
Default (balanced): InpVwmaLength = 34, InpAtrMult = 1.5. Suitable for most Forex pairs on H1 and H4. Captures meaningful trend changes while filtering minor swings.
Fast Response (intraday): InpVwmaLength = 21, InpAtrMult = 1.2. Tighter bands and a shorter VWMA produce more frequent trend transitions. Best for M5, M15, and M30 charts.
Smooth Trend (positional): InpVwmaLength = 55, InpAtrMult = 2.0. Wider bands and a longer VWMA produce fewer but higher-conviction transitions. Suitable for H4, D1, and W1.
Installation
Deep Trend Curve Indicator is distributed through the MQL5.com Market and installs automatically after purchase.
- Purchase the indicator from the MQL5.com Market product page.
- The indicator downloads and installs automatically into MetaTrader.
- Open the Navigator panel (Ctrl+N) and expand Indicators.
- Find Deep Trend Curve Indicator under Indicators > Market.
- Drag the indicator onto any chart.
- Adjust input parameters if needed, then click OK.
The indicator works on all timeframes and all instruments supported by your broker. No manual file copying is required. Allow a few moments for historical calculation on first attach; the warmup is approximately InpVwmaLength + 2 bars.
The indicator uses 6 visible buffers (VWMA bull/bear, upper bull/bear, lower bull/bear) plus 1 internal calculation buffer for the trend state. The MT4 build uses series-indexed buffers and predefined Close, High, Low, Volume arrays. The MT5 build uses chronologically-indexed parameter arrays converted to series via ArraySetAsSeries for consistent shift-based logic. Both builds produce visually identical output.
Compatibility Notes
Deep Trend Curve Indicator is a chart-window overlay. It draws directly on the price chart rather than in a separate sub-window. The trend baseline and bands appear at actual price levels, allowing direct visual comparison between candles and the indicator output.
The indicator is fully symbol-agnostic and timeframe-agnostic. It works on Forex majors, crosses and exotics, indices, commodities, and crypto. The ATR scaling automatically adapts to each instrument's volatility profile. The indicator does not interact with the trading account; it draws lines and fires alerts. All trading decisions remain with the trader.
Conclusion
Deep Trend Curve Indicator combines a Volume Weighted Moving Average with ATR adaptive bands to produce a trend-following overlay that adapts to both participation and volatility. The volume weighting ensures that the trend baseline reflects where committed money is positioned rather than treating all bars equally. The ATR bands produce volatility-adjusted boundaries that scale automatically across instruments and timeframes. The state machine guarantees clean, persistent trend coloring without flickering or repainting.
The indicator is designed for traders who want a single-glance trend reference they can trust to remain stable from one bar to the next. It does not generate entry signals on its own; it generates trend states. Entry decisions, position sizing, and exit management are layered on top of the trend state by the trader.
Two alert types and four delivery channels support multi-instrument monitoring without continuous chart observation. The non-repainting architecture means that historical bars cannot rewrite themselves when new data arrives, providing the integrity needed for both manual trading and any automation that consumes the indicator's output as a filter input.
The indicator is available for both MetaTrader 4 and MetaTrader 5, with both builds producing visually identical output. Default parameters work across most markets and timeframes, while the Fast Response and Smooth Trend presets provide pre-tuned starting points for intraday and positional use cases respectively.
Whether used as a standalone trend filter, as a confirmation tool alongside other analysis methods, or as the directional bias input to a multi-indicator workflow, the systematic approach to volume-weighted trend detection and ATR-adaptive band construction provides a foundation for disciplined, rule-based trading.
Download the indicator:
- MetaTrader 5: Deep Trend Curve MT5
- MetaTrader 4: Deep Trend Curve MT4
CONTACT & SUPPORT
- Email: info@forexobroker.com
- Questions: Use the Comments section on the product page or send a private message
- Bug Reports: Please include your broker name, account type, and a screenshot
-
✅ All MQL Tools: https://www.mql5.com/en/users/forexobroker/ ✅
--------------------------------------------------------------------------------------------------------------
🏦 **Broker I use**: https://icmarkets.com/?camp=55869
🏦 **Broker For EU Traders I use 1**: https://www.ictrading.com?camp=91414
🏦 **Broker I use 2**: https://one.exnessonelink.com/boarding/sign-up/a/c_thuv62ocfq
💻 **VPS**: https://chocoping.com/processing/aff.php?aff=738
💼 **Companies I use for getting funded**:
Fundednext: https://fundednext.com/?fpr=kestutis39
The5ers: https://www.the5ers.com/?afmc=16kl
FTMO: https://trader.ftmo.com/?affiliates=nRAyOhmFRnEnFdOpdLeh
Risk Disclaimer
Trading foreign exchange and CFDs on margin carries a high level of risk and may not be suitable for all investors. You may sustain a loss exceeding your initial investment. Trend Quorum is a technical analysis tool and does not guarantee profitable trades. Past performance is not indicative of future results. The authors accept no liability for any loss arising from use of the indicator. By using Trend Quorum you acknowledge sole responsibility for your trading decisions.


![[XAUUSD]: Weekly Liquidity Activation Points (timings), June 22-26, 2026](https://c.mql5.com/6/1013/splash-preview-771790.png "[XAUUSD]: Weekly Liquidity Activation Points (timings), June 22-26, 2026")
