
USDJPY Price Action Analysis - retracement bearish pattern for correction
3 December 2015, 15:11

0
1 901
W1 price is located above 200 period SMA (200 SMA) and 100 period SMA (100 SMA) for the primary bullish with secondary ranging between Fibo support level at 116.13 and resistance level at 125.85:
- Fibo resistance level at 123.75 is located near and below the price; if the price breaks this level to above so we may see the next target as 125.85 resistance level;
- retracement bearish pattern was forming by the price for the secondary correction to be started within the primary bullish market condition;
- is going to be crossed by the price from above to below for the secondary correctional trend to be started;
- the price is ranging between 38.3% Fibo support level at 94.27 and 97.30 Fibo resistance level;
- triangle pattern was formed and it was crossed by the price from above to below for local downtrend to be started within this bullish market condition.
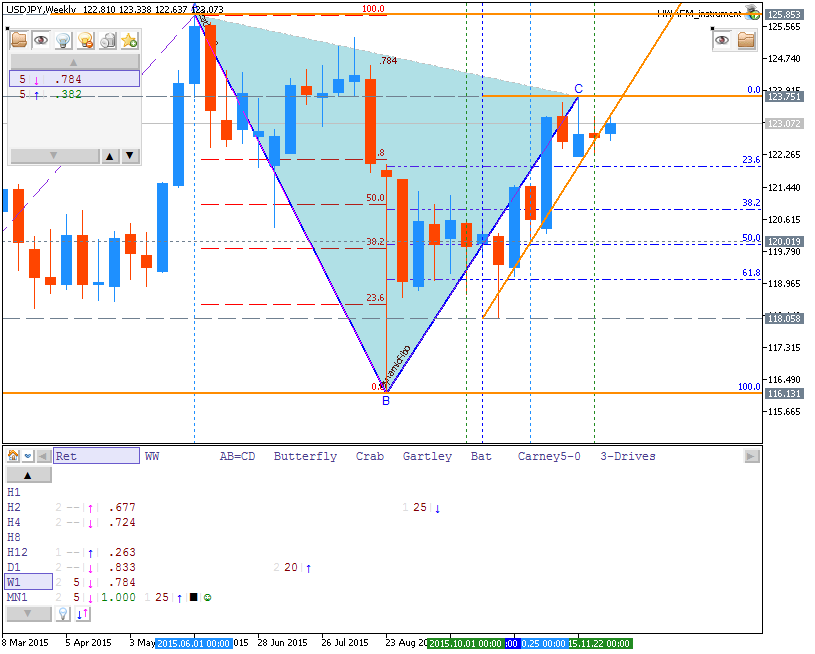
If the price will break Fibo support level at 116.13 so we may see the secondary correction within the primary bullish with the good possibility to the reversal of the price movement to the primary bearish market condition.
If the price will break resistance level at 125.85 from below to above so the primary bullish trend will be continuing.
If not so the price will be ranging between the levels.
Trend:


")
