
Automated Wolfe Wave Detection: How the Wolfe Wave Dashboard Scans 20 Symbols Across All Timeframes for Reversal Setups

Automated Wolfe Wave Detection: How the Wolfe Wave Dashboard Scans 20 Symbols Across All Timeframes for Converging Wedge Reversal Setups with Built-In Target Lines
1. Introduction & Hook
You are staring at EURUSD on the hourly chart, trying to piece together five swing points into a Wolfe Wave pattern -- a converging wedge structure where two trendlines drawn through alternating pivots narrow toward a single point in the future. You think you have found point 1 at a swing low, point 2 at the subsequent high, and point 3 at a lower swing low -- but do the lines through 1-3 and 2-4 actually converge to the right? You extend them visually, squinting at the angle, and decide they might converge somewhere beyond the chart's visible range. Now you need point 5 to touch or approach the line from 1 through 3, forming the final leg of the descending wedge -- the entry point where price is expected to reverse. By the time you have drawn both trendlines, assessed convergence, and decided the wedge geometry is valid, price has already bounced from point 5 and is moving toward the target line.
Now multiply that by twenty symbols across nine timeframes. The Wolfe Wave is one of the most powerful reversal patterns in technical analysis -- a converging wedge that comes with its own built-in profit target -- but its reliance on precise trendline convergence and five-point geometric validation makes it demanding to identify correctly. Each potential Wolfe Wave requires locating five confirmed swing points in the correct alternating sequence, then drawing and extending two trendlines to verify they converge in the right direction. Manual scanning for Wolfe Wave patterns across a full watchlist is not just slow; it is operationally unfeasible.
The fundamental problem is not understanding the pattern. Most traders who study wedge-based reversal patterns can describe the Wolfe Wave structure and its five-point geometry from memory. The problem is that no human can scan 180 chart combinations in real time, identify every valid five-point converging wedge formation, validate trendline convergence geometry, and act on them before the entry window at point 5 closes. You need a system that performs the geometric analysis for you -- continuously, automatically, and across your entire watchlist.
I built the Wolfe Wave Dashboard to solve this exact problem. It scans up to 20 symbols across nine timeframes, identifies confirmed swing pivots, constructs potential Wolfe Wave patterns, validates them against trendline convergence criteria with configurable tolerances, and presents every valid pattern in a compact six-column dashboard with real-time alerts. No manual trendline drawing. No missed patterns. One glance tells you which symbols have active Wolfe Wave setups right now.
The indicator is available on the MQL5 Market for both platforms:
- MetaTrader 5: Wolfe Wave Dashboard MT5
- MetaTrader 4: Wolfe Wave Dashboard MT4
2. What Is Wolfe Wave Trading?
Wolfe Wave trading is a methodology based on the idea that price movements form natural channels -- converging wedge structures where supply and demand forces reach equilibrium before reversing. When five alternating swing points align into a converging wedge with specific geometric properties, they identify a high-probability reversal zone where price is expected to change direction and travel toward a mathematically defined target.
The concept was developed by Bill Wolfe in the 1990s, drawing inspiration from Newton's Third Law of motion: for every action, there is an equal and opposite reaction. Applied to financial markets, this principle suggests that price trends create natural counter-forces. When price moves in a series of waves that form a tightening wedge, the compression of buying and selling pressure eventually produces a reversal of equivalent magnitude. The Wolfe Wave pattern captures this moment of equilibrium and identifies both the reversal point and the expected destination.
What makes the Wolfe Wave fundamentally different from harmonic patterns is that it uses no Fibonacci ratios whatsoever. There are no retracement percentages to calculate, no extension ratios to validate, and no mathematical relationships between leg lengths. The entire validation is geometric -- based on whether two trendlines drawn through alternating swing points converge in the correct direction. This makes the Wolfe Wave a purely visual, trendline-based pattern that relies on the angle and direction of convergence rather than ratio mathematics.
The Wolfe Wave also holds a unique position among chart patterns because it is one of the very few formations that comes with a built-in profit target. When the pattern completes at point 5, a line drawn from point 1 through point 4 and extended to the right provides a natural take-profit level. This target line is not an estimate or a Fibonacci projection -- it is a geometric consequence of the pattern's structure. Price is expected to travel from the point 5 reversal toward this target line, giving traders a clear, mathematically derived exit point without needing to calculate risk-reward ratios manually.
Why do these converging wedge structures repeat? Markets oscillate between phases of expansion and contraction. When price moves in a series of waves that create progressively tighter channels -- lines 1-3 and 2-4 converging toward a point in the future -- it reflects a market that is losing momentum in the prevailing direction. The convergence represents diminishing force behind the trend, and point 5 marks the moment where that force is exhausted. The reversal from point 5 is the market's reaction to the compressed energy within the wedge, and the target line represents the expected magnitude of that reaction.
3. The Wolfe Wave Pattern Explained
The Wolfe Wave pattern consists of five consecutive swing points -- numbered 1, 2, 3, 4, and 5 -- that form a specific converging wedge structure with two trendlines drawn through alternating pivots. Unlike patterns that validate through ratio mathematics, the Wolfe Wave validates through geometric convergence: the two defining trendlines must narrow toward each other when extended to the right.
There are two types of Wolfe Wave patterns:
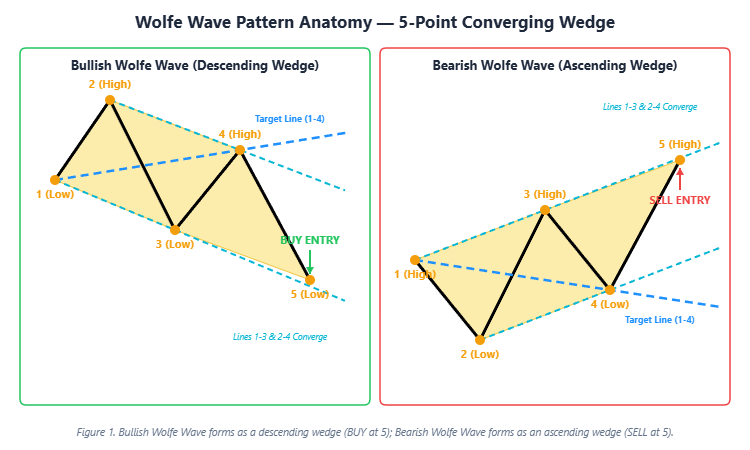
Bullish Wolfe Wave (Descending Wedge)
In a bullish Wolfe Wave, the five points form this structure:
- Point 1 is a swing low -- the first valley in the pattern
- Point 2 is a swing high -- price rises from point 1 to point 2
- Point 3 is a swing low -- lower than point 1, forming a declining lower trendline
- Point 4 is a swing high -- lower than point 2, forming a declining upper trendline
- Point 5 is a swing low -- the BUY entry point, where price touches or approaches the lower trendline (line 1-3) one final time
The lines through points 1-3 and points 2-4 both slope downward, but they converge -- the lower line descends more steeply than the upper line, creating a narrowing descending wedge. The pattern completes at point 5, where price is expected to reverse upward and travel toward the target line drawn from point 1 through point 4.
Bearish Wolfe Wave (Ascending Wedge)
In a bearish Wolfe Wave, the structure mirrors the bullish version:
- Point 1 is a swing high -- the first peak in the pattern
- Point 2 is a swing low -- price drops from point 1 to point 2
- Point 3 is a swing high -- higher than point 1, forming a rising upper trendline
- Point 4 is a swing low -- higher than point 2, forming a rising lower trendline
- Point 5 is a swing high -- the SELL entry point, where price touches or approaches the upper trendline (line 1-3) one final time
The lines through points 1-3 and points 2-4 both slope upward, but they converge -- the upper line ascends more steeply than the lower line, creating a narrowing ascending wedge. The pattern completes at point 5, where price is expected to reverse downward toward the target line.
The key features that distinguish the Wolfe Wave from other reversal patterns are threefold. First, it uses purely geometric validation based on trendline convergence -- no Fibonacci ratios or mathematical relationships between leg lengths. Second, the pattern provides a built-in target line (from point 1 through point 4, extended right) that defines the expected price destination after the point 5 reversal. Third, the converging wedge structure itself tells you the prevailing trend is losing momentum, making it a natural mean-reversion signal.
Figure 1. Bullish Wolfe Wave forms as a descending wedge with BUY at point 5; Bearish Wolfe Wave forms as an ascending wedge with SELL at point 5.
4. The Convergence Validation Engine
The trendline convergence criteria are what transform a random five-point price swing into a validated Wolfe Wave pattern. Without convergence validation, you would be trading every wedge-like formation in price, and most of those would be meaningless noise. The Wolfe Wave pattern requires specific geometric relationships between the two defining trendlines -- and these relationships are validated entirely without Fibonacci ratios.
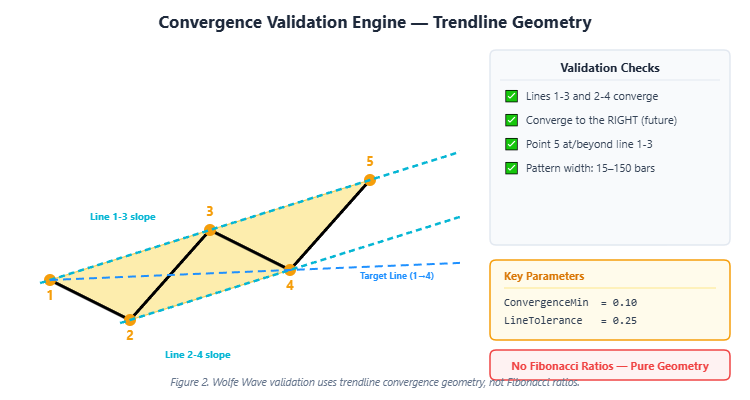
Lines 1-3 and 2-4 Must Converge to the Right
The core geometric requirement of every Wolfe Wave is that the trendline through points 1 and 3 and the trendline through points 2 and 4 must converge -- meaning they will intersect at some point to the right of the pattern (in the future). If the lines are parallel, there is no wedge compression and no Wolfe Wave. If they diverge (spread apart to the right), the geometry represents an expanding pattern, not a converging one.
The ConvergenceMin parameter (default: 0.10) controls the minimum convergence angle between the two lines. This ensures the wedge is not so shallow that the lines are nearly parallel. Higher values require steeper convergence -- tighter wedges with more compressed energy. Lower values accept gentler convergence angles, producing more patterns but with less defined wedge geometry.
Point 5 Must Approach Line 1-3
Point 5 is the entry point of the pattern, and it must be at or near the trendline drawn through points 1 and 3. The LineTolerance parameter (default: 0.25) controls how far point 5 can deviate from this trendline, measured as a fraction of the overall pattern height. A tolerance of 0.25 means point 5 can be up to 25% of the pattern's price range away from the exact trendline position. Tighter tolerances require point 5 to land almost exactly on the line, while looser tolerances accept point 5 positions that are near but not precisely on the trendline.
Pattern Width Constraints
The pattern must span between MinPatternBars (default: 15) and MaxPatternBars (default: 150) bars in width. This prevents the engine from identifying micro-patterns that span only a few bars (which tend to be noise) or mega-patterns that span hundreds of bars (which may be too slow-developing to trade effectively).
No Fibonacci Ratios
Unlike harmonic patterns that validate through retracement and extension ratios, the Wolfe Wave uses no mathematical relationships between leg lengths. The validation is entirely geometric: convergence direction, convergence angle, point 5 position relative to the trendline, and pattern width. This makes the Wolfe Wave a fundamentally different class of pattern -- one based on trendline slope analysis rather than ratio mathematics.
Figure 2. Lines 1-3 and 2-4 must converge to the right, with point 5 near the line 1-3 extension.
5. The Target Line -- Built-In Profit Target
The target line is the Wolfe Wave's most distinctive feature -- a characteristic that sets it apart from virtually every other chart pattern in technical analysis. While most patterns require traders to calculate take-profit levels using external tools or methods, the Wolfe Wave provides its own profit target as an inherent part of its geometry.
How the Target Line Is Constructed
The target line is drawn from point 1 through point 4, then extended to the right (into the future). These two points -- the first swing point and the fourth -- define a line that projects the expected destination of price after the point 5 reversal. In a bullish Wolfe Wave, this line slopes upward from point 1 through point 4, and price is expected to rise from point 5 toward this ascending target. In a bearish Wolfe Wave, the line slopes downward, and price is expected to fall from point 5 toward this descending target.
Why Points 1 and 4?
The choice of points 1 and 4 is not arbitrary. Point 1 represents the origin of the pattern -- the initial swing that started the entire wedge formation. Point 4 represents the most recent swing in the direction of the expected reversal. The line connecting them captures the underlying trend trajectory that the wedge has been compressing against. When the wedge breaks at point 5, price is expected to "snap back" toward this underlying trajectory.
Practical Usage
After entering a trade at point 5, the target line provides a natural take-profit level. As each new bar forms, the target line extends further to the right, so the exact price level of the target changes with time. Traders typically set their take-profit at the target line's price level projected to a reasonable number of bars in the future. The indicator displays this target line as a DodgerBlue dashed line with ray extension on the chart, making it immediately visible.
The ShowTargetLine parameter (default: true) controls whether the target line is drawn on the chart. When enabled, the dashed blue line extends from the pattern into the future, giving traders an immediate visual reference for their profit objective.
No External Calculations Needed
This built-in profit target eliminates the need to use Fibonacci extensions, measured moves, or other external methods to determine where to take profit. The target is a geometric consequence of the pattern itself -- derived from the same five points that define the entry. This self-contained nature makes the Wolfe Wave an efficient pattern for traders who want both entry and exit defined by a single structure.
6. Why Manual Pattern Scanning Fails
Even experienced wedge traders face three critical operational problems when scanning for Wolfe Wave patterns manually. While the Wolfe Wave does not require ratio calculations like harmonic patterns, the need to assess trendline convergence visually across dozens of charts creates its own set of challenges.
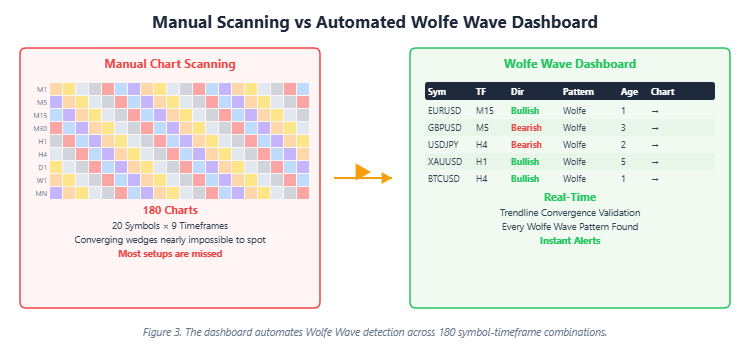
Problem 1: Volume of Chart Combinations
A typical multi-asset trader monitors 20 symbols -- major and minor forex pairs, gold, silver, crypto assets, and indices. With nine available timeframes (M5 through Weekly), that produces 180 possible chart combinations. Scanning each chart for five-point converging wedge patterns requires identifying alternating swing highs and lows, then drawing two trendlines through alternating points and visually assessing whether they converge to the right. At even 40 seconds per chart, a full scan takes two hours -- by which time the majority of the setups you were looking for have already played out or disappeared entirely.
Problem 2: The Trendline Convergence Assessment Problem
The Wolfe Wave's convergence requirement creates a unique challenge for manual scanners. Unlike patterns with clear numerical criteria (such as "B retraces 61.8%"), trendline convergence is a visual assessment. Two lines might appear to converge on a zoomed-out chart but look parallel when zoomed in. The angle of convergence matters -- too shallow and the pattern lacks compression energy; too steep and the pattern may be an artifact of a sharp price move rather than a genuine wedge formation. This subjective element means that two traders looking at the same chart might disagree on whether a valid Wolfe Wave exists. After dozens of these visual assessments across multiple charts, fatigue and inconsistency cause the trader to either misidentify patterns or abandon the scan entirely.
Problem 3: Real-Time Pattern Completion
Wolfe Wave patterns complete when point 5 forms at or near the line 1-3 extension. Because the pattern is based on trendline touches rather than ratio levels, the completion can happen quickly -- price touches the trendline and immediately reverses. In fast-moving markets, the entry window can be just a few candles. If you are scanning EURUSD on the M15 chart when a valid bullish Wolfe Wave completes on XAUUSD H1, you miss the entry entirely. And because the reversal from point 5 is often swift (the compressed wedge energy releasing), late entries significantly degrade your risk-to-reward ratio. There is no way to monitor 180 charts simultaneously with human eyes.
The result is that most wedge traders either limit themselves to a handful of symbols and timeframes (missing the majority of Wolfe Wave setups) or spend so much time scanning that they cannot act on what they find. The scanning process itself becomes the bottleneck, not the strategy.
Figure 3. The dashboard automates Wolfe Wave pattern detection across 180 symbol-timeframe combinations, eliminating the manual scanning bottleneck.
7. Introducing the Wolfe Wave Dashboard
The Wolfe Wave Dashboard is a professional multi-symbol, multi-timeframe indicator that automates the entire Wolfe Wave pattern detection process. Instead of manually scanning 180 charts, drawing trendlines through alternating pivots, and visually assessing convergence angles, you get a single dashboard that continuously monitors all your symbols across all enabled timeframes and alerts you the moment a valid Wolfe Wave pattern completes.
Core Features:
- Automated Wolfe Wave Detection -- Identifies both Bullish (descending wedge) and Bearish (ascending wedge) Wolfe Wave patterns with full trendline convergence validation
- 6-Column Dashboard -- Symbol, Timeframe, Direction, Pattern, Age, and one-click Chart navigation
- Multi-Symbol Scanning -- Monitor up to 20 instruments simultaneously (forex, metals, crypto, indices)
- Multi-Timeframe Coverage -- Scan M5 through W1 (9 timeframes, individually toggleable)
- Non-Repainting Signals -- Patterns are based on confirmed swing pivots with right-bar validation
- Yellow Triangle Fill -- Completed patterns are drawn with filled yellow triangles and labeled 1/2/3/4/5 points
- DodgerBlue Target Line -- Built-in profit target line from point 1 through point 4, extended right
- 4-Channel Alerts -- Popup, sound, email, and push notifications with pattern details
- One-Click Chart Navigation -- Click any dashboard row to open the corresponding chart with full pattern visualization
The indicator handles all the geometric analysis automatically. You configure your symbols, preferred timeframes, and convergence parameters, and the dashboard does the rest -- scanning, drawing trendlines, validating convergence, and alerting in real time.
Download the free demo or purchase the full version:
- MetaTrader 5: Wolfe Wave Dashboard MT5
- MetaTrader 4: Wolfe Wave Dashboard MT4
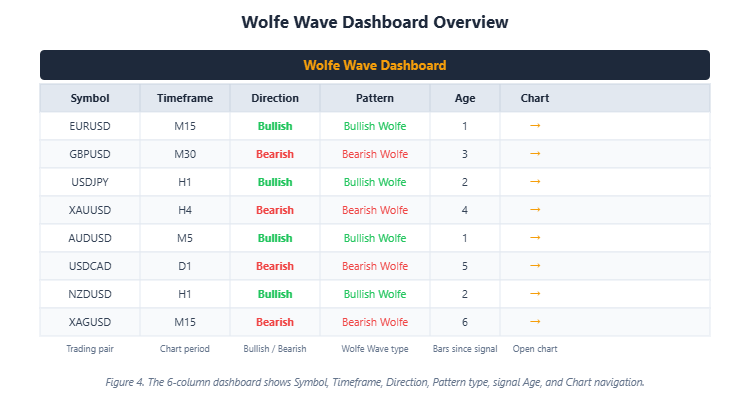
Figure 4. The 6-column dashboard shows every detected Wolfe Wave pattern across all monitored symbols and timeframes.
8. How the Detection Engine Works
The detection engine operates in three stages on every new bar: pivot identification, five-point wedge construction, and convergence validation.
Stage 1: Pivot Identification
The engine first identifies confirmed swing highs and swing lows across the price history. A swing high is a bar whose high is greater than the highs of a specified number of bars to its left and to its right. Similarly, a swing low is a bar whose low is lower than the lows of bars on both sides.
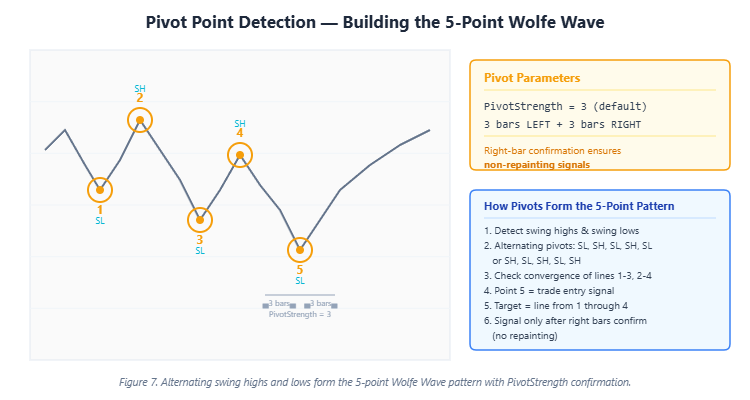
The key parameter is PivotStrength (default: 3), which sets the number of bars required on each side for swing point confirmation. This means a swing high requires 3 bars with lower highs on both the left and right sides before it is confirmed. This right-side confirmation is what makes the signals non-repainting -- a pivot cannot be identified until enough future bars have confirmed it.
Stage 2: Five-Point Wedge Construction
Once pivots are identified, the engine searches for valid five-point alternating sequences:
-
For Bullish Wolfe Wave: it looks for a Low (1), then a subsequent High (2), then a Low (3) that is lower than point 1, then a High (4) that is lower than point 2, then a Low (5) that touches or approaches the line through 1-3. This sequence of declining highs and declining lows forms the descending wedge structure.
-
For Bearish Wolfe Wave: it looks for a High (1), then a subsequent Low (2), then a High (3) that is higher than point 1, then a Low (4) that is higher than point 2, then a High (5) that touches or approaches the line through 1-3. This sequence of rising highs and rising lows forms the ascending wedge structure.
The engine scans up to 300 bars of history (configurable via Max History Bars ) to find the most recent valid pattern for each symbol-timeframe combination.
Stage 3: Convergence Validation
Every candidate pattern is validated against the convergence criteria:
- Draw line through points 1 and 3 (the "outer" trendline of the wedge)
- Draw line through points 2 and 4 (the "inner" trendline of the wedge)
- Verify that these two lines converge to the right -- their slopes must be such that they will intersect at a point in the future
- Verify that the convergence angle meets the minimum threshold ( ConvergenceMin = 0.10)
- Verify that point 5 is within LineTolerance (0.25) of the line 1-3 projection -- confirming the final wedge touch
- Verify that the pattern spans between MinPatternBars (15) and MaxPatternBars (150) bars
Only patterns that pass all convergence checks are displayed on the dashboard. This rigorous geometric validation ensures that every signal represents a genuine converging wedge structure -- not just any random five-point zigzag in price.
Non-Repainting Guarantee
The indicator evaluates only confirmed pivots -- pivots where the required number of right-side bars have already formed. Because point 5 must be a confirmed pivot (with PivotStrength bars to its right), the signal cannot appear until the pattern is fully confirmed. Once displayed, it never changes or disappears.
9. The 6-Column Dashboard
The dashboard presents all detected Wolfe Wave patterns in a compact, scrollable table with six columns:
| Column | Content | Description |
|---|---|---|
| Symbol | e.g., EURUSD | The instrument where the pattern was detected |
| Timeframe | e.g., H1, M15 | The chart timeframe of the pattern |
| Direction | Bullish / Bearish | Green for Bullish (BUY at point 5), Red for Bearish (SELL at point 5) |
| Pattern | Bullish Wolfe / Bearish Wolfe | The pattern type and direction |
| Age | e.g., 3 | Number of bars since the pattern completed |
| Chart | Click to navigate | Opens the corresponding chart for visual confirmation |
The dashboard displays in a separate indicator window below your main chart. It supports scrolling when there are more signals than visible rows (configurable, default 12 rows). Each row is color-coded by direction -- green background tint for Bullish, red for Bearish -- making it easy to scan for the type of setup you want.
Clicking the Chart column on any row switches your main chart to that symbol and timeframe, where the full Wolfe Wave pattern is drawn with yellow triangle fills, numbered 1/2/3/4/5 labels, and a BUY ENTRY or SELL ENTRY arrow at point 5. The trendlines through 1-3 and 2-4 are drawn to show the converging wedge geometry, and the DodgerBlue dashed target line extends from point 1 through point 4 into the future, marking the expected profit destination.
The Age column tells you how fresh each signal is. An age of 1 means the pattern just completed on the most recent confirmed bar. Higher ages indicate older patterns that may still be valid if price has not moved significantly from point 5.
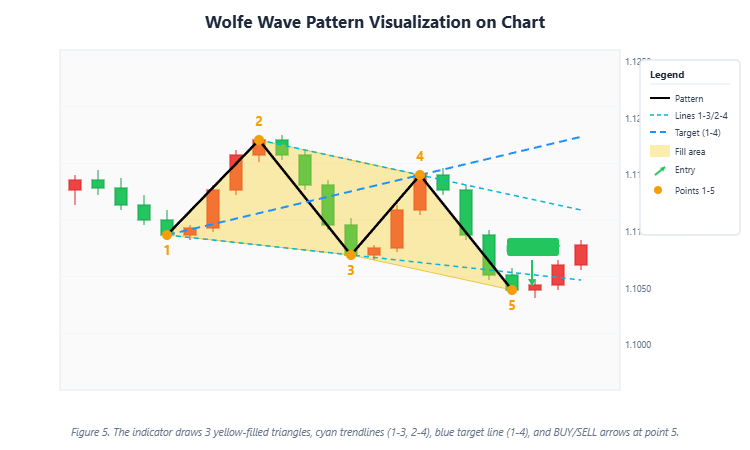
Figure 5. The indicator draws yellow-filled triangles, labels each swing point (1-5), places BUY/SELL arrows at point 5, and extends the DodgerBlue target line from point 1 through point 4.
10. 4-Channel Alert System
The Wolfe Wave Dashboard supports four independent alert channels, any combination of which can be enabled simultaneously:
| Channel | Parameter | Default | Description |
|---|---|---|---|
| Popup | Popup Alert | ON | Standard MetaTrader popup dialog |
| Sound | Sound Alert | ON | Plays a WAV file (default: alert2.wav) |
| Email Alert | OFF | Sends to the email configured in MT4/MT5 settings | |
| Push | Push Alert | ON | Sends to MetaTrader mobile app |
Alert Message Format:
When a new Wolfe Wave pattern is detected, the alert message includes the essential details:
Wolfe Wave Dashboard: EURUSD BULLISH WOLFE WAVE (BUY) pattern on H1
The message tells you the symbol, pattern direction (Bullish or Bearish), the trading action (BUY or SELL), and the timeframe. This gives you enough information to immediately pull up the chart and evaluate the setup.
Alerts fire only once per pattern per symbol-timeframe combination to prevent duplicate notifications. The alert title is configurable via the Alert Title parameter, which defaults to "Wolfe Wave Dashboard".
For email and push notifications to work, you need to configure the respective settings in your MetaTrader terminal options (Tools > Options > Notifications for push, Tools > Options > Email for email).
11. Practical Trading Workflow
Here is a systematic six-step workflow for trading with the Wolfe Wave Dashboard:
Step 1: Setup
Configure the indicator with your preferred symbols (up to 20) and enable the timeframes you trade. Set your convergence parameters based on how strict you want pattern validation to be. Pay particular attention to the ConvergenceMin parameter -- the default 0.10 works well for most instruments. For higher-quality signals on major forex pairs, increase to 0.20. For more pattern detection on volatile instruments like crypto, keep at the default or reduce slightly.
Step 2: Scan
Let the dashboard run. It continuously monitors all symbol-timeframe combinations and populates the table with every valid Wolfe Wave pattern it detects. Fresh patterns appear with low Age values. The trendline convergence validation ensures that every pattern in the table is a geometrically valid converging wedge -- not just a five-point zigzag.
Step 3: Validate the Wedge Geometry
When a new pattern appears (Age = 1 or 2), note the direction. Bullish Wolfe Wave patterns indicate a BUY opportunity at point 5. Bearish Wolfe Wave patterns indicate a SELL opportunity. The dashboard has already validated the trendline convergence, but you can click through to the chart to visually confirm the structure and check that lines 1-3 and 2-4 form a clean converging wedge.
Step 4: Confirm on Chart
Click the Chart column to open the corresponding chart. Verify that the yellow triangles and five labeled points (1, 2, 3, 4, 5) form a clean wedge structure. Check that the lines through 1-3 and 2-4 are clearly converging. Look for additional confluence -- does point 5 align with a support/resistance level, a round number, a moving average, or a higher-timeframe structure? Look at the DodgerBlue target line to assess the potential profit if the reversal plays out. Volume or momentum divergence at point 5 adds further conviction.
Step 5: Enter the Trade
If the pattern passes your visual confirmation:
- For a Bullish Wolfe Wave (BUY): Enter long near point 5. Place your stop loss below point 5 by a buffer (e.g., 1x ATR below point 5). Set take profit at the target line level -- where the line from point 1 through point 4, extended right, intersects the current or near-future time.
- For a Bearish Wolfe Wave (SELL): Enter short near point 5. Place your stop loss above point 5 by a buffer. Set take profit at the target line level on the downside.
Step 6: Manage the Position
Monitor the trade. Wolfe Wave patterns produce reversals from point 5 as price moves away from the wedge and toward the target line. Consider moving your stop to breakeven once price has moved in your favor by 1R (one times your initial risk). The target line provides a natural exit point, and you can trail your stop loss as price progresses toward it. Because the target line extends with time, the exact price level of the target may shift slightly -- monitor it on the chart as the trade develops.
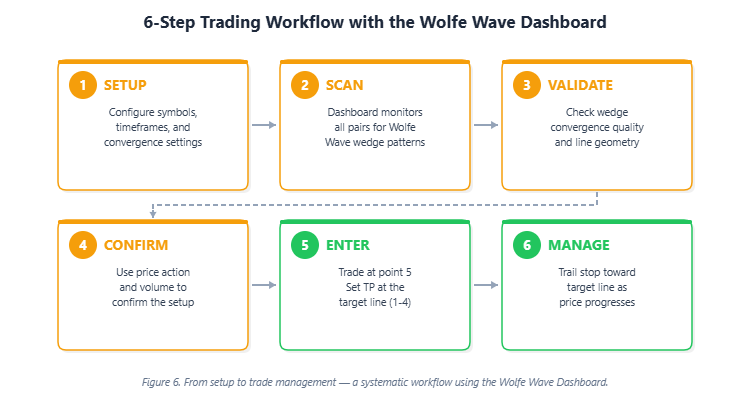
Figure 6. From setup to trade management -- a systematic workflow using the Wolfe Wave Dashboard.
12. Real Trade Examples
The following examples are taken from live charts with the Wolfe Wave Dashboard active. Each screenshot shows the completed pattern with yellow triangle fills, numbered point labels, the DodgerBlue target line, and the dashboard running in the indicator window.
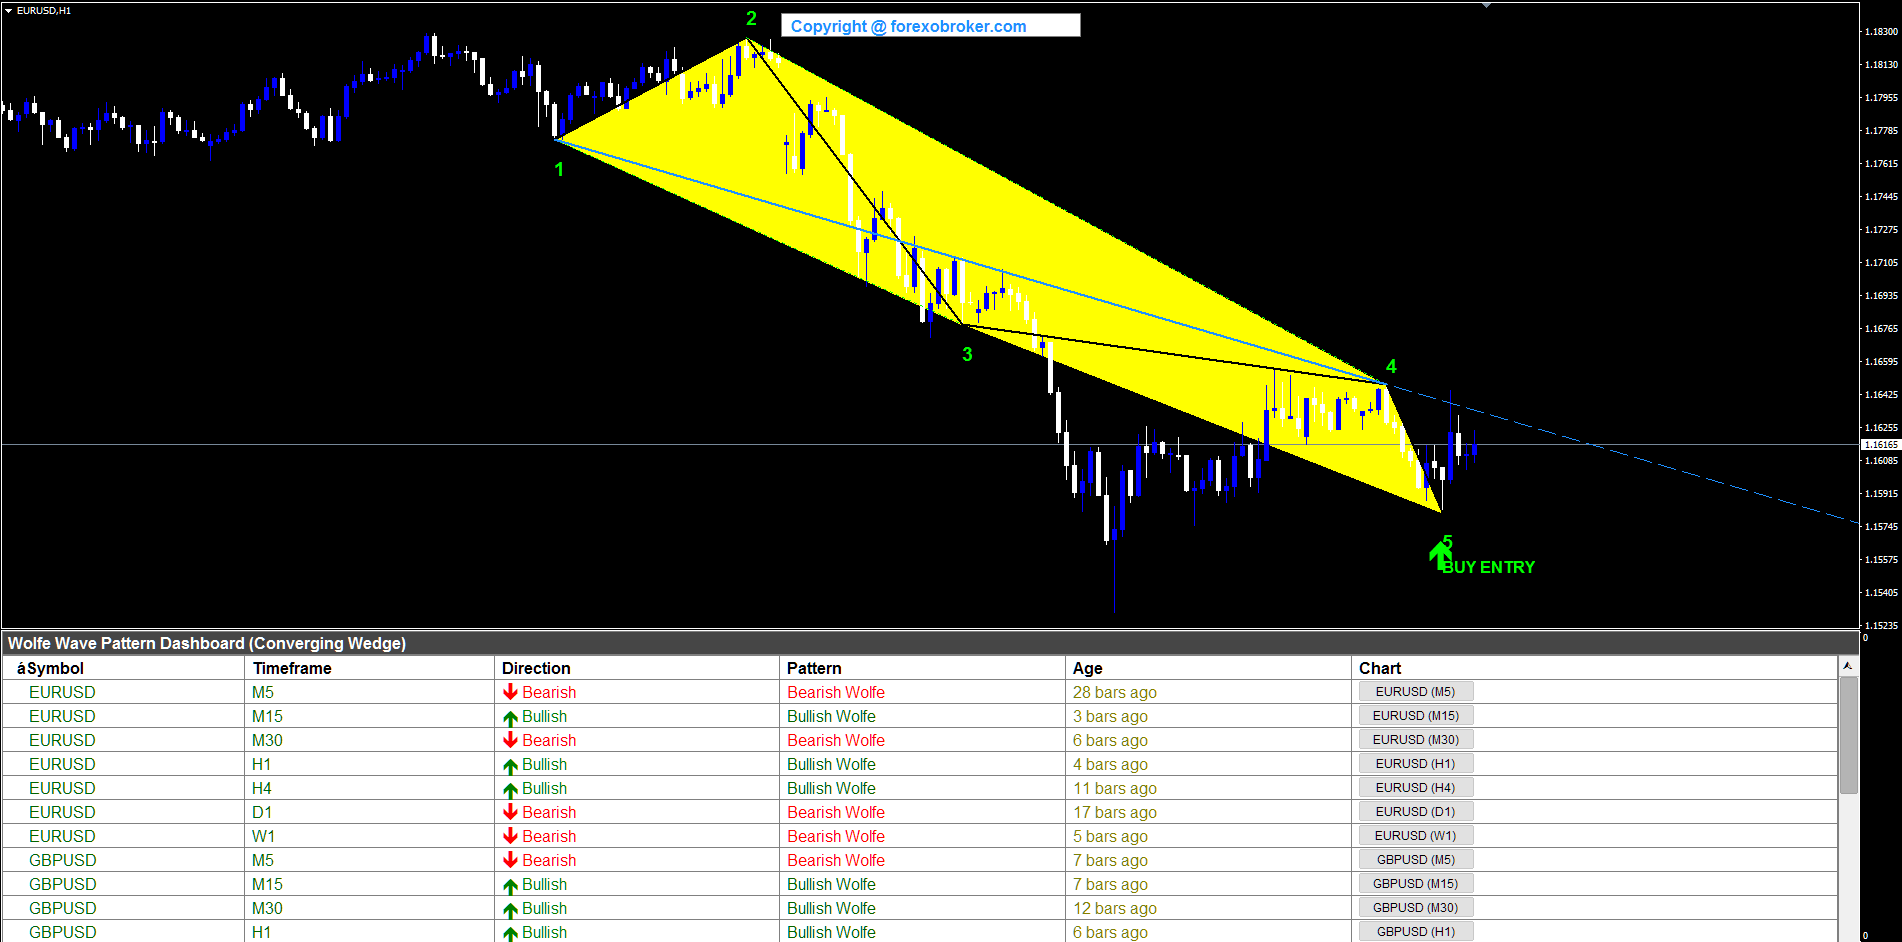
EURUSD H1 -- Bullish Wolfe Wave
EURUSD on the hourly chart produced a bullish Wolfe Wave forming a descending wedge reversal pattern. Points 1 through 5 were clearly visible, with the converging trendlines through 1-3 and 2-4 narrowing downward. The BUY entry appeared at point 5 near 1.1540, where price touched the lower trendline for the final time. The DodgerBlue dashed target line extended from point 1 through point 4 to the right, providing a clear profit objective. The dashboard below displayed multiple Bullish and Bearish Wolfe patterns across EURUSD and GBPUSD timeframes, demonstrating the multi-symbol scanning capability.
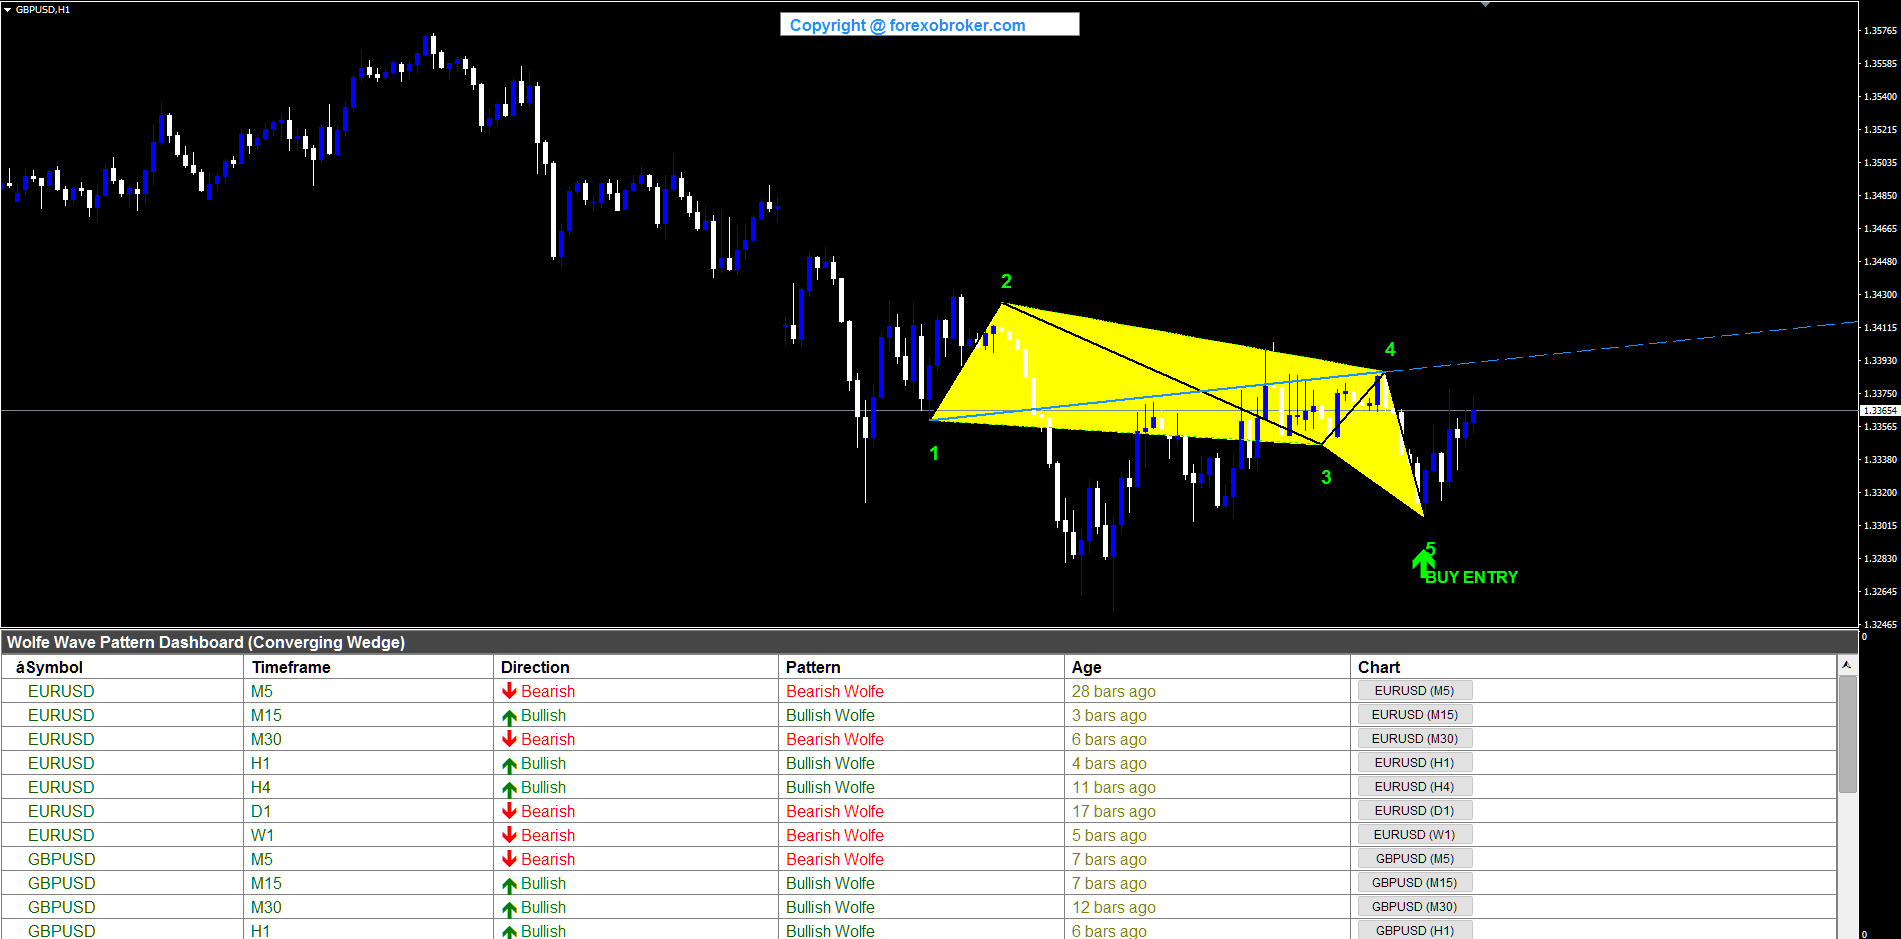
GBPUSD H1 -- Bullish Wolfe Wave
Cable on the hourly chart formed a compact bullish Wolfe Wave with a tightly converging descending wedge. The five points created clean trendline touches, with point 5 sitting precisely on the line 1-3 extension for the BUY entry. The target line extended from point 1 through point 4 to the right, projecting the expected reversal destination. The dashboard showed the same multi-symbol scan results, confirming Wolfe Wave detections across multiple timeframes for both EURUSD and GBPUSD.
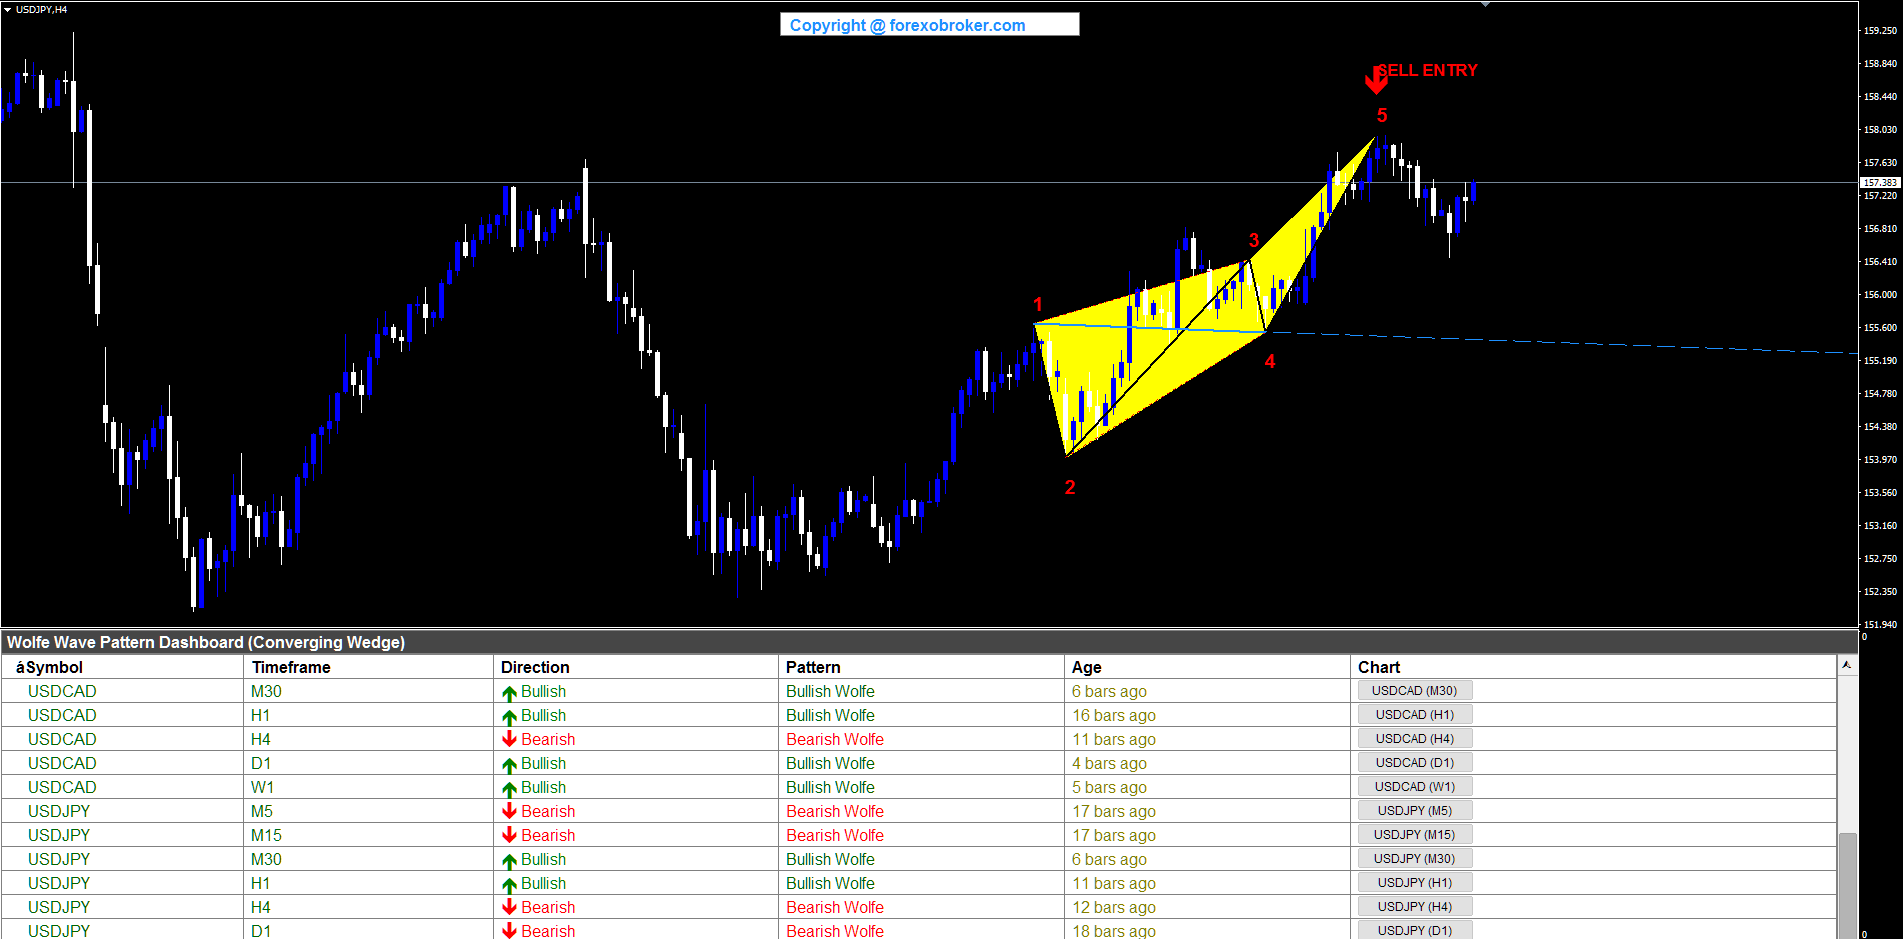
USDJPY H4 -- Bearish Wolfe Wave
The yen pair on the H4 chart produced a bearish Wolfe Wave forming an ascending wedge. Points 1-3 and 2-4 created rising trendlines that converged upward, with point 5 reaching approximately 158 at the upper trendline for the SELL entry. The target line extended from point 1 through point 4 to the right and downward, projecting the expected decline. The dashboard displayed USDCAD and USDJPY scan results, showing the indicator's coverage across yen crosses on the 4-hour timeframe.
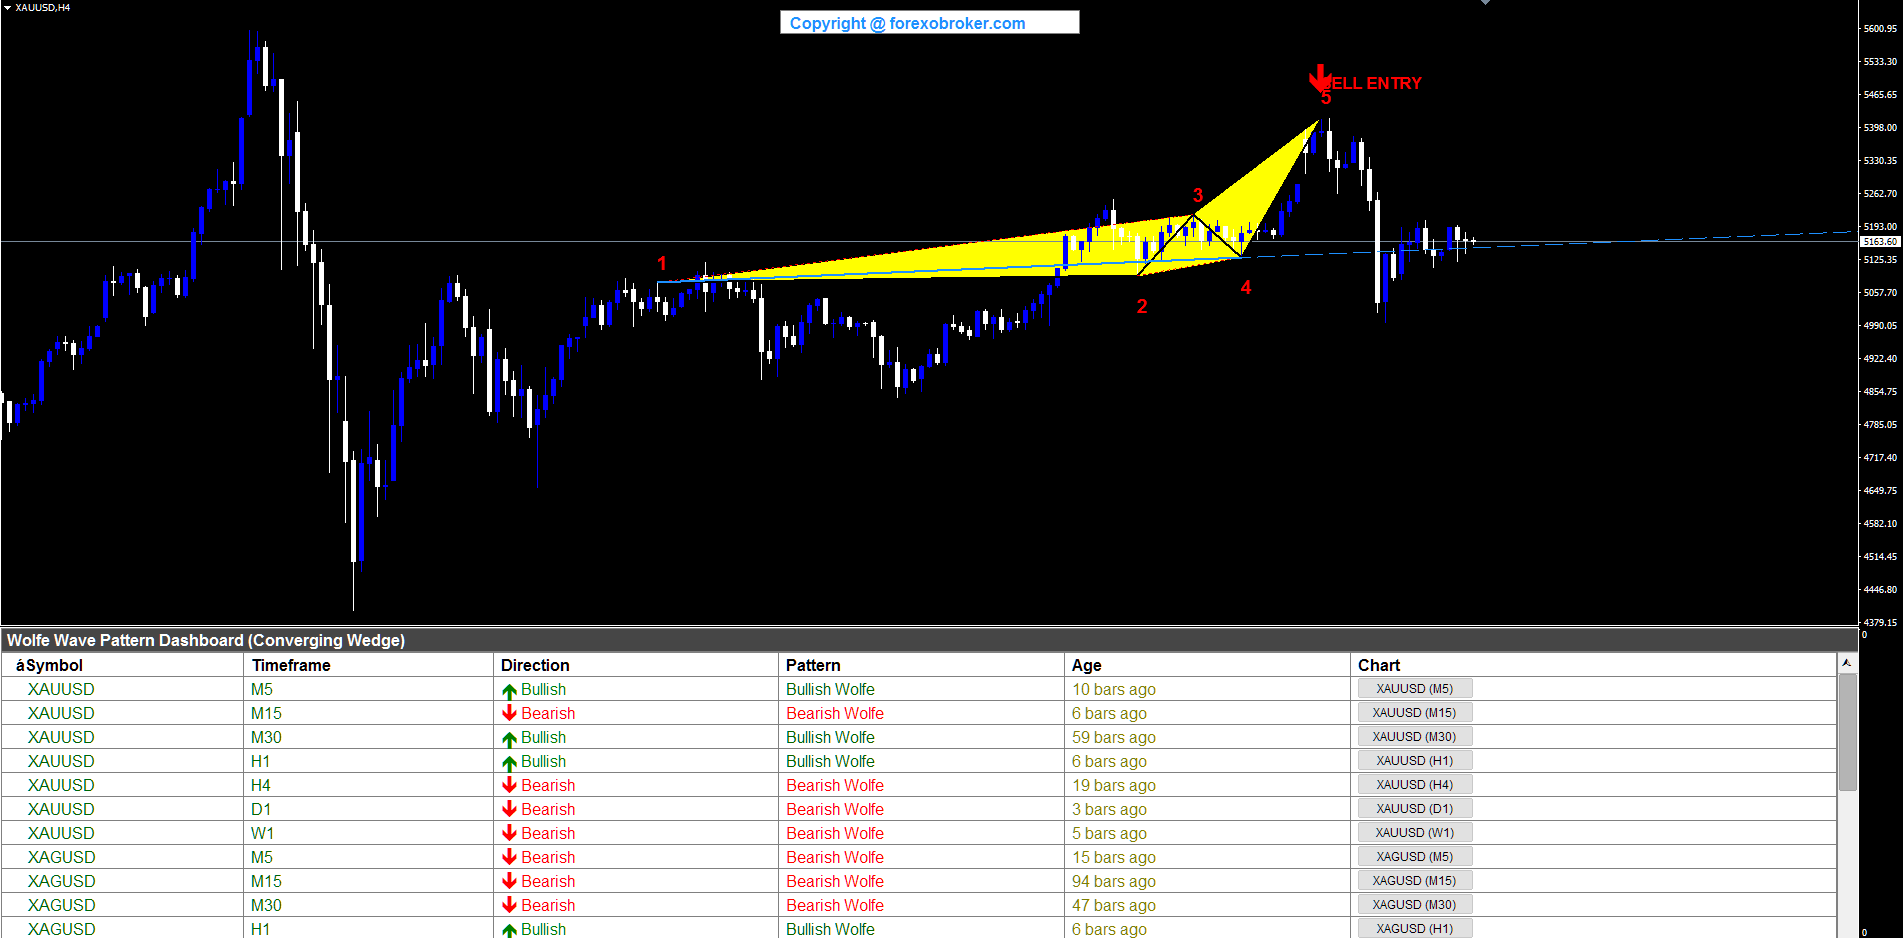
XAUUSD H4 -- Bearish Wolfe Wave (Gold)
Gold on the H4 chart displayed a bearish Wolfe Wave with an ascending wedge spanning a large price range. The five-point structure formed across the 5465 region with point 5 completing at the upper trendline for the SELL entry. The wide price range of the pattern produced visually prominent yellow triangles, and the target line from point 1 through point 4 projected a substantial decline target. The dashboard showed XAUUSD and XAGUSD results, confirming the metals coverage.
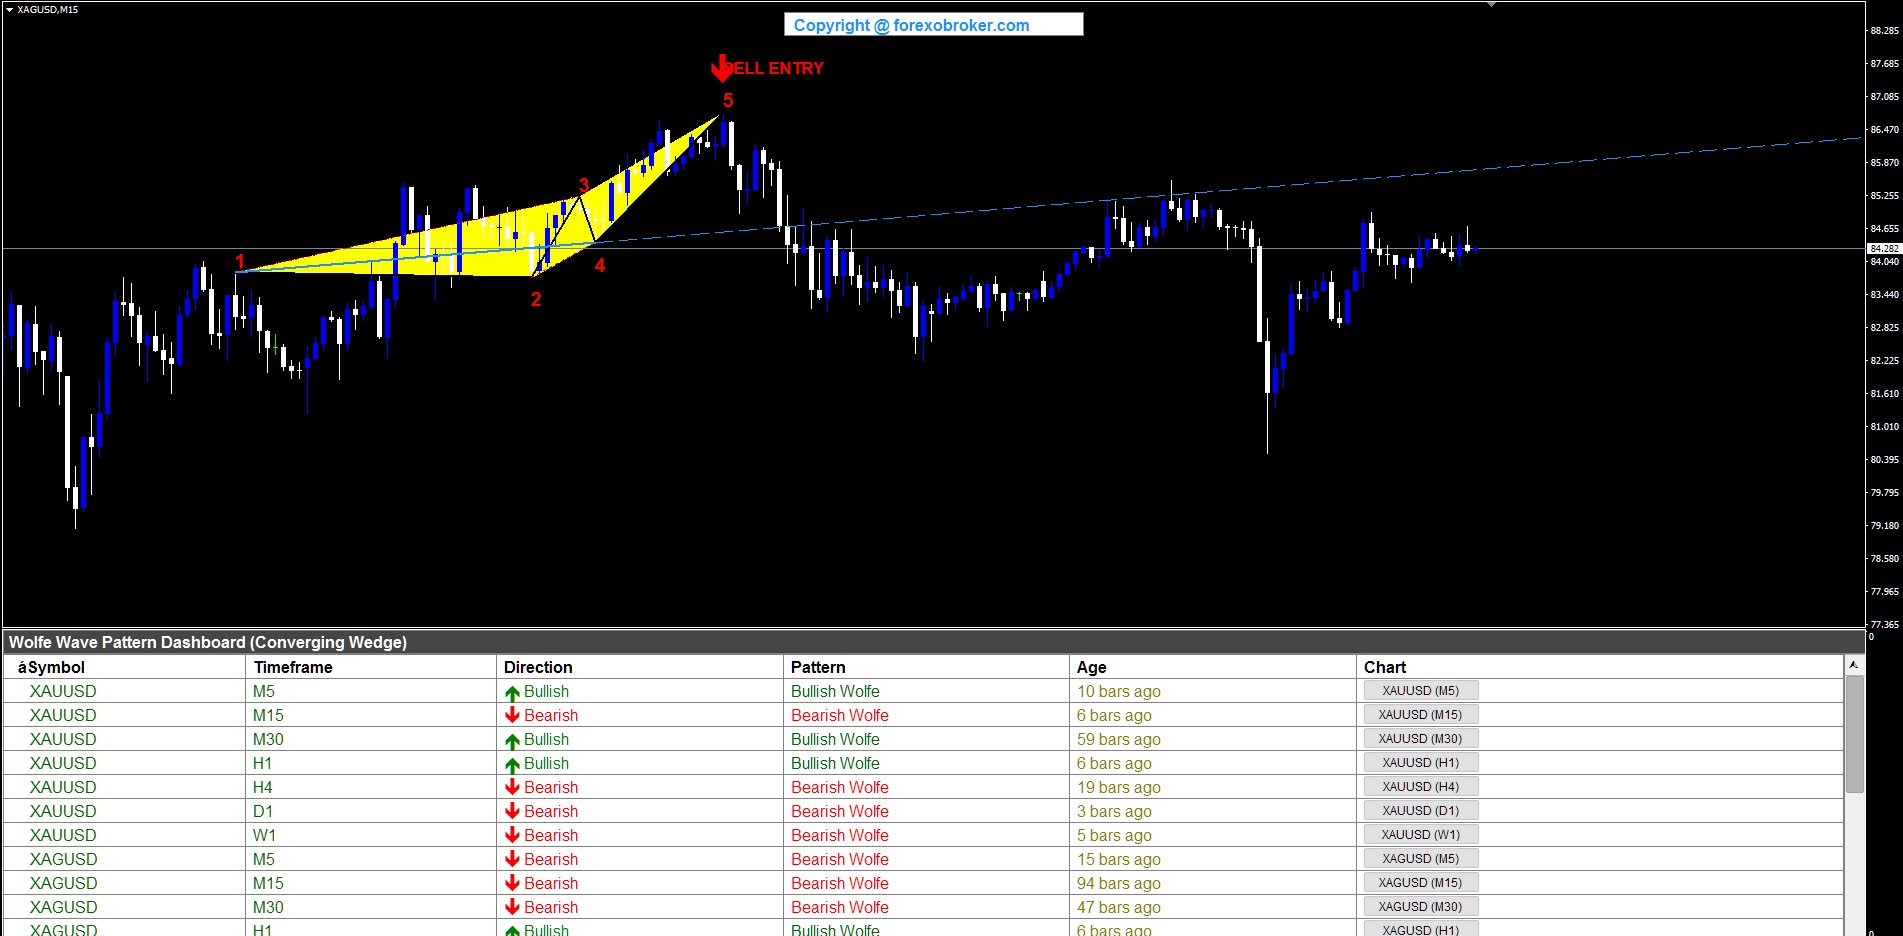
XAGUSD M15 -- Bearish Wolfe Wave (Silver)
Silver on the M15 timeframe formed a compact bearish Wolfe Wave ascending wedge. The SELL entry at point 5 appeared near 87, where price touched the upper converging trendline for the final time. This intraday pattern demonstrated the dashboard's ability to detect Wolfe Wave formations on shorter timeframes across precious metals. The target line projected the expected decline from the point 5 reversal.
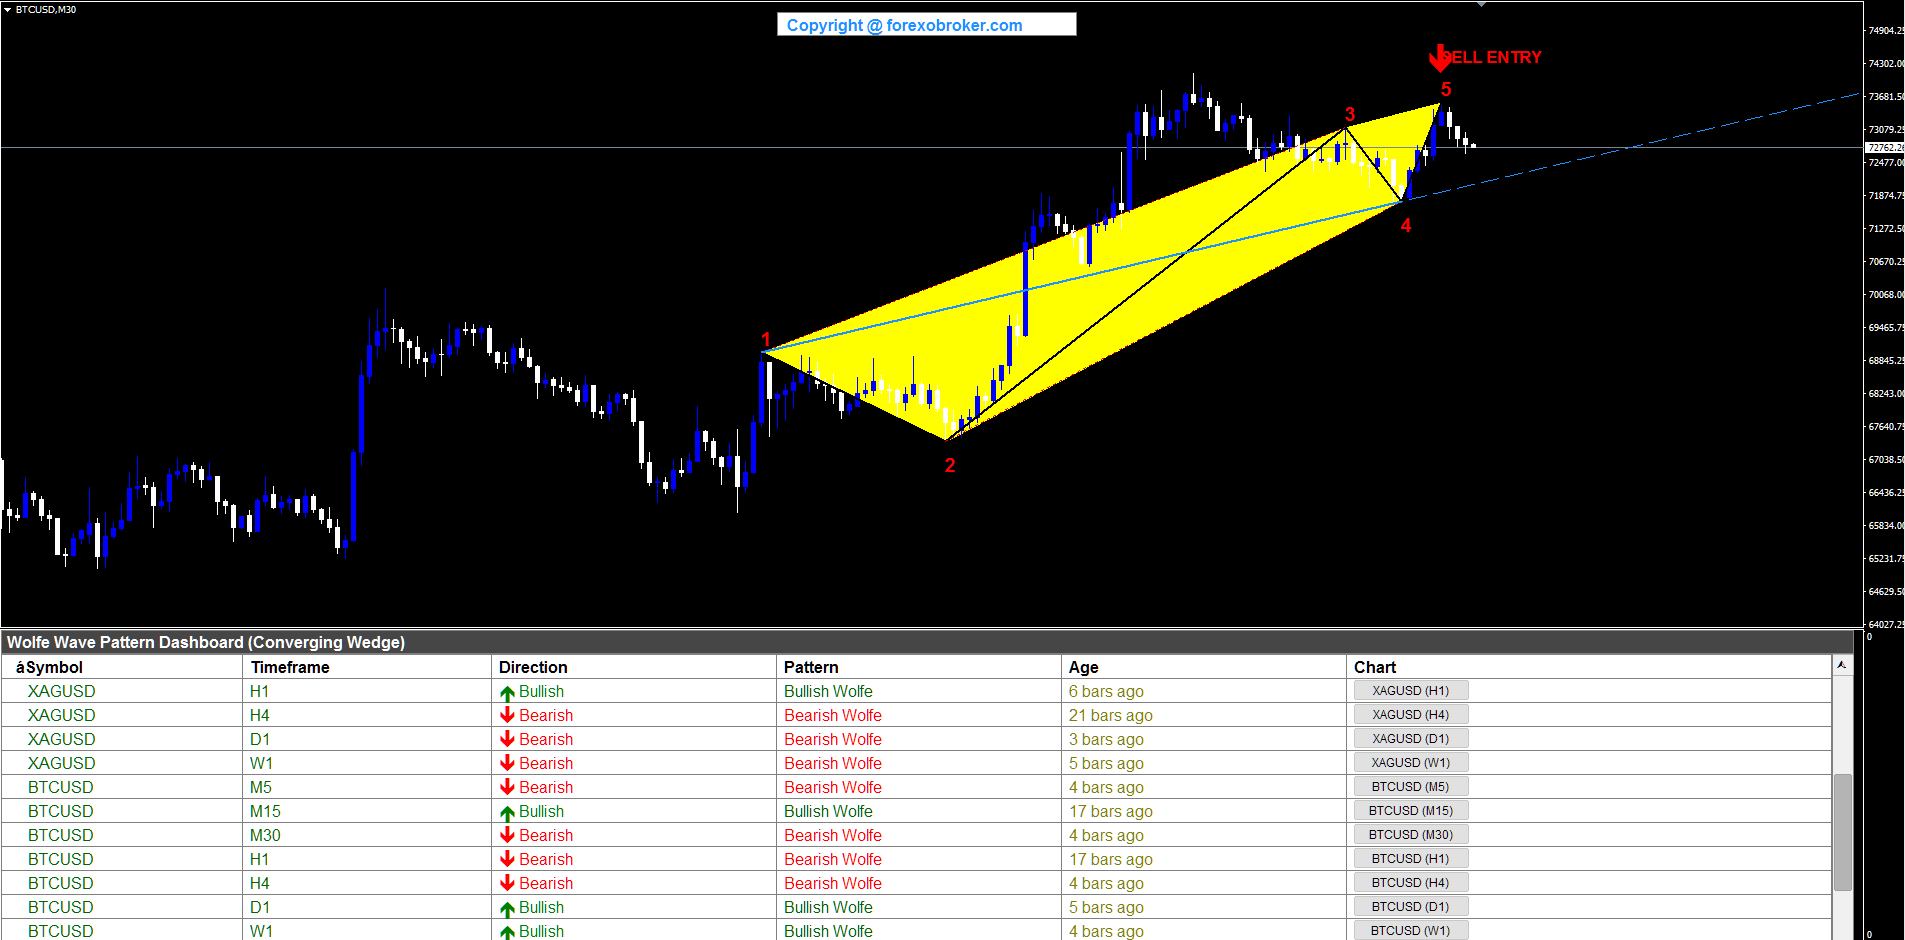
BTCUSD M30 -- Bearish Wolfe Wave (Bitcoin)
Bitcoin on the M30 chart produced a bearish Wolfe Wave with an ascending wedge spanning the 69300-73600 price range. Point 5 completed at the upper trendline for the SELL entry, and the converging trendlines through 1-3 and 2-4 clearly showed the rising wedge geometry. The dashboard displayed BTCUSD scan results across multiple timeframes, demonstrating that the indicator captures cryptocurrency patterns effectively on intraday charts.
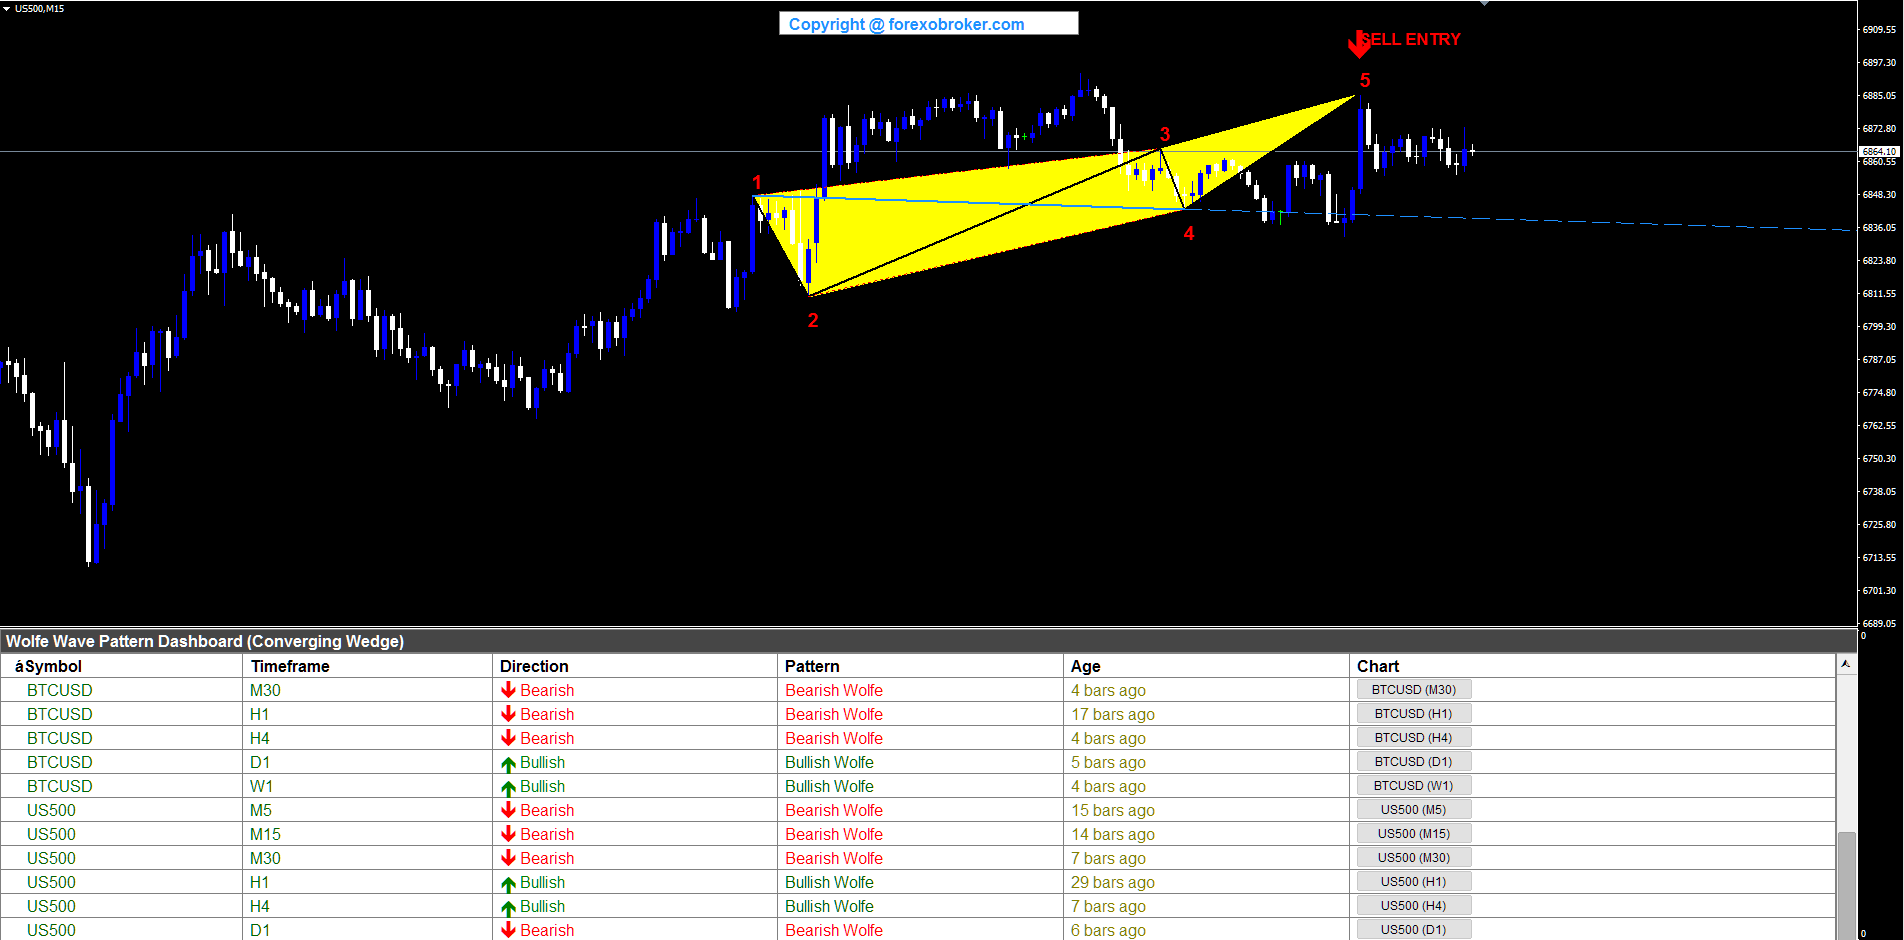
US500 M15 -- Bearish Wolfe Wave (S&P 500)
The S&P 500 index on the M15 chart showed a bearish Wolfe Wave ascending wedge spanning the 6836-6897 range. Point 5 completed at the upper trendline for the SELL entry, and the convergence between lines 1-3 and 2-4 was clearly visible. The dashboard displayed index coverage alongside cryptocurrency results, confirming the multi-asset class scanning capability across US equity indices.
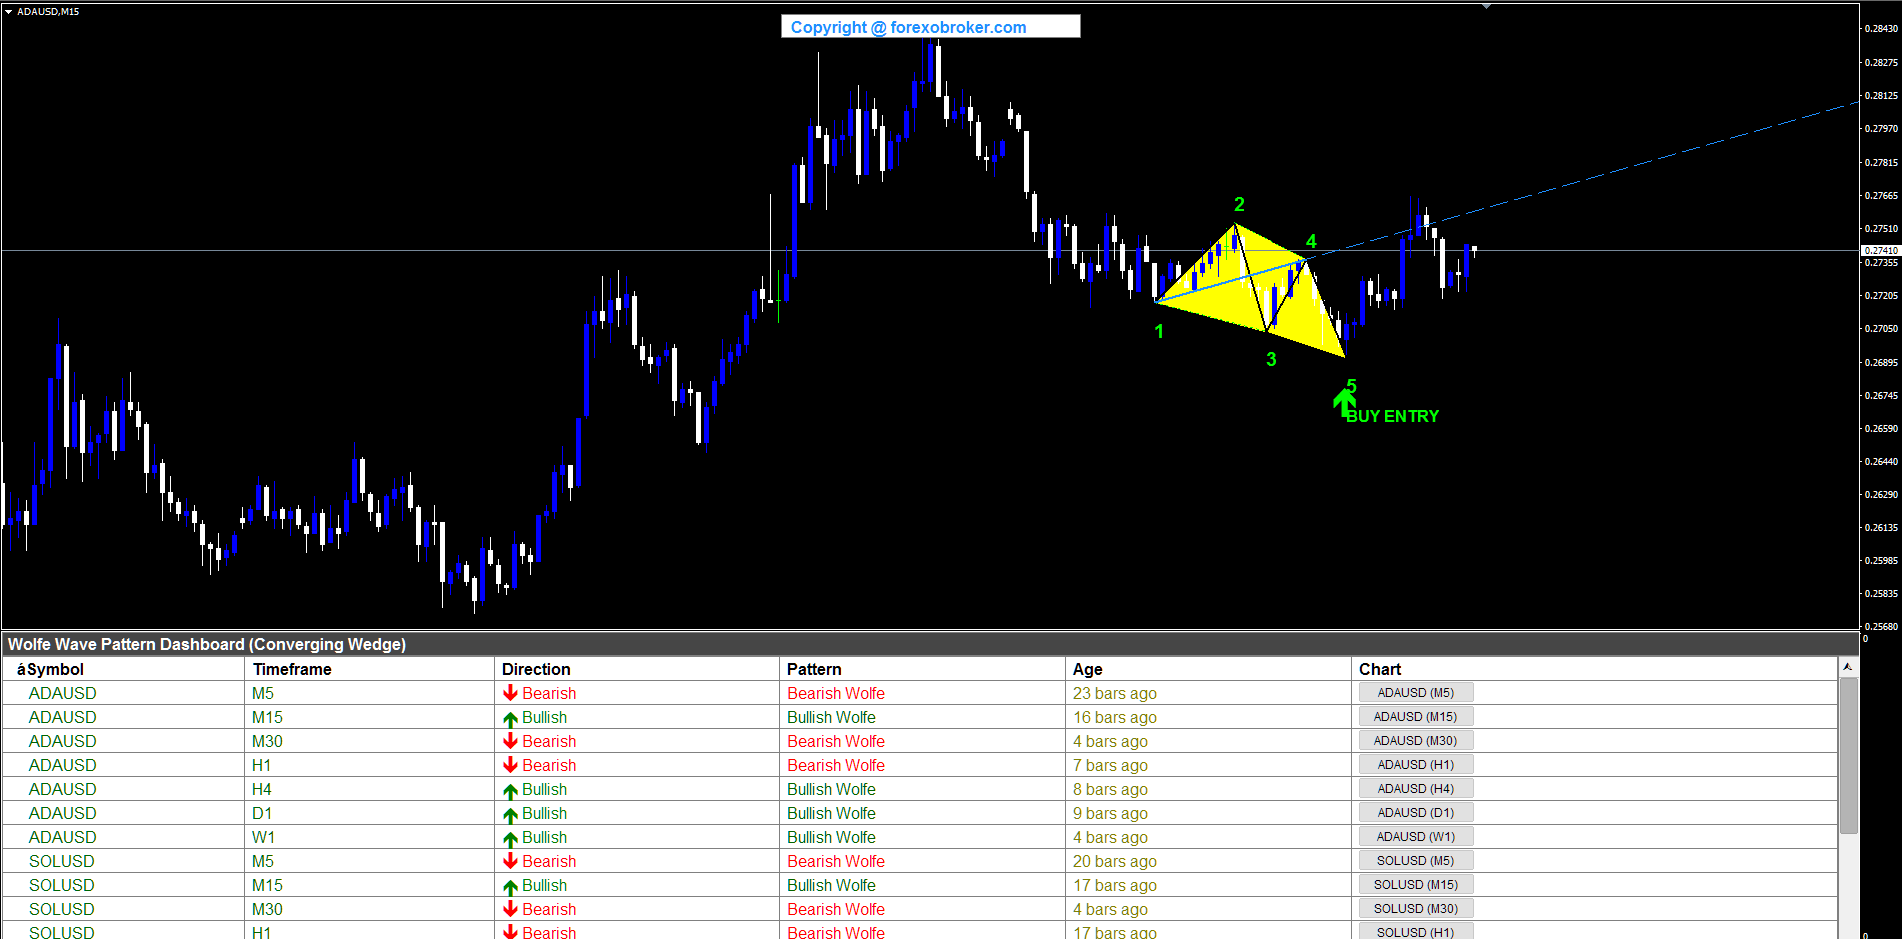
ADAUSD M15 -- Bullish Wolfe Wave (Cardano)
Cardano on the M15 timeframe produced a bullish Wolfe Wave with a descending wedge formation. The BUY entry appeared at point 5 near 0.2680, where price touched the lower converging trendline. The target line from point 1 through point 4 projected an upward target. The dashboard showed ADAUSD and SOLUSD crypto coverage, demonstrating the indicator's effectiveness on altcoin pairs at shorter timeframes.
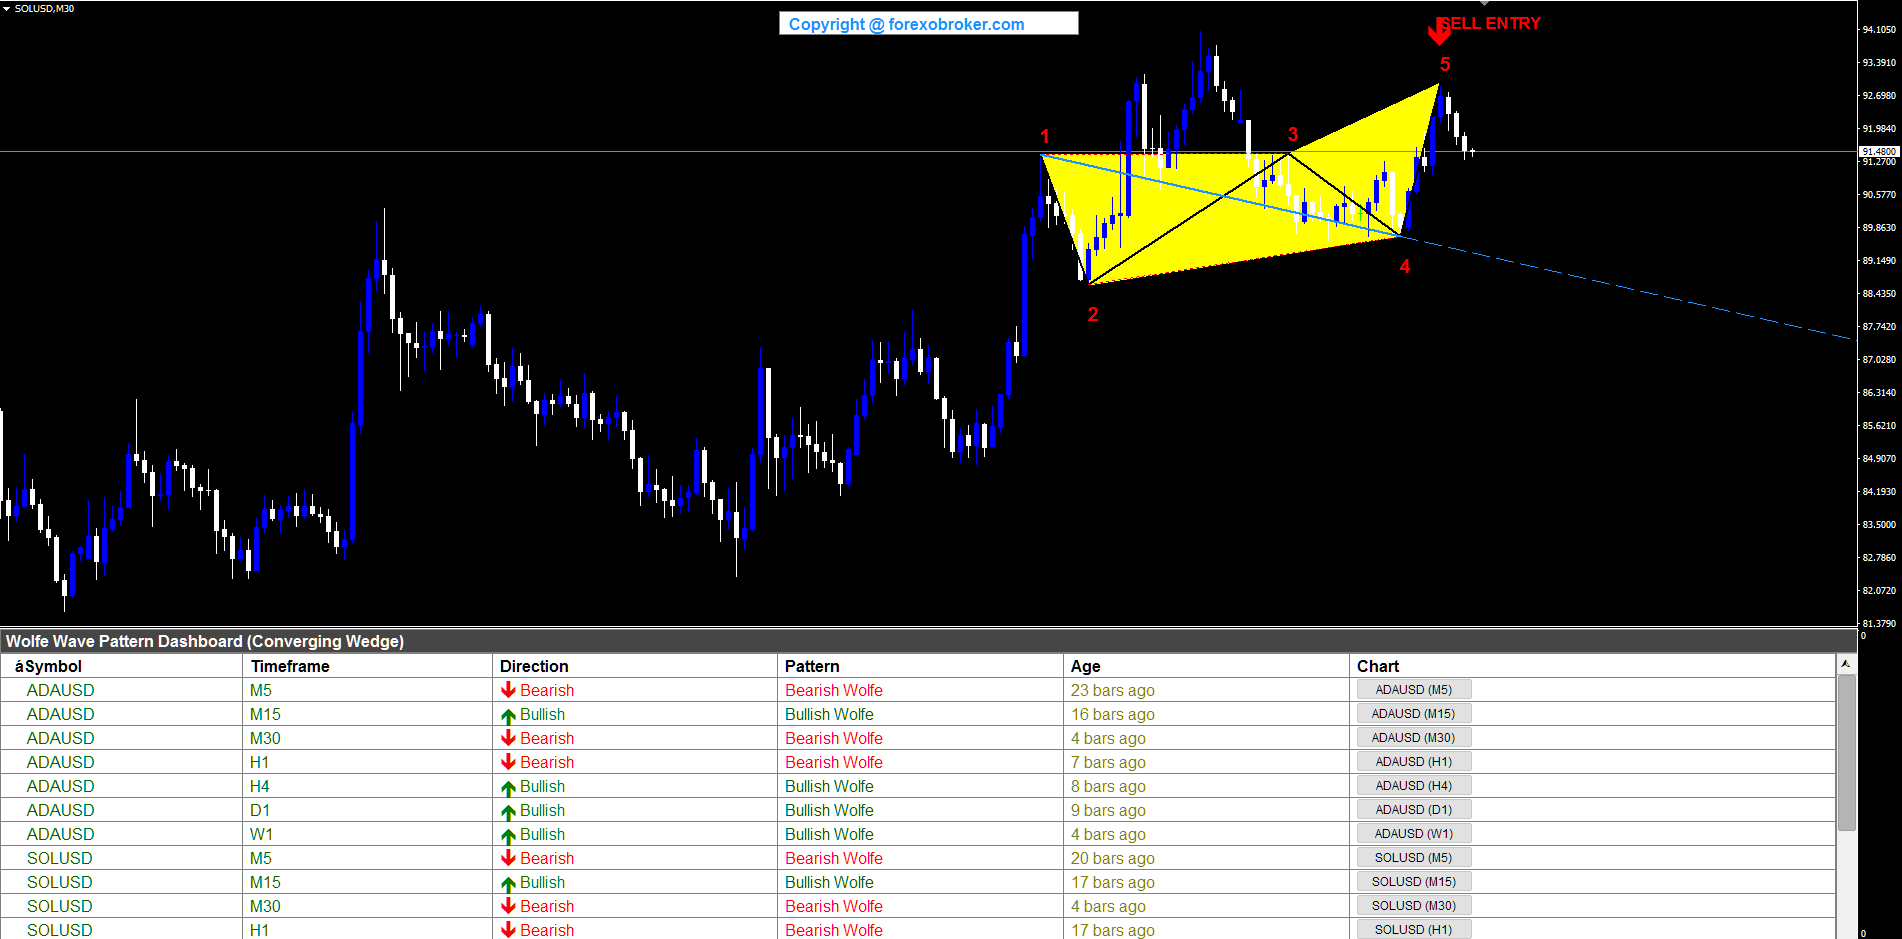
SOLUSD M30 -- Bearish Wolfe Wave (Solana)
Solana on the M30 chart displayed a bearish Wolfe Wave ascending wedge in the 88-93 price range. Point 5 completed at the upper trendline for the SELL entry, with the converging trendlines showing clear ascending wedge geometry. The target line projected the expected decline from the point 5 reversal. The dashboard confirmed crypto altcoin coverage alongside other asset classes, demonstrating the indicator's breadth across the cryptocurrency market.
13. Pivot & Convergence Tuning Guide
The Wolfe Wave Dashboard provides several parameters for fine-tuning pattern detection to match your trading style and the instruments you trade.
Pivot Sensitivity
| Style | PivotStrength | Effect |
|---|---|---|
| Aggressive | 2 | More patterns detected, smaller swing points, faster signals on short timeframes |
| Default | 3 | Balanced detection -- suitable for most instruments and timeframes |
| Conservative | 5 | Fewer patterns, only major swing points qualify, higher confidence signals |
For scalping on M5-M15, consider reducing PivotStrength to 2 for faster pattern detection. For swing trading on H4-D1, the default 3 or a setting of 5 gives higher-quality patterns based on significant swing points.
Wedge Geometry Tuning
| Style | LineTolerance | ConvergenceMin | Effect |
|---|---|---|---|
| Strict | 0.10 | 0.20 | Tighter wedges only, point 5 must be very close to the trendline. Fewer but higher quality patterns |
| Default | 0.25 | 0.10 | Balanced detection -- accepts reasonable wedge geometry |
| Relaxed | 0.40 | 0.05 | Wider wedges accepted, point 5 can be further from trendline. More patterns but looser geometry |
Strict settings tighten the LineTolerance to 0.10 and increase ConvergenceMin to 0.20. This filters for near-perfect converging wedge patterns where point 5 sits almost exactly on the line 1-3 extension and the two defining trendlines converge at a significant angle. You will see fewer signals, but each one represents a tightly compressed wedge with strong reversal potential. Use this approach for major forex pairs on higher timeframes where price tends to form clean geometric structures.
Default settings use a LineTolerance of 0.25 and ConvergenceMin of 0.10. This accommodates the natural imprecision of real markets while still requiring clear trendline convergence and reasonable point 5 positioning. This is recommended for most traders starting out with the indicator.
Relaxed settings cast a wider net with LineTolerance at 0.40 and ConvergenceMin at 0.05. You will see more patterns, but some will have looser wedge geometry. The wider LineTolerance allows point 5 positions that are further from the ideal trendline touch. Use this when scanning instruments with irregular price behavior (crypto assets, exotic currency pairs) where patterns tend to be less geometrically precise.
Figure 7. Pivot points require confirmation bars on each side, ensuring patterns are based on confirmed swings rather than noise.
14. Parameter Reference
Dashboard Settings
| Parameter | Default | Description |
|---|---|---|
| Symbols | EURUSD,GBPUSD,USDCAD,USDJPY | Comma-separated list of symbols to monitor (up to 20) |
| Symbol Prefix | (empty) | Broker prefix, e.g., "m" for mEURUSD |
| Symbol Suffix | (empty) | Broker suffix, e.g., ".pro" for EURUSD.pro |
| Enable M1 | false | Toggle M1 timeframe scanning |
| Enable M5 | true | Toggle M5 timeframe scanning |
| Enable M15 | true | Toggle M15 timeframe scanning |
| Enable M30 | true | Toggle M30 timeframe scanning |
| Enable H1 | true | Toggle H1 timeframe scanning |
| Enable H4 | true | Toggle H4 timeframe scanning |
| Enable D1 | true | Toggle D1 timeframe scanning |
| Enable W1 | true | Toggle W1 timeframe scanning |
| Enable MN | false | Toggle Monthly timeframe scanning |
| Visible Rows | 12 | Number of rows displayed in the dashboard |
Wolfe Wave Settings
| Parameter | Default | Description |
|---|---|---|
| Pivot Strength | 3 | Bars on each side for swing point confirmation |
| Max Pattern Bars | 150 | Maximum pattern width in bars |
| Min Pattern Bars | 15 | Minimum pattern width in bars |
| Max History Bars | 300 | How far back to search for patterns |
| Line Tolerance | 0.25 | How far point 5 can be from line 1-3 (as fraction of pattern height) |
| Convergence Min | 0.10 | Minimum convergence angle between lines 1-3 and 2-4 |
Chart Display Settings
| Parameter | Default | Description |
|---|---|---|
| Show Pattern | true | Draw pattern on current chart |
| Show Arrows | true | Show BUY/SELL entry arrows at point 5 |
| Show Labels | true | Show point number labels (1-5) |
| Show Target Line | true | Draw target line from point 1 through point 4 |
| Bullish Color | Lime | Color for bullish patterns |
| Bearish Color | Red | Color for bearish patterns |
| Pattern Fill | Yellow | Triangle fill color |
| Line Color | Black | Pattern line color |
| Target Color | DodgerBlue | Target line color |
| Arrow Size | 4 | Entry arrow size (1-5) |
| Arrow Gap | 0.8 | Gap between arrow and price (ATR multiplier) |
Alert Settings
| Parameter | Default | Description |
|---|---|---|
| Alert Title | Wolfe Wave Dashboard | Title for alert messages |
| Popup Alert | true | Show MetaTrader popup dialog |
| Sound Alert | true | Play alert sound |
| Sound File | alert2.wav | Custom WAV sound file |
| Email Alert | false | Send email notification |
| Push Alert | true | Send mobile push notification |
15. Conclusion
The Wolfe Wave pattern is one of the most elegant reversal structures in technical analysis -- a converging wedge formation that identifies the point where a trend's momentum is exhausted and provides a built-in target line for the expected reversal. Developed by Bill Wolfe in the 1990s and grounded in the principle that every price action produces an equal and opposite reaction, the Wolfe Wave stands apart from other chart patterns through its purely geometric validation. There are no Fibonacci ratios to calculate, no extension levels to check -- only trendline convergence, five confirmed swing points, and the natural target line from point 1 through point 4 that defines the profit destination.
The challenge has always been operational. Identifying five-point converging wedge patterns that satisfy trendline convergence requirements across a full watchlist of 20 symbols and nine timeframes requires continuous visual assessment and geometric validation that exceeds what any manual scanning process can deliver. The cognitive load of drawing trendlines through alternating pivots, assessing convergence angles, and confirming point 5 positioning across 180 chart combinations makes comprehensive Wolfe Wave pattern scanning humanly impossible to do consistently.
The Wolfe Wave Dashboard automates this entire process. It identifies confirmed swing pivots, constructs five-point wedge candidates in both bullish (descending wedge) and bearish (ascending wedge) orientations, validates them against trendline convergence criteria with configurable tolerances, and presents every valid pattern in a clean six-column dashboard with real-time alerts across four channels. The non-repainting design ensures that every signal is based on confirmed price structure, and the yellow triangle fills with the DodgerBlue target line make pattern identification and profit targeting immediate and intuitive.
Whether you trade forex, metals, crypto, or indices -- and whether you scalp on M5 or swing trade on the Daily -- the dashboard adapts to your watchlist and timeframe preferences. Configure it once, and let it scan continuously while you focus on evaluating setups and managing trades.
Try the free demo or get the full version on the MQL5 Market:
- MetaTrader 5: Wolfe Wave Dashboard MT5
- MetaTrader 4: Wolfe Wave Dashboard MT4


")