
Graphical Interfaces XI: Integrating the Standard Graphics Library (build 16)
Contents
- Introduction
- Changes in the library scheme
- Application for testing the properties of the chart
- Application for testing the properties of the chart curves
- Application with an animated hypocycloid chart
- New version of the test application from previous updates
- Conclusion
Introduction
The first article Graphical Interfaces I: Preparation of the Library Structure (Chapter 1) explains in detail what this library is for. You will find a list of articles with links at the end of each chapter. There, you can also download a complete version of the library at the current stage of development. Files must be placed under the same directories as they are located in the archive.
The second chapter of the ninth part of the series, Graphical Interfaces IX: The Progress Bar and Line Chart Controls (Chapter 2), demonstrated an example of how a class for creating line charts can be integrated into the library. That was a temporary solution, as the capabilities of this part of the library were sorely lacking. A new version of the graphics library for creating scientific charts (the CGraphic class) has been presented recently. Description of some functions of this class have been presented in Visualize this! MQL5 graphics library similar to 'plot' of R language. This update of the developed library for creating graphical interfaces will introduce a version with a new control for creating charts. Now it is even easier to visualize data of different types.
Changes in the library scheme
Earlier, the developed library had used a copy of the CCanvas class designed for drawing. Due to recent global refactoring of the library's code, this copy is no longer needed and it can be removed by replacing it with the original version from the standard library. This reduced the volume of the library by approximately 10% and almost by 40% relative to the version presented before the refactoring in the articles Graphical Interfaces XI: Refactoring the Library code (build 14.1) and Graphical Interfaces XI: Rendered controls (build 14.2).
The CGraphic class will now be used for creating charts, therefore, include the Graphic.mqh file in the Objects.mqh file. Since the file with the CCanvas class is already included in one of the files included in the Graphic.mqh file, it also becomes available to the entire library.
//+------------------------------------------------------------------+
//|                                                      Objects.mqh |
//|                        Copyright 2015, MetaQuotes Software Corp. |
//|                                             https://www.mql5.com |
//+------------------------------------------------------------------+
#include "Enums.mqh"
#include "Defines.mqh"
#include "Fonts.mqh"
#include "Colors.mqh"
#include <Graphics\Graphic.mqh>
#include <ChartObjects\ChartObjectSubChart.mqh>
...
The CLineChart class has been renamed to CGraph. Its internal content has also been changed. Now this class contains only the methods for managing the general properties and states of the control.
class CGraph : public CElement
  {
public:
   //--- Handler of chart events
   virtual void      OnEvent(const int id,const long &lparam,const double &dparam,const string &sparam);
   //--- Moving the control
   virtual void      Moving(const bool only_visible=true);
   //--- Management
   virtual void      Show(void);
   virtual void      Hide(void);
   virtual void      Reset(void);
   virtual void      Delete(void);
   //--- Apply the latest changes
   virtual void      Update(const bool redraw=false);
   //---
private:
   //--- Resizing
   void              Resize(const int width,const int height);
   //--- Change the width at the right edge of the window
   virtual void      ChangeWidthByRightWindowSide(void);
   //--- Change the height at the bottom edge of the window
   virtual void      ChangeHeightByBottomWindowSide(void);
  };
The chart properties can be controlled by using the CGraphic::GetGraphicPointer() method to obtain the pointer to an instance of the CGraphic class:
class CGraph : public CElement
  {
private:
   //--- Objects for creating the control
   CGraphic          m_graph;
   //---
public:
   //--- Returns the pointer to the chart
   CGraphic         *GetGraphicPointer(void) { return(::GetPointer(m_graph)); }
  };
Additional classes have been included in the CGraphic class for managing the properties of the axes (CAxis) and curves (CCurve) of the chart. The CColorGenerator class is designed for generating the curve colors. All these classes are contained in separate files included in the Graphic.mqh file:
//+------------------------------------------------------------------+
//|                                                      Graphic.mqh |
//|                   Copyright 2016-2017, MetaQuotes Software Corp. |
//|                                             https://www.mql5.com |
//+------------------------------------------------------------------+
#include <Arrays\ArrayObj.mqh>
#include "Curve.mqh"
#include "Axis.mqh"
#include "ColorGenerator.mqh"
...
The file with the CCanvas class is included in the Curve.mqh file, and from here it will be available in the entire library.
//+------------------------------------------------------------------+
//|                                                        Curve.mqh |
//|                   Copyright 2016-2017, MetaQuotes Software Corp. |
//|                                             https://www.mql5.com |
//+------------------------------------------------------------------+
#include <Object.mqh>
#include <Canvas\Canvas.mqh>
...
All the above interconnections between the files and classes are shown in the figure below:
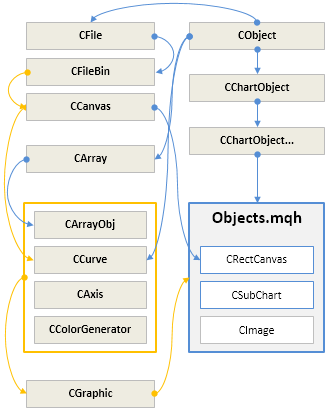
Fig. 1. Interconnections between the standard and developed library classes.
Thus, the classes of the standard library for working with arrays and files become automatically available for the library and files of the application it is used in. Several test MQL applications will be demonstrated further in the article to help understand what new features are now available.
Application for testing the properties of the chart
The first test MQL application will implement a graphical interface with controls for managing certain properties of a CGraphic type chart. A control of the CTabs type is located at the top of the form. In this case, it is a group of four tabs. A chart with two curves with randomly generated values will be located below the working area of the tabs.
The first tab (Background) will have the controls for managing the following chart properties:
- Background color.
- The main text of the chart (displayed at the top).
- Auxiliary text of the chart (displayed at the bottom).
- Color of the main text.
- Color of the auxiliary text.
- Font size of the main text.
- Font size of the auxiliary text.
To set and get these properties, the CGraphic class provides the corresponding public methods:
//+------------------------------------------------------------------+
//| Structure CBackground                                            |
//| Usage: background on a two-dimensional graphics                  |
//+------------------------------------------------------------------+
struct CBackground
  {
   uint              clr;
   uint              clr_main;
   uint              clr_sub;
   string            main;
   string            sub;
   int               size_main;
   int               size_sub;
  };
//+------------------------------------------------------------------+
//| Class CGraphic                                                   |
//| Usage: class for drawing two-dimensional graphics                |
//+------------------------------------------------------------------+
class CGraphic
  {
protected:
   //--- element of graphic
   CBackground       m_background;           // background
   //---
public:
   //--- gets the background properties
   uint              BackgroundColor(void)       const { return(m_background.clr);       }
   uint              BackgroundMainColor(void)   const { return(m_background.clr_main);  }
   uint              BackgroundSubColor(void)    const { return(m_background.clr_sub);   }
   string            BackgroundMain(void)        const { return(m_background.main);      }
   string            BackgroundSub(void)         const { return(m_background.sub);       }
   int               BackgroundMainSize(void)    const { return(m_background.size_main); }
   int               BackgroundSubSize(void)     const { return(m_background.size_sub);  }
   //--- sets the background properties
   void              BackgroundColor(const uint clr)      { m_background.clr=clr;        }
   void              BackgroundMainColor(const uint clr)  { m_background.clr_main=clr;   }
   void              BackgroundSubColor(const uint clr)   { m_background.clr_sub=clr;    }
   void              BackgroundMain(const string main)    { m_background.main=main;      }
   void              BackgroundSub(const string sub)      { m_background.sub=sub;        }
   void              BackgroundMainSize(const int size)   { m_background.size_main=size; }
   void              BackgroundSubSize(const int size)    { m_background.size_sub=size;  }
  };
This is how it looks like:
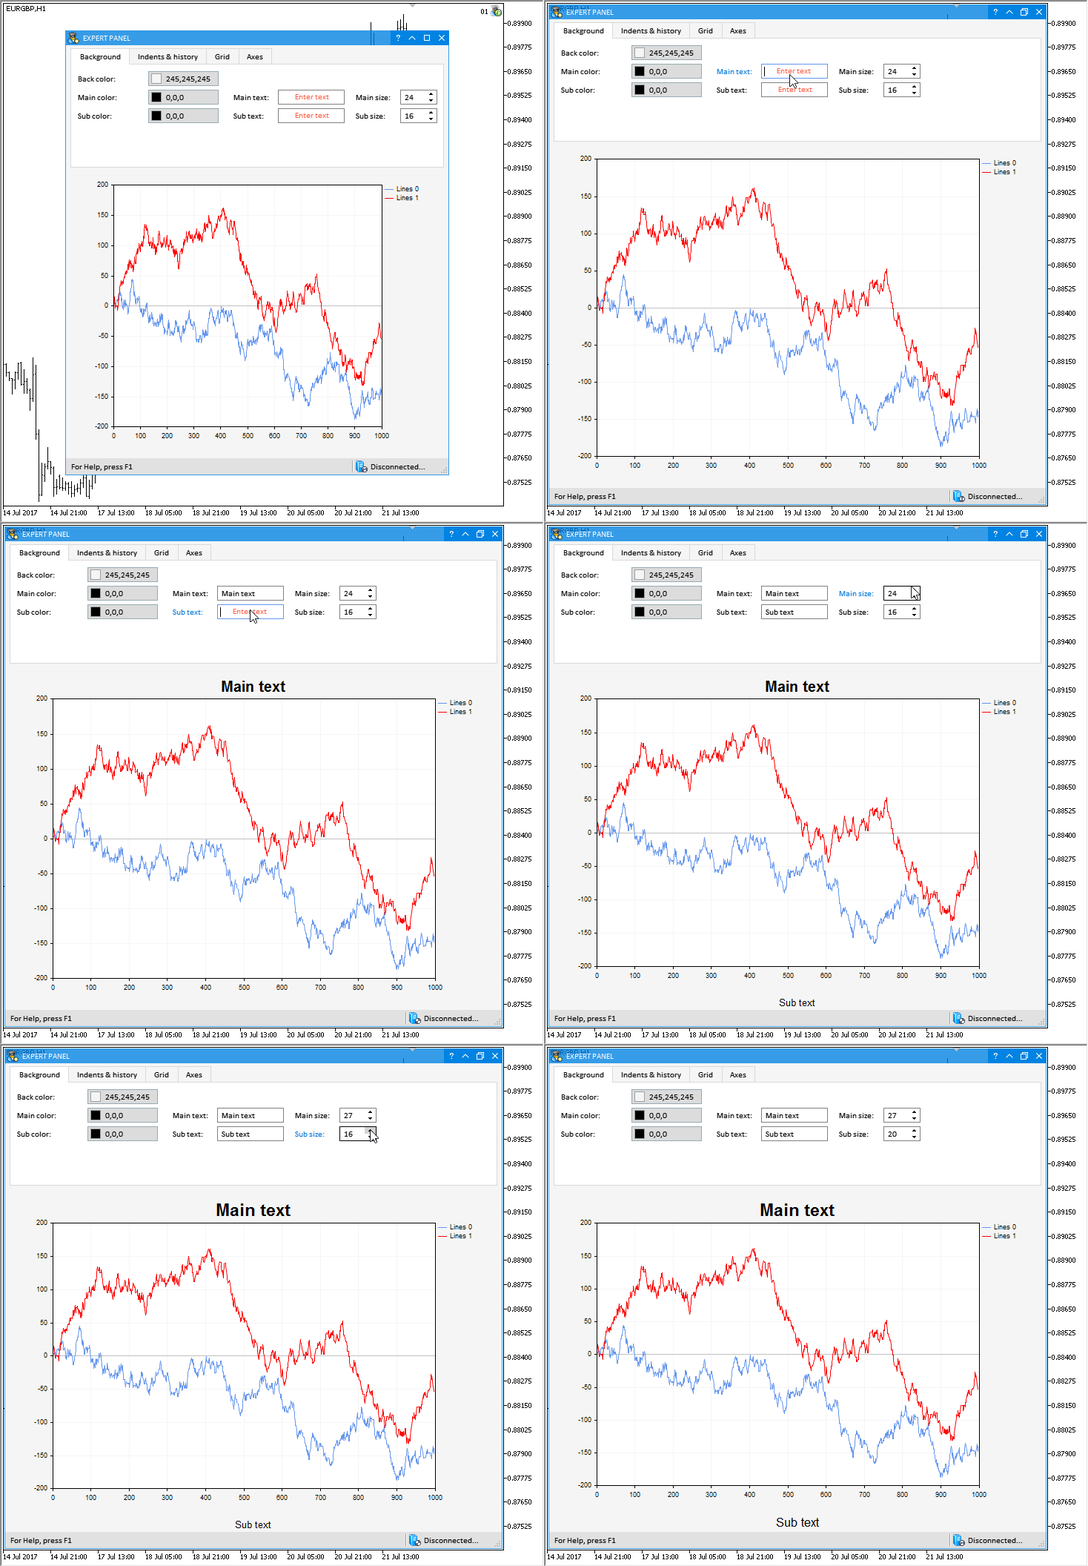
Fig. 2. Controls of the first tab (Background) of the test MQL application.
The second tab (Indents & history) will contain the controls for setting the following properties:
- Indents (left, right, top, bottom).
- Width of the legend.
- Font size of the legend.
- Size of the legend markers.
- Common indents for all elements of the chart.
- Size of marks of the chart axis scales.
The methods of CGraphic shown in the listing below can be used for getting and setting these properties:
//+------------------------------------------------------------------+
//| Structure CCurveHistory                                          |
//| Usage: history of curves on a two-dimensional graphics           |
//+------------------------------------------------------------------+
struct CCurveHistory
  {
   int               name_width;
   int               name_size;
   int               symbol_size;
   int               count_total;
   int               count_points;
   int               count_lines;
   int               count_histogram;
   int               count_custom;
  };
//+------------------------------------------------------------------+
//| Class CGraphic                                                   |
//| Usage: class for drawing two-dimensional graphics                |
//+------------------------------------------------------------------+
class CGraphic
  {
protected:
   //--- element of graphic
   CCurveHistory     m_history;              // history
   //---
public:
   //--- gets or sets indents
   int               IndentUp(void)               const { return(m_up0);     }
   void              IndentUp(const int up)             { m_up0=up;          }
   int               IndentDown(void)             const { return(m_down0);   }
   void              IndentDown(const int down)         { m_down0=down;      }
   int               IndentLeft(void)             const { return(m_left0);   }
   void              IndentLeft(const int left)         { m_left0=left;      }
   int               IndentRight(void)            const { return(m_right0);  }
   void              IndentRight(const int right)       { m_right0=right;    }
   //--- gets or sets gap
   int               GapSize(void)           const { return(m_gap); }
   void              GapSize(const int size)       { m_gap=size;    }
   //--- gets or sets major mark size
   int               MajorMarkSize(void)           const { return(m_mark_size); }
   void              MajorMarkSize(const int size)       { m_mark_size=size;    }
   //--- gets the curve history properties
   int               HistoryNameWidth(void)            const { return(m_history.name_width);  }
   int               HistoryNameSize(void)             const { return(m_history.name_size);   }
   int               HistorySymbolSize(void)           const { return(m_history.symbol_size); }
   //--- sets the curve history properties
   void              HistoryNameWidth(const int width) { m_history.name_width=width; }
   void              HistoryNameSize(const int size)   { m_history.name_size=size;   }
   void              HistorySymbolSize(const int size) { m_history.symbol_size=size; }
  };
This is how it looks in the graphical interface of the test MQL application:
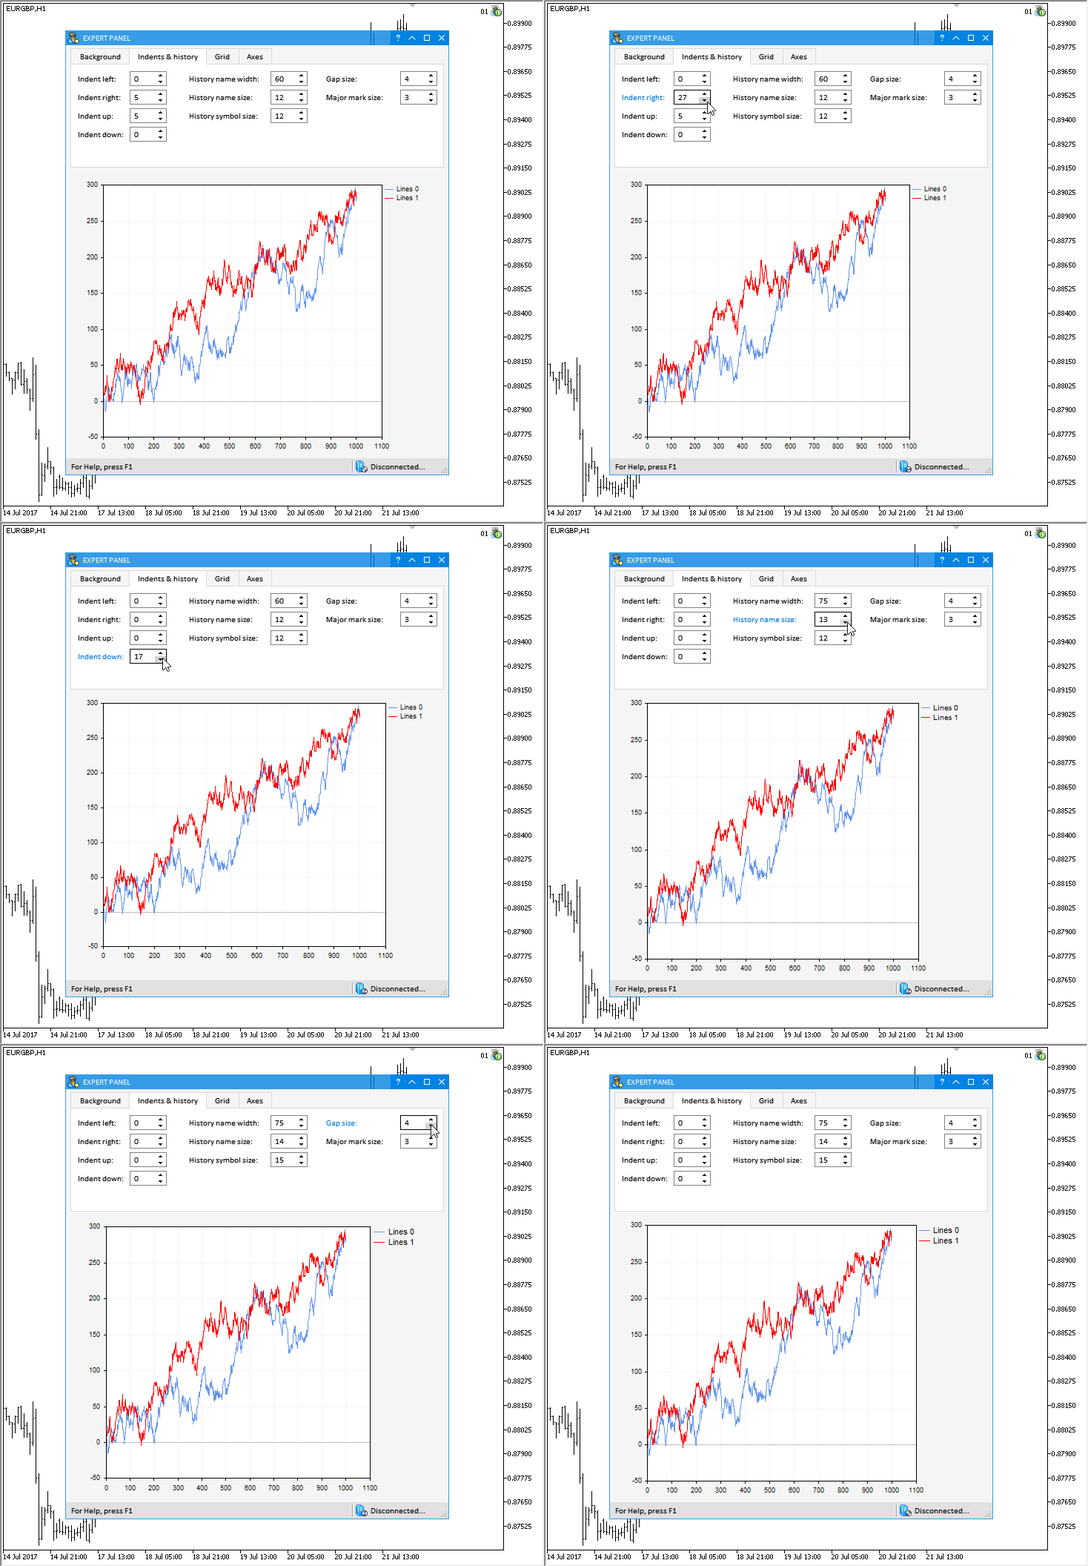
Fig. 3. Controls of the second tab (Indents & history) of the test MQL application.
The third tab (Grid) contains the controls for setting the grid properties listed below:
- Color of grid lines.
- Color of axis zero line.
- Color of grid background.
- Drawing of dots in grid nodes.
- Radius of dots.
- Color of dots.
The appropriate methods are present in the CGraphic class for getting and setting these properties (see the code listing below):
//+------------------------------------------------------------------+
//| Structure CGrid                                                  |
//| Usage: grid on a two-dimensional graphics                        |
//+------------------------------------------------------------------+
struct CGrid
  {
   uint              clr_line;
   uint              clr_background;
   uint              clr_circle;
   uint              clr_axis_line;
   uint              clr_frame;
   int               r_circle;
   bool              has_circle;
  };
//+------------------------------------------------------------------+
//| Class CGraphic                                                   |
//| Usage: class for drawing two-dimensional graphics                |
//+------------------------------------------------------------------+
class CGraphic
  {
protected:
   //--- element of graphic
   CGrid             m_grid;                 // grid
   //---
public:
   //--- gets the grid properties
   uint              GridLineColor(void)        const { return(m_grid.clr_line);       }
   uint              GridAxisLineColor(void)    const { return(m_grid.clr_axis_line);  }
   uint              GridBackgroundColor(void)  const { return(m_grid.clr_background); }
   int               GridCircleRadius(void)     const { return(m_grid.r_circle);       }
   uint              GridCircleColor(void)      const { return(m_grid.clr_circle);     }
   bool              GridHasCircle(void)        const { return(m_grid.has_circle);     }
   //--- sets the grid properties
   void              GridLineColor(const uint clr)        { m_grid.clr_line=clr;       }
   void              GridAxisLineColor(const uint clr)    { m_grid.clr_axis_line=clr;  }
   void              GridBackgroundColor(const uint clr)  { m_grid.clr_background=clr; }
   void              GridCircleRadius(const int r)        { m_grid.r_circle=r;         }
   void              GridCircleColor(const uint clr)      { m_grid.clr_circle=clr;     }
   void              GridHasCircle(const bool has)        { m_grid.has_circle=has;     }
  };
This is how it looks in the end:
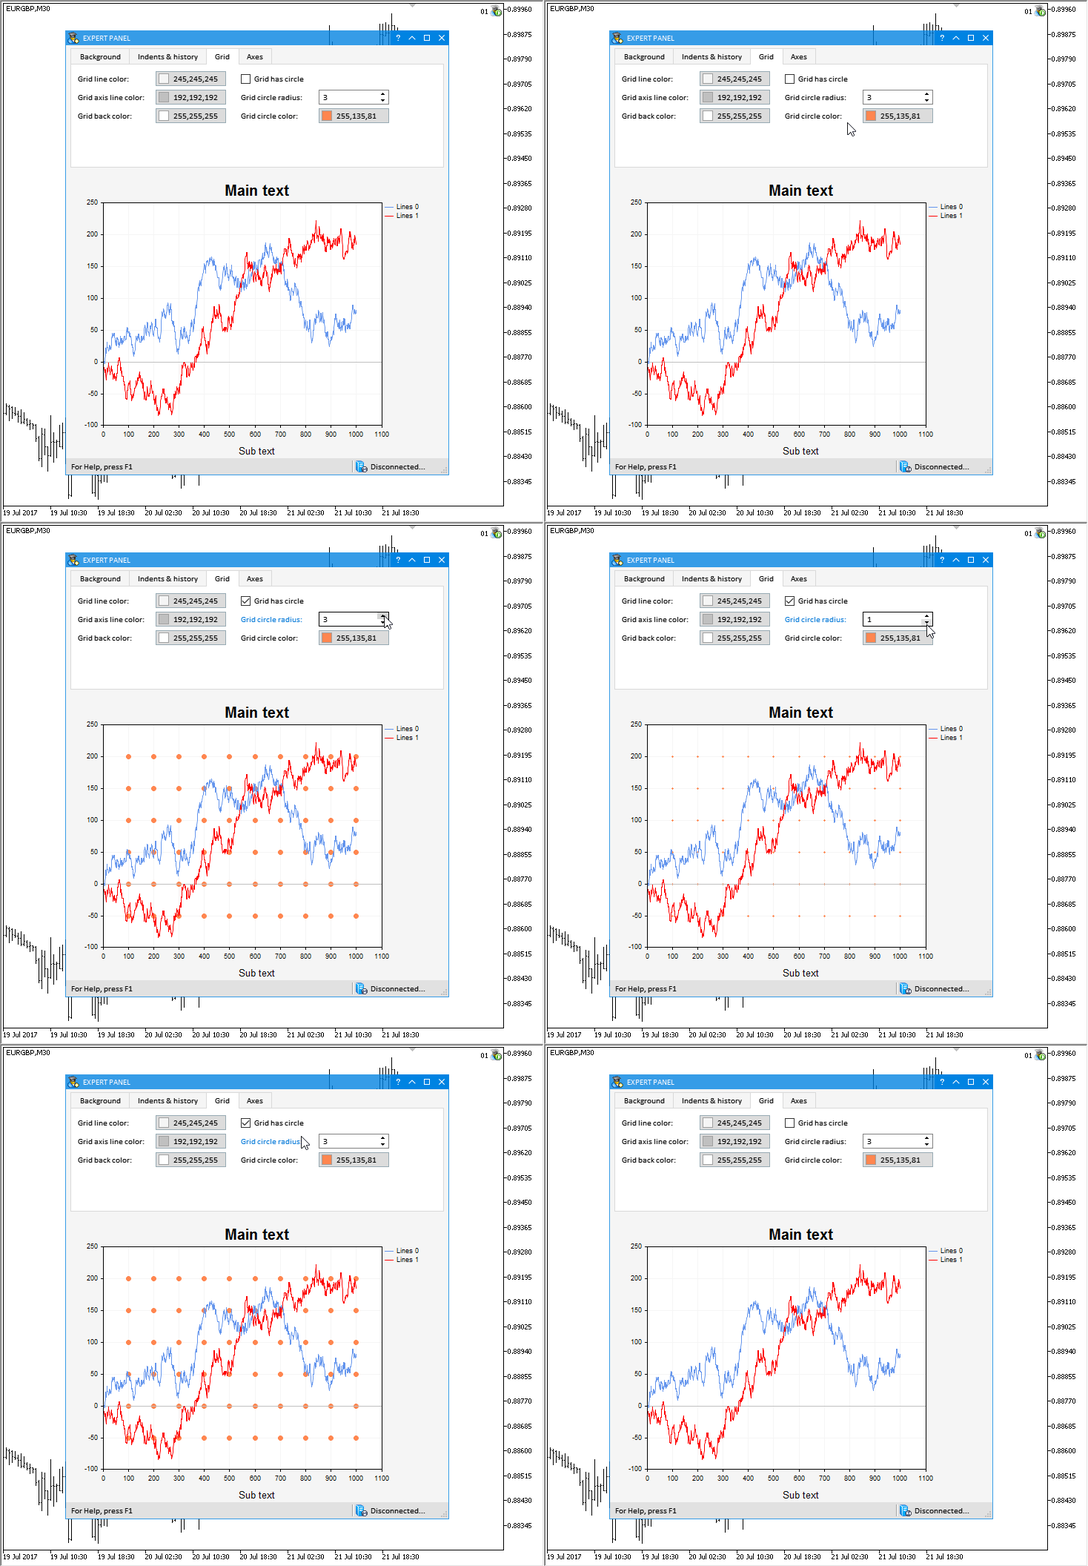
Fig. 4. Controls of the third tab (Grid) of the test MQL application.
The controls for managing the properties of chart axes will be placed on the fourth tab (Axes). Radio buttons in the left part of the working area of the tabs allow switching between configuring a certain axis. These buttons are separated from other controls of the Axes tab with a separation line.
Here are the properties that will be available for modification:
- Auto-scale.
- Minimum axis value.
- Maximum axis value.
- Tolerance value for the axis minimum.
- Tolerance value for the axis maximum.
- Size of the axis numbers.
- The maximum displayed length of the axis numbers.
- Font size for the axis name.
- Initial step value for the axis.
- Maximum amount of numbers on the axis.
- Axis name.
- Text color of the axis name.
The listing below shows the names of the CAxis class methods for getting and setting the above properties:
//+------------------------------------------------------------------+
//| Class CAxis                                                      |
//| Usage: class for create axes on a two-dimensional graphics       |
//+------------------------------------------------------------------+
class CAxis
  {
private:
   double            m_min;
   double            m_max;
   uint              m_clr;
   string            m_name;
   int               m_name_size;
   int               m_values_size;
   int               m_values_width;
   bool              m_auto_scale;
   double            m_default_step;   // length of the default step
   double            m_max_labels;     // the maximum number of marks
   double            m_min_grace;      // "grace" value applied to the minimum data range
   double            m_max_grace;      // "grace" value applied to the maximum data range
   //---
public:
                     CAxis(void);
                    ~CAxis(void);
   //--- properties
   double            Min(void)                  const { return(m_min);  }
   void              Min(const double min)            { m_min=min;      }
   double            Max(void)                  const { return(m_max);  }
   void              Max(const double max)            { m_max=max;      }
   string            Name(void)                 const { return(m_name); }
   void              Name(const string name)          { m_name=name;    }
   //--- default properties
   uint              Color(void)                        const { return(m_clr);            }
   void              Color(const uint clr)                    { m_clr=clr;                }
   bool              AutoScale(void)                    const { return(m_auto_scale);     }
   void              AutoScale(const bool auto)               { m_auto_scale=auto;        }
   int               ValuesSize(void)                   const { return(m_values_size);    }
   void              ValuesSize(const int size)               { m_values_size=size;       }
   int               ValuesWidth(void)                  const { return(m_values_width);   }
   void              ValuesWidth(const int width)             { m_values_width=width;     }
   int               NameSize(void)                     const { return(m_name_size);      }
   void              NameSize(const int size)                 { m_name_size=size;         }
   double            DefaultStep(void)                  const { return(m_default_step);   }
   void              DefaultStep(const double value)          { m_default_step=value;     }
   double            MaxLabels(void)                    const { return(m_max_labels);     }
   void              MaxLabels(const double value)            { m_max_labels=value;       }
   double            MinGrace(void)                     const { return(m_min_grace);      }
   void              MinGrace(const double value)             { m_min_grace=value;        }
   double            MaxGrace(void)                     const { return(m_max_grace);      }
   void              MaxGrace(const double value)             { m_max_grace=value;        }
  };
The result is shown below:
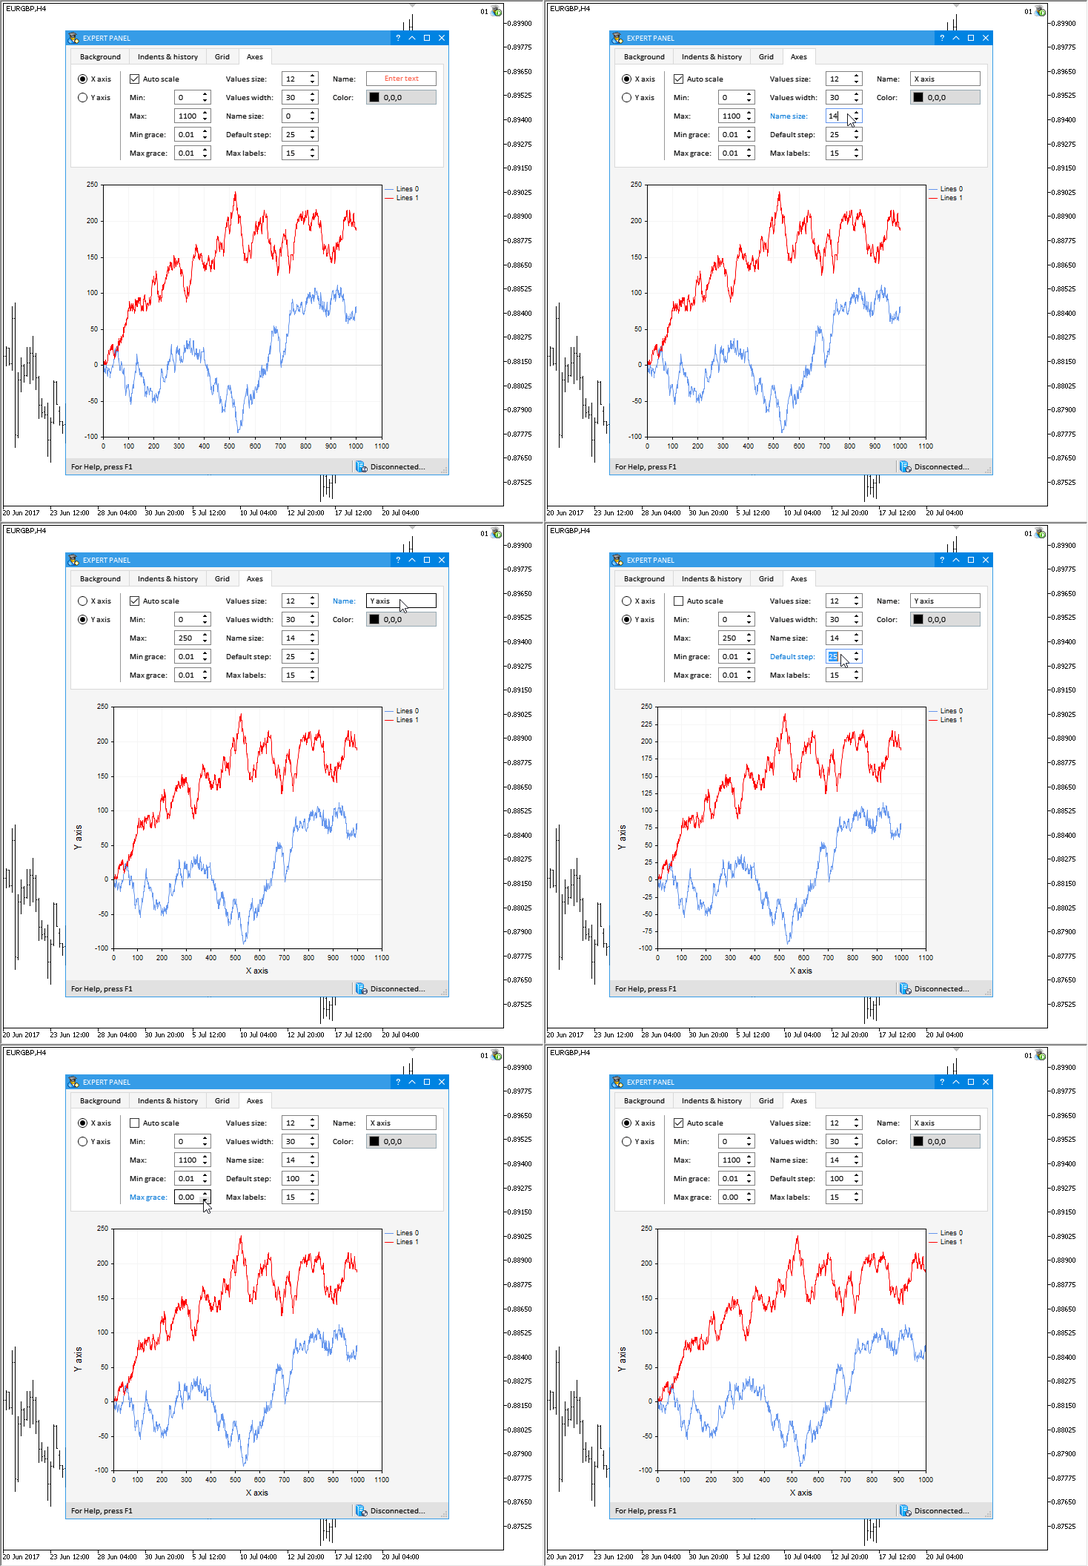
Fig. 5. Controls of the fourth tab (Axes) of the test MQL application.
The test application featured in the article can be downloaded using the below link for further studying.
Application for testing the properties of the chart curves
A separate MQL application has been written to test certain properties of curves on a chart with the CGraphic type. Controls for managing the properties of chart curves will be located at the top of this application's form, with two charts of the CGraphic type (the CGraph control) right below them. The first chart will display series with random data, and the second one will plot their derivatives, which are calculated based on the formula of the Momentum indicator, as an example.
Here are the controls for managing the properties of chart curves:
- Animate checkbox - start the automatic input of data to the chart.
- Array size spin edit box – the current number of elements in the data array that are displayed on the chart.
- Random button – generate random data sequences in series on the chart.
- Period spin edit box – value of the variable to calculate the Momentum indicator.
- Curve type combo box – type of curves on the chart.
- Point type combo box – type of the data points that are used for plotting the curves on the chart.
The custom class of the application (CProgram) implements methods that are related to the controls listed above and perform the following tasks:
- Setting the size of the data arrays to display on the chart.
- Initializing the arrays with data.
- Updating the charts to reflect the recent changes.
- Adding one element to the end of the arrays.
- Deleting one element at the end of arrays.
- Updating charts by timer.
- Animating charts with automatic input of new data.
Below is the code listing for all methods that implement these functions. Download the files at the end of the article to find more details on the code of these methods.
class CProgram : public CWndEvents
  {
protected:
   //--- Arrays of data for output on the chart
   double            data1[];
   double            data2[];
   //---
   double            data3[];
   double            data4[];
   //---
private:
   //--- Resize the arrays
   void              ResizeGraph1Arrays(void);
   void              ResizeGraph2Arrays(void);
   void              ResizeGraph1Arrays(const int new_size);
   void              ResizeGraph2Arrays(const int new_size);
   //--- Initialization of arrays
   void              InitGraph1Arrays(void);
   void              InitGraph2Arrays(void);
   //--- Zero the arrays
   void              ZeroGraph1Arrays(void);
   void              ZeroGraph2Arrays(void);
   //--- Set random value at the specified index
   void              SetGraph1Value(const int index);
   void              SetGraph2Value(const int index);
   //--- Update the series on the chart
   void              UpdateGraph(void);
   void              UpdateGraph1(void);
   void              UpdateGraph2(void);

   //--- Recalculate the series on the chart
   void              RecalculatingSeries(void);
   //--- Add one more value tp the end of the arrays
   void              AddValue(void);
   //--- Remove one value at the end of the arrays
   void              DeleteValue(void);

   //--- Update the chart by timer
   void              UpdateGraphByTimer(void);
   //--- Animate the chart series
   void              AnimateGraphSeries(void);
  };
Here is how it looks:
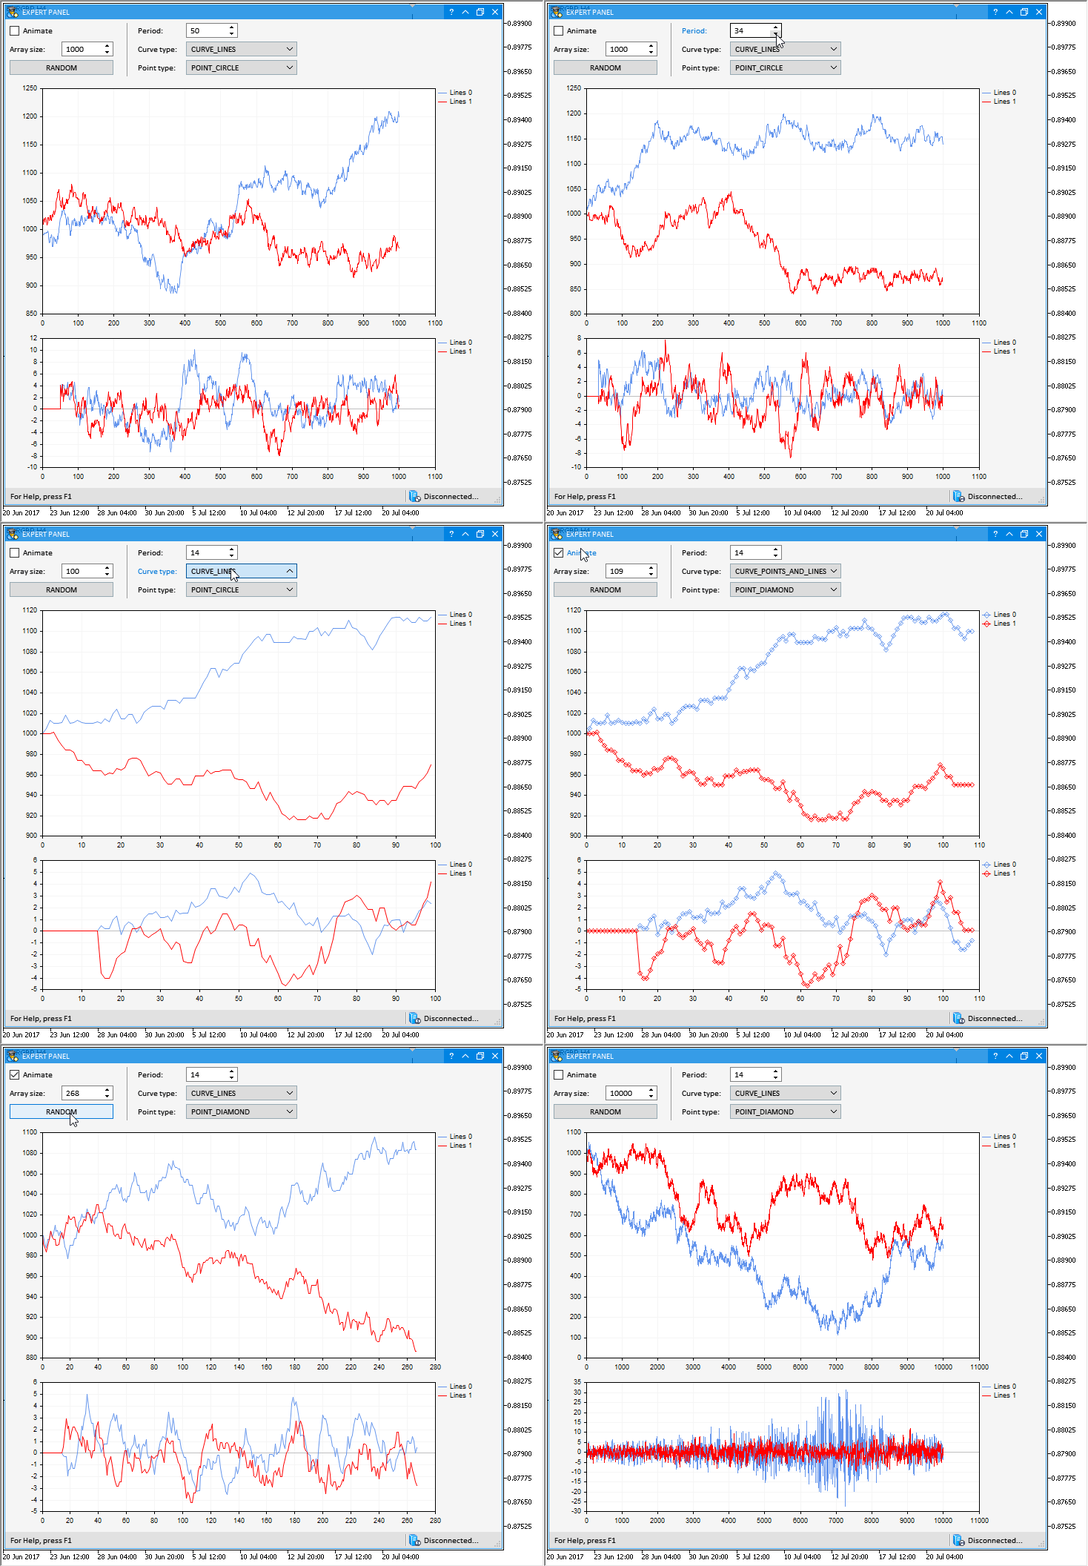
Fig. 6. Graphical interface of the application for testing the properties of chart curves.
The test application featured in the article can be downloaded using the below link for further studying.
Application with an animated hypocycloid chart
In one of his books on VBA programming in Microsoft Excel, John Walkenbach provides readers with a CD with test files. One of the files implements a diagram, where an infinite number of hypocycloids is generated.
For reference: Wikipedia gives the following definition:
A hypocycloid (from Greek ὑπό — under, below and κύκλος — circle, circumference) is a special plane curve generated by the trace of a fixed point on a small circle that rolls within a larger circle.
Definition by John Walkenbach given in his book:
Let us implement a similar application in MQL, and add a graphical interface for managing the parameters. Let us see how it works in details.
Three parameters are used to generate a new hypocycloid, which are used to initialize the numeric sequences with the specified step. Then calculations are carries out based on the values in these sequences in order to obtain the coordinates of points on the chart. After that, the obtained results are normalized.
In the custom class, we declare multiple arrays to calculate the sequences and fields to calculate the mean and standard deviation.
//+------------------------------------------------------------------+
//|                                                      Program.mqh |
//|                        Copyright 2017, MetaQuotes Software Corp. |
//|                                             https://www.mql5.com |
//+------------------------------------------------------------------+
#include <Math\Stat\Stat.mqh>
#include <EasyAndFastGUI\WndEvents.mqh>
#include <EasyAndFastGUI\TimeCounter.mqh>
//+------------------------------------------------------------------+
//| Class for creating the application                               |
//+------------------------------------------------------------------+
class CProgram : public CWndEvents
  {
protected:
...
   //--- Arrays of data for calculations
   double            a_inc[];
   double            b_inc[];
   double            t_inc[];
   double            x_source[];
   double            y_source[];
   //--- Arrays of data for output to the chart
   double            x_norm[];
   double            y_norm[];
   //--- To calculate the mean and standard deviation
   double            x_mean;
   double            y_mean;
   double            x_sdev;
   double            y_sdev;
...
  };
//+------------------------------------------------------------------+
//| Constructor                                                      |
//+------------------------------------------------------------------+
CProgram::CProgram(void) : x_mean(0),
                           y_mean(0),
                           x_sdev(0),
                           y_sdev(0)
  {
...
  }
The values will be calculated in the CProgram::InitArrays() method. Here, the first cycle calculates the initial data. Then the mean and standard deviation are obtained, and the second cycle normalizes the data. The array sizes are set using the CProgram::ResizeArrays() method. Values for the array sizes are taken from the Text box control (CTextEdit) of the application's graphical interface.
class CProgram : public CWndEvents
  {
private:
   //--- Resize the arrays
   void              ResizeArrays(void);
   //--- Initialization of the auxiliary arrays for calculations
   void              InitArrays(void);
  };
//+------------------------------------------------------------------+
//| Resize the arrays                                                |
//+------------------------------------------------------------------+
void CProgram::ResizeArrays(void)
  {
   int array_size =::ArraySize(x_norm);
   int new_size   =(int)m_array_size.GetValue();
//--- Leave, if the size has not changed
   if(array_size==new_size)
      return;
//--- Set the new size
   ::ArrayResize(a_inc,new_size);
   ::ArrayResize(b_inc,new_size);
   ::ArrayResize(t_inc,new_size);
   ::ArrayResize(x_source,new_size);
   ::ArrayResize(y_source,new_size);
   ::ArrayResize(x_norm,new_size);
   ::ArrayResize(y_norm,new_size);
  }
//+------------------------------------------------------------------+
//| Initialization of arrays                                         |
//+------------------------------------------------------------------+
void CProgram::InitArrays(void)
  {
//--- Resize the arrays
   ResizeArrays();
//--- Calculate the values using formulas
   int total=(int)m_array_size.GetValue();
   for(int i=0; i<total; i++)
     {
      if(i<1)
        {
         a_inc[i] =1+(double)m_animate.GetValue();
         b_inc[i] =1+(double)m_animate.GetValue();
         t_inc[i] =1+(double)m_animate.GetValue();
        }
      else
        {
         a_inc[i] =a_inc[i-1]+(double)m_a_inc.GetValue();
         b_inc[i] =b_inc[i-1]+(double)m_b_inc.GetValue();
         t_inc[i] =t_inc[i-1]+(double)m_t_inc.GetValue();
        }
      //---
      double a=a_inc[i];
      double b=b_inc[i];
      double t=t_inc[i];
      //---
      x_source[i] =(a-b)*cos(t)+b*cos((a/b-1)*t);
      y_source[i] =(a-b)*sin(t)+b*sin((a/b-1)*t);
     }
//--- Calculate the mean
   x_mean=MathMean(x_source);
   y_mean=MathMean(y_source);
//--- Calculate the standard deviation
   x_sdev=MathStandardDeviation(x_source);
   y_sdev=MathStandardDeviation(y_source);
//--- Adjustment to void division by zero
   x_sdev =(x_sdev==0)? 1 : x_sdev;
   y_sdev =(y_sdev==0)? 1 : y_sdev;
//--- Normalize the data
   for(int i=0; i<total; i++)
     {
      x_norm[i] =(x_source[i]-x_mean)/x_sdev;
      y_norm[i] =(y_source[i]-y_mean)/y_sdev;
     }
  }
The CGraphic class contains methods that allow adding additional notches, lines and text to the axis scales within the working area of the created chart.
In our case, the CProgram::TextAdd() method will be used to output the values of the mean and standard deviation for X and Y sequences in the top left corner of the diagram. The CGraphic::ScaleX() and CGraphic::ScaleY() methods are used to obtain the coordinates of the extreme point (top left corner) of the diagram. They are designed to scale the real chart values into pixel coordinates. Here, the minimum along the X axis and maximum along the Y axis are fed as real values.
class CProgram : public CWndEvents
  {
private:
   //--- Add text to the chart
   void              TextAdd(void);
  };
//+------------------------------------------------------------------+
//| Add text to the chart                                            |
//+------------------------------------------------------------------+
void CProgram::TextAdd(void)
  {
//--- Get the pointer to the chart
   CGraphic *graph=m_graph1.GetGraphicPointer();
//---
   int  x     =graph.ScaleX(graph.XAxis().Min())+50;
   int  y     =graph.ScaleY(graph.YAxis().Max())+10;
   int  y2    =y+20;
   uint clr   =::ColorToARGB(clrBlack);
   uint align =TA_RIGHT;
//---
   string str[8];
   str[0] ="x mean:";
   str[1] ="y mean:";
   str[2] =::DoubleToString(x_mean,2);
   str[3] =::DoubleToString(y_mean,2);
   str[4] ="x sdev:";
   str[5] ="y sdev:";
   str[6] =::DoubleToString(x_sdev,2);
   str[7] =::DoubleToString(y_sdev,2);
//--- Calculate the coordinates and output the text on the chart
   int l_x=0,l_y=0;
   for(int i=0; i<8; i++)
     {
      if(i<2)
         l_x=x;
      else if(i<6)
         l_x=(i%2==0)? l_x+50 : l_x;
      else
         l_x=(i%2==0)? l_x+60 : l_x;
      //---
      l_y=(i%2==0)? y : y2;
      //---
      graph.TextAdd(l_x,l_y,str[i],clr,align);
     }
  }
After all the necessary data are set on the chart, it is necessary to redraw it to reflect the latest changes. This is done by the CProgram::UpdateSeries() method. Here, it first checks if there are series on the chart. If there are, then it sets the last calculated data. In addition, the properties for the curve are set using the controls of the graphical interface. Here, those are (1) the line smoothing, (2) the type of dots and (3) the type of the curve. It should be noted that text should be applied to the chart after all other properties and data had been set and rendered. At the very end, it is necessary to update the chart to see the result.
class CProgram : public CWndEvents
  {
private:
   //--- Set and update series on the chart
   void              UpdateSeries(void);
  };
//+------------------------------------------------------------------+
//| Set and update series on the chart                               |
//+------------------------------------------------------------------+
void CProgram::UpdateSeries(void)
  {
//--- Get the pointer to the chart
   CGraphic *graph=m_graph1.GetGraphicPointer();
//--- Update all series of the chart
   int total=graph.CurvesTotal();
   if(total>0)
     {
      //--- Get the curve pointer
      CCurve *curve=graph.CurveGetByIndex(0);
      //--- Set the data arrays
      curve.Update(x_norm,y_norm);
      //--- Get the values of the curve properties
      ENUM_CURVE_TYPE curve_type =(ENUM_CURVE_TYPE)m_curve_type.GetListViewPointer().SelectedItemIndex();
      ENUM_POINT_TYPE point_type =(ENUM_POINT_TYPE)m_point_type.GetListViewPointer().SelectedItemIndex();
      //--- Set the properties
      curve.LinesSmooth(m_line_smooth.IsPressed());
      curve.PointsType(point_type);
      curve.Type(curve_type);
     }
//--- Apply
   graph.Redraw(true);
//--- Output text
   TextAdd();
//--- Refresh the chart
   graph.Update();
  }
The CProgram::RecalculatingSeries() method is used for calculating and applying the obtained results in a single call:
class CProgram : public CWndEvents
  {
private:
   //--- Recalculate the series on the chart
   void              RecalculatingSeries(void);
  };
//+------------------------------------------------------------------+
//| Recalculate the series on the chart                              |
//+------------------------------------------------------------------+
void CProgram::RecalculatingSeries(void)
  {
//--- Calculate the values and initialize the arrays
   InitArrays();
//--- Update the series
   UpdateSeries();
  }
The diagram plotted based on these formulas will look more interesting if it becomes animated. To set the calculated sequences in motion, it is necessary to change the initial value of these sequences. This can be achieved by entering values via the spin edit box or by running the process in automatic mode. In automatic mode, the value in this edit box is incremented or decremented in the CProgram::AnimateGraphSeries() method. This method is called in the CProgram::UpdateGraphByTimer() method, which in turn is invoked in the application timer.
class CProgram : public CWndEvents
  {
private:
   //--- Update the chart by timer
   void              UpdateGraphByTimer(void);
   //--- Animate the chart series
   void              AnimateGraphSeries(void);
  };
//+------------------------------------------------------------------+
//| Timer                                                            |
//+------------------------------------------------------------------+
void CProgram::OnTimerEvent(void)
  {
   CWndEvents::OnTimerEvent();
//--- Update the chart by timer
   if(m_counter1.CheckTimeCounter())
     {
      UpdateGraphByTimer();
     }
...
  }
//+------------------------------------------------------------------+
//| Update the chart by timer                                        |
//+------------------------------------------------------------------+
void CProgram::UpdateGraphByTimer(void)
  {
//--- Leave, if (1) the form is minimized or (2) animation is disabled
   if(m_window.IsMinimized() || !m_animate.IsPressed())
      return;
//--- Animate the chart series
   AnimateGraphSeries();
//--- Update arrays and series on the chart
   RecalculatingSeries();
  }
//+------------------------------------------------------------------+
//| Animate the chart series                                         |
//+------------------------------------------------------------------+
void CProgram::AnimateGraphSeries(void)
  {
//--- To specify the direction to resize the arrays
   static bool counter_direction=false;
//--- Switch the direction if the minimum has been reached
   if((double)m_animate.GetValue()<=(double)m_animate.MinValue())
      counter_direction=false;
//--- Switch the direction if the maximum has been reached
   if((double)m_animate.GetValue()>=(double)m_animate.MaxValue())
      counter_direction=true;
//--- Resize the array in the specified direction
   string value="";
   if(!counter_direction)
      value=string((double)m_animate.GetValue()+m_animate.StepValue());
   else
      value=string((double)m_animate.GetValue()-m_animate.StepValue());
//--- Set the new value and update the text box
   m_animate.SetValue(value,false);
   m_animate.GetTextBoxPointer().Update(true);
  }
The obtained result is shown below:
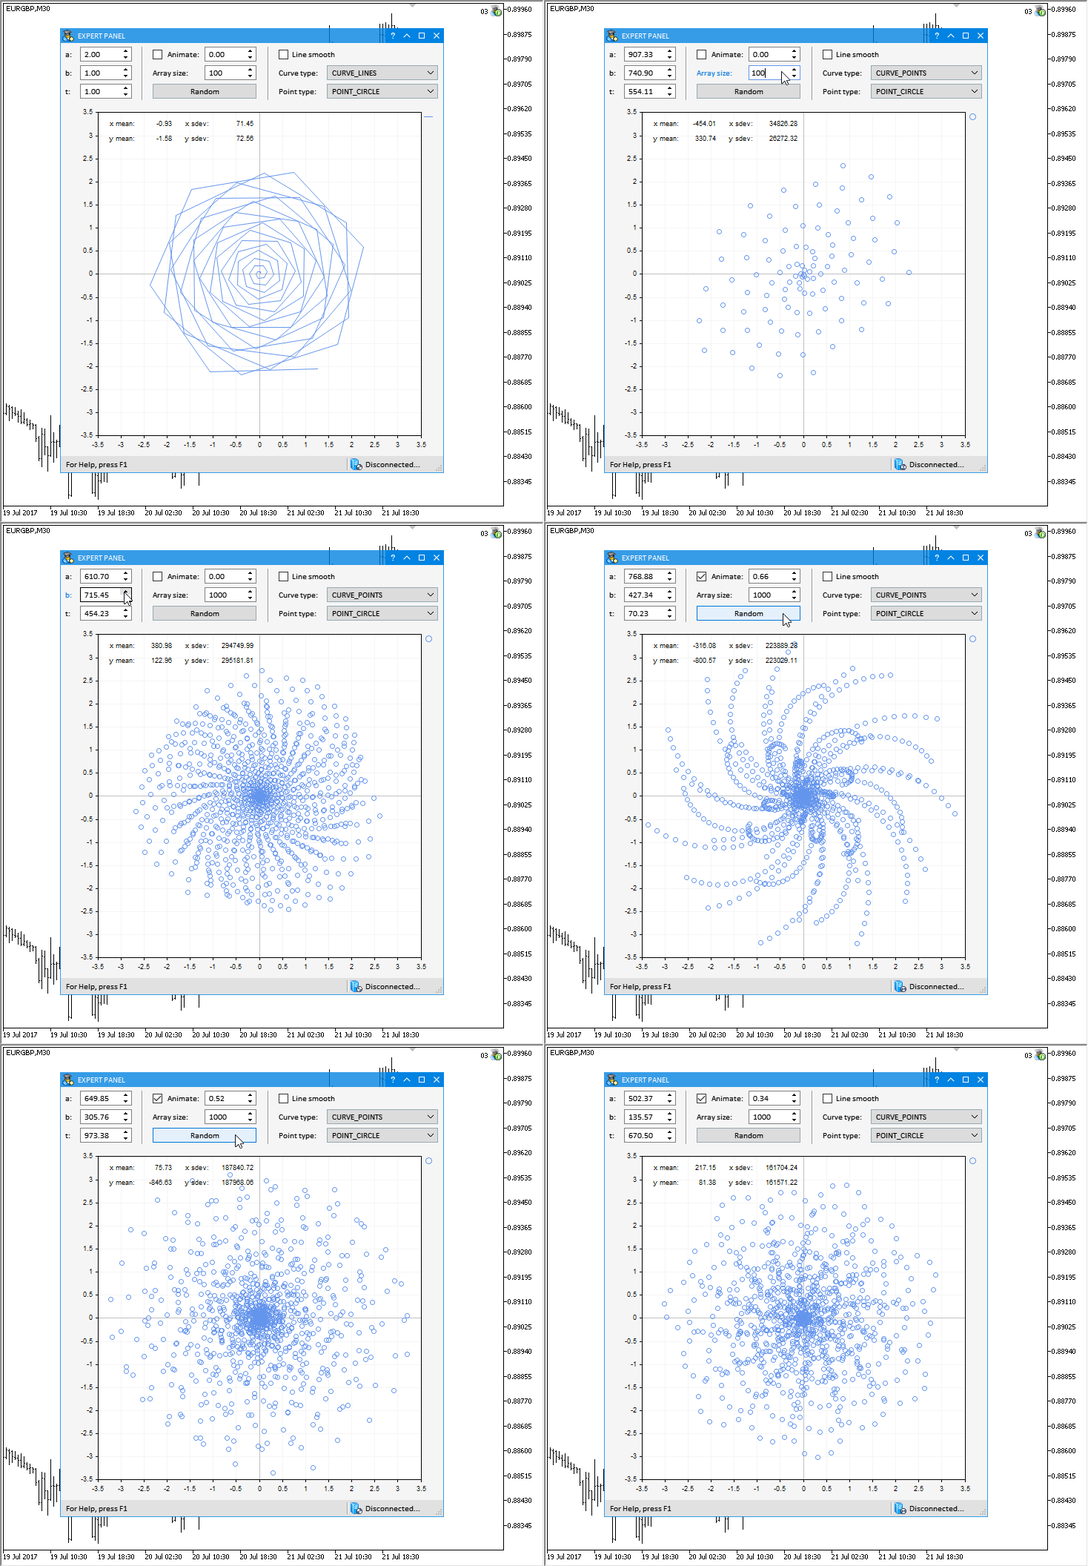
Fig. 7. Demonstration of an animated hypocycloid.
The test application featured in the article can be downloaded using the below link for further studying.
New version of the test application from previous updates
The test application demonstrated in the article Graphical Interfaces IX: The Progress Bar and Line Chart Controls (Chapter 2) has been updated according to the changes in this update.
The new version of this MQL application with the updated graphical interface is shown below:
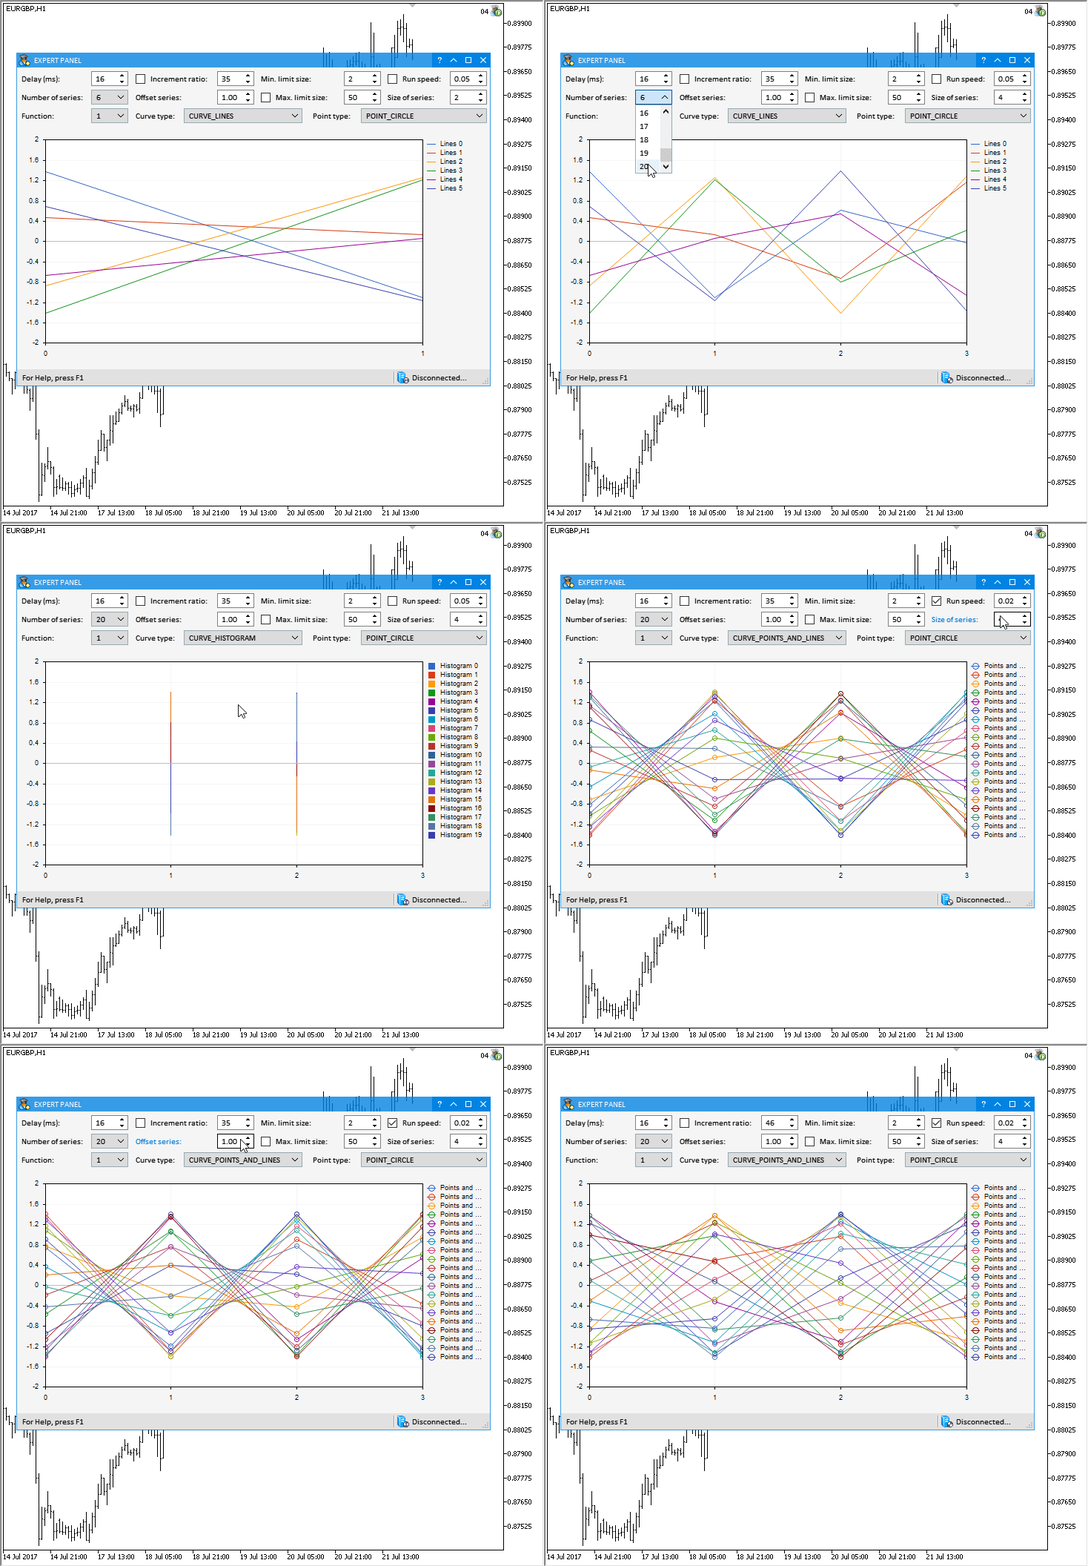
Fig. 8. New version of the test application from the previous updates.
The test application featured in the article can be downloaded using the below link for further studying.
Conclusion
In this article, a part of the standard library for plotting scientific charts has been integrated to the developed library for creating graphical interfaces. All demonstrated examples can be downloaded from the files attached to this article to study the source code in more details.
The library at the current stage of development looks like in the schematic below:

Fig. 9. Library structure at the current stage of development
The presented library code is free. You can use it in your projects, including commercial ones, write articles and fulfill orders.
Translated from Russian by MetaQuotes Ltd.
Original article: https://www.mql5.com/ru/articles/3527
Warning: All rights to these materials are reserved by MetaQuotes Ltd. Copying or reprinting of these materials in whole or in part is prohibited.
This article was written by a user of the site and reflects their personal views. MetaQuotes Ltd is not responsible for the accuracy of the information presented, nor for any consequences resulting from the use of the solutions, strategies or recommendations described.
 Universal Expert Advisor: CUnIndicator and Use of Pending Orders (Part 9)
 Risk Evaluation in the Sequence of Deals with One Asset
 Cross-Platform Expert Advisor: The CExpertAdvisor and CExpertAdvisors Classes
 TradeObjects: Automation of trading based on MetaTrader graphical objects
- Free trading apps
- Over 8,000 signals for copying
- Economic news for exploring financial markets
You agree to website policy and terms of use
After the 04/06/2020 update, it's showing an internal error during compilation: "Internal compiler error"
Do the errors still exist?
And is the latest version the one in the article? If not, where can I get the latest version?
Hello.
How can I put another complex object into a table cell? If it is, for example, a graph or something else, not just an imag.
so good GUI!
I am sorry!
Element.mqh have some errors. can you correct them!
can you correct them! thank you! @Anatoli Kazharski
class CWindow; //have no body
bool CElement::CheckMainPointer(void)
{
//--- Если нет указателя
if(::CheckPointer(m_main)==POINTER_INVALID)
{
//--- Вывести сообщение в журнал терминала
::Print(__FUNCTION__,
" > Перед созданием элемента... \n... .нужно передать указатель на главный элемент: "+
ClassName()+"::MainPointer(CElementBase &object)").
//--- Прервать построение графического интерфейса приложения
return(false);
}
//--- Сохранение указателя на форму
m_wnd=m_main.WindowPointer();
//--- Если нет указателя на форму
if(::CheckPointer(m_wnd)==POINTER_INVALID)
{
//--- Вывести сообщение в журнал терминала
::Print(__FUNCTION__,
" > У элемента "+ClassName()+" нет указателя на форму!... \n "+
"... .Элементы должны создаваться в порядке своей вложенности!");
//--- Прервать построение графического интерфейса приложения
return(false);
}
//--- Сохранение указателя на курсор мыши
m_mouse=m_main.MousePointer();
//--- Сохранение свойств
m_id =m_wnd.LastId()+1; // 'LastId' - undeclared identifier Element.mqh 842 22
m_chart_id =m_wnd.ChartId(); // 'ChartId' - undeclared identifier Element.mqh 843 22
m_subwin =m_wnd.SubwindowNumber(); // 'SubwindowNumber' - undeclared identifier Element.mqh 844 22
m_corner =(ENUM_BASE_CORNER)m_wnd.Corner(); // 'Corner' - undeclared identifier Element.mqh 845 40
m_anchor =(ENUM_ANCHOR_POINT)m_wnd.Anchor(); // 'Anchor' - undeclared identifier Element.mqh 846 41
//--- Отправить признак наличия указателя
return(true);
}