
Checking the Myth: The Whole Day Trading Depends on How the Asian Session Is Traded
Introduction
Hello! As a man with some experience in Forex and several deposits lost, I think I have the right to discuss this topic.
It's not a secret that the whole technical analysis, if we omit the verbiage, is essentially reduces to finding patterns. For example, if we have found the 95% probability that at new moon, at midnight, the dollar begins to fall in price before the first
roosters, you'll naturally trade at this time, according to this
information.
Surfing over the Forex forums to find the grains of information that can be useful for trading, I have found many different statements, that have been presented as the universal truth. There is a program "MythBusters" on MTV, its authors check the so-called universal truth in practice and shows whether it's true or not.
Following them, I also decided to check some statements, that have been presented as truth by the so-called Forex gurus. Today we' ll check the following:
"The whole day trading depends on how the Asian session is traded".
Einstein
argued that everything is relative, and as soon we consider details of any statement, we are convinced immediately that he was right. For example, there is a question about the trading time of the Asian session. Let's take a look at the following table, trading session hours are presented below.
| Region | City | Winter time Open |
Winter time Close |
Summer time Open |
Summer time Close |
|---|---|---|---|---|---|
| ASIA | Tokyo Hong Kong Singapore |
03:00 04:00 04:00 |
11:00 12:00 12:00 |
04:00 05:00 04:00 |
12:00 13:00 12:00 |
| EUROPE | Frankfurt Zurich Paris London |
9:00 9:00 9:00 10:00 |
17:00 17:00 17:00 18:00 |
09:00 09:00 09:00 10:00 |
17:00 17:00 17:00 18:00 |
| AMERICA | New York Chicago |
16:00 17:00 |
24:00 01:00 |
16:00 17:00 |
24:00 01:00 |
| PACIFIC | Wellington Sydney |
00:00 01:00 |
08:00 09:00 |
00:00 01:00 |
08:00 09:00 |
Table 1. Forex trading sessions
As we see, the Asian session trades from 3:00 till 12:00 in winter and from 4:00 till 13:00 in summer. But Europe starts trading at 9.00. So that's the question about the pure Asian session - is it from 3.00 till 9.00 or from 3.00 till 13.00? Another question is the server time, because different brokers have different server time, so it isn't necessarily the same as Moscow time, another question is the winter/summer time changes - some brokers don't change it. So, we have to take that into account in our study. What does the "..the whole trading day depends on it" mean? If the Asian session was bullish, the price will grow till the next session?
First of all, let's take a look at Fig. 1. The sessions is painted with different colors using the indicator "i-Sessions" by Igor Kim. The time area from 3.00 till 13.00 is filled with dark color ("Asia"). The European session (from 9.00 till 18.00) is of lighter color, and American session (from 16.00 till 24.00) has the lightest color.
Fig. 1 Chart of NZDUSD with sessions
Further I will describe all in details to help newbies to understand it all.
So, my Expert Advisor "1-Session" is designed to solve the following tasks:
It must calculate open and close prices of the session, which has been defined by us. Let's assume that if the opening price of the session is more than the closing price, the session is bearish, and it bullish for the opposite case.
If the open price is equal to the close price, the session is neutral.
I tried to comment all code of the Expert Advisor, to make it simple the newbies (I am one of them).
//+------------------------------------------------------------------+
//|                                                    1-Session.mq4 |
//|                                Copyright © 2009, Igor Alexandrov |
//|                                                sydiya@rambler.ru |
//+------------------------------------------------------------------+
#property copyright "Copyright © 2009, Igor Alexandrov"
#property link      "sydiya@rambler.ru"

//---- Input parameters
extern string  Open_session =  "01:00"; //Opening time of the session to study
extern string  Close_session = "10:00"; //Closing time of the session to study
extern int Day_kol_vo = 50;             //Number of days to study
extern int Hour_kol_vo = 15;            //Number of hours to study after the session
extern int Profit = 20;                 //Take Profit value to verify

//----------------------------------------------------------------------------
string Symb;                            //Trade symbol of the expert attached
//----------------------------Starting----------------------------------------

int start()
  { //the main bracket begins
   int  Shift_open_H1,       //Number of hourly bar with the same opening time as daily bar
   Shift_open_bars_session,  //Number of hourly bar, that opens the session
   Shift_close_bars_session, //Number of hourly bar, that closes the session
   STOP_LEVER=0;             //Minimal distance for TP and SL

   double Open_bars_session, //Opening price of the first bar of the session
   Close_bars_session,       //Closing price of the last bar of the session
   Vira_session,             //Maximal price of the session
   Total_TP=0,               //Counter of Take Profit executions
   Total_SL=0,               //Counter of Stop Loss executions
   Total_day=0,              //Number of days to study
   Total_SL_TP=0,            //Counter of neutral sessions
   Maina_session;            //Minimal price of the session

   datetime Time_open_day,   //Opening time of the i-th daily bar
   Time_open_session,        //Opening time of the session (datetime format)
   Time_close_session;       //Closing time of the session (datetime format)

   string String_open_H1;    //Opening time of the first hourly bar of the day to study
                             //as string format "yyyy.mm.dd"
   bool   Session_buy=false, //Bullish session flag
   Session_sell=false;       //Bearish session flag
   Symb=Symbol();            //Symbol name

   //Minimal distance for TP and SL
   STOP_LEVER=MarketInfo(Symb,MODE_STOPLEVEL);

   // daily bars cycle
   for(int i=Day_kol_vo;i>0;i --)
     { //bracket for daily bars cycle

      //Counter for days studied
      Total_day++;

      //opening time of the i-th daily bar
      Time_open_day=iTime(Symb,PERIOD_D1,i);

      //number of hourly bar with the same opening time as daily bar
      Shift_open_H1=iBarShift(Symb,PERIOD_H1,Time_open_day,false);

      //convert opening time of the first hourly bar to the string like "yyyy.mm.dd"
      String_open_H1=TimeToStr(Time_open_day,TIME_DATE);

      //opening time for the session to study (in the datetime format)
      Time_open_session=StrToTime(String_open_H1+" "+Open_session);

      //number of hourly bar from which session begins
      Shift_open_bars_session=iBarShift(Symb,PERIOD_H1,Time_open_session,false);

      //closing time of the session to study (in datetime format)
      Time_close_session=StrToTime(String_open_H1+" "+Close_session);

      //number of last hourly bar of the session
      Shift_close_bars_session=iBarShift(Symb,PERIOD_H1,Time_close_session,false);

      //opening price of the first bar of the session
      Open_bars_session=iOpen(Symb,PERIOD_H1,Shift_open_bars_session);

      //closing price of the last bar of the session
      Close_bars_session=iClose(Symb,PERIOD_H1,Shift_close_bars_session);

      //finding the maximal price of the session
      Vira_session=iHigh(Symb,PERIOD_H1,iHighest(Symb,PERIOD_H1,MODE_HIGH,
      (Shift_open_bars_session-Shift_close_bars_session),Shift_close_bars_session));

      //finding the minimal price of the session
      Maina_session=iLow(Symb,PERIOD_H1,iLowest(Symb,PERIOD_H1,MODE_LOW,
      (Shift_open_bars_session-Shift_close_bars_session),Shift_close_bars_session));

      // the opening price is greater than closing price, session is Bearish
      if(Open_bars_session>Close_bars_session)
        {
         Session_buy=false;
         Session_sell=true;
        }

      //The opening price is lower than closing price, session is bullish
      if(Open_bars_session<Close_bars_session)
        {
         Session_buy=true;
         Session_sell=false;
        }

      //The opening price is equal to closing price, session is Neutral
      if(Open_bars_session==Close_bars_session)
        {
         Session_buy=false;
         Session_sell=false;
        }
      // hours counter for checking
      int PEREBOR=0;

      //Cycle for hourly bars in the i-th day
      for(int j=Shift_close_bars_session;j>Shift_close_bars_session-Hour_kol_vo;j --)
        {//Opening bracket for the hourly bars cycle

         //hours counter (for checking)
         PEREBOR++;

         //if session is bullish
         if(Session_buy==true && Session_sell==false)
           {
            //if maximal price of the hourly bar
            //is greater than (closing price of the session+Profit+Minimal distance)
            if(iHigh(Symb,PERIOD_H1,j-PEREBOR)>(Close_bars_session+(Profit+STOP_LEVER)*Point))
              {
               Total_TP++;     //Take Profit executed
               break;          //break the cycle(hourly bars)
              }
            //if minimal price of the hourly bar
            //is lower than minimal price of the session
            if(iLow(Symb,PERIOD_H1,j-PEREBOR)<Maina_session)
              {
               Total_SL++;     //Stop Loss executed
               break;          //break the cycle(hourly bars)
              }
           }
         //if session is bearish
         if(Session_buy==false && Session_sell==true)
           {
            //if maximal price of the hourly bar
            //is greater than maximal price of the session
            if(iHigh(Symb,PERIOD_H1,j-PEREBOR)>Vira_session)
              {
               Total_SL++;      //Stop Loss executed
               break;           //break the cycle(hourly bars)
              }
            //if minimal price of the hourly bar
            //is lower than (closing price of the session-(Profit + Minimal distance))
            if(iLow(Symb,PERIOD_H1,j-PEREBOR)<(Close_bars_session-(Profit+STOP_LEVER)*Point))
              {
               Total_TP++;      //Take Profit executed
               break;           //break the cycle(hourly bars)
              }
           }
         //if session is neutral
         if(Session_buy==false && Session_sell==false)
           {
            Total_SL_TP++;      //Increase the counter
            break;              //break the cycle(hourly bars)
           }

        } // closing bracket for the hourly bars cycle

      double Pro_Total_TP=(Total_TP/Total_day)*100, //Probabiility of TP execution
      Pro_Total_SL=(Total_SL/Total_day)*100,        //Probability of SL execution
      Pro_Total_SL_TP=(Total_SL_TP/Total_day)*100;  //Probability of neutral sessions
      int Total_no=Total_day-Total_SL-Total_TP-Total_SL_TP; //TP and SL hasn't executed
      double Pro_Total_no =(Total_no/Total_day)*100;        //Probability that TP and SL will not executed
      Comment("Checked ",Total_day," days","\n",
              "Session Opening time  ",Open_session," Session Closing time ",
              Close_session," Number of hours to check after the session ",Hour_kol_vo," Profit ",Profit,"\n",
              "Take profit has executed ",Total_TP," times","\n",
              "Stop Loss has executed ",Total_SL," times","\n",
              "The neutral sessions was ",Total_SL_TP," times","\n",
              "Neither SL/TP executed ",Total_no," times","\n",
              "Probability for Take Profit execution ",Pro_Total_TP," %","\n",
              "Probability for Stop Loss execution ",Pro_Total_SL," %","\n",
              "Probability for neutral sessions ",Pro_Total_SL_TP," %","\n",
              "Probability that SL and TP will not executed ",Pro_Total_no," %");

     } //Closing bracket for the daily bars

   return(0);

  } //-the main bracket ends
Now let's look carefully at the code to understand the checking method which has been implemented. For example, if a session is bearish, let's simulate the Take Profit at some price level below the close price of the session: (Profit+STOP_LEVER), where Profit (can be changed) is presented in points. It's assumed that if price has fallen, it will continue falling, the same (but the opposite) is for the bullish session.
The STOP_LEVER is the minimal distance from the current price, allowed by broker. It isn't necessary to define it, it is calculated automatically.
The real Take Profit level, defined by you in the parameters window of the Expert Advisor (parameter Profit) will be a little further from the price by value STOP_LEVER, its value is different for different brokers and for different currency pairs. It's designed to achieve the real results in our simulation. For example, if you try to place an order for GOLD with 5 points of profit in real trading, you will not be able to do it, the minimal possible distance from the current price that I saw, was 50 points.
Now let's consider Stop Losses. Generally, you may simply calculate the probability of Take Profit hitting, that has been placed to the price direction, defined for session. But it looks incomplete. It's interesting, and maybe much more important to count not only profitable orders, but also orders with losses.
Let's take a look again at Fig. 1. We can see the following. If Asian session was bullish in general, then the price will not fall below the minimal price of the session. At Fig.1 the session of November, 2009, from 3.00 till 13.00 is outlined with vertical lines. One can see that it's bullish in general, because the opening price is lower than closing price, we assume that the Stop Loss level should be at the minimal price of the session. For the bearish session, the Stop Loss level should be set at the maximal price, as you have already suggested.
The idea of our checking is to take into account our virtual Take Profit and calculated Stop Loss levels and count the execution of both them by using the history.
So, the input parameters of the Expert Advisor (the same that we can change at the "Inputs" tab) are the following:
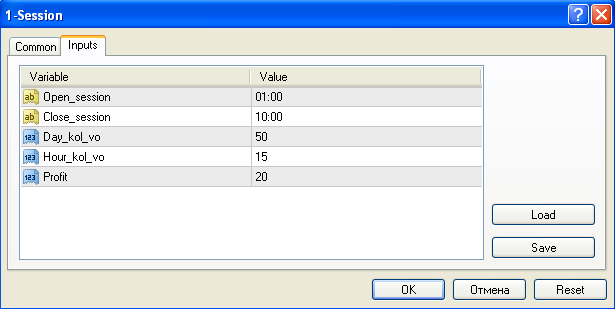
Fig 2. Input parameters of the expert advisor
Open session – opening time of the session,
Close_session – closing time of the session,
Day_kol_vo – number of days in the history (for example, the value equal 50 means that expert will use the last 50 in its calculations, I don't recommend to use too large values),
Hour_kol_vo – number of hours. This parameter defines the number of hours, passed after the ending of session (the expert will use it in calculations). In the data attached I have used the number of hours to the next session. If we study the time from 3.00 till 13.00, its value is equal to 14, for the next session.
Profit – is the distance in points from the closing price of the session. In fact, it's the level of our virtual Take Profit.
The calculation of probabilities is simple - for Take Profits it's a number of executions for the analyzed number of days, divided by number of these days and multiplied by 100, to represent it in percents.
Accordingly, for the Stop Losses it's the number of executions for the analyzed number of days divided by the number of these days, and multiplied by 100.
The same is for the neutral sessions.
Some details about the work of the Expert Advisor and its installation. First of all, as usual, we are copying the Expert Advisor to the experts folder and compile it. After that we attach it at any timeframe (the hourly is preferable), set the time we need and other parameters, that have been described above, and allow it to trade. It doesn't trades because it hasn't any trade functions, it will print the information in the left bottom corner of the chart (the number of days calculated, its parameters, number of Take Profit and Stop Loss executions, number of neutral sessions and the probabilities of TP and SL executions).
Let's remind - it isn't necessary to test it in the History Tester. Just attach it, wait for a tick, look at the results, change its input parameters if necessary, wait for a new tick, save the results somewhere and deattach it finally. Maybe it should be designed as an indicator, but at present time I don't want to change it, probably it will be done in future.
If ticks are too frequent, you can disable the Expert Advisor using the "Expert Advisors" button in the client terminal.
Now let's discuss the subject. Let's take a look at the following table. It has been filled using data calculated by the Expert Advisor several days ago, in November, 10. I haven't used the deeper history, the last 50 days has been used. The time for "trade" (to buy or to sell) was chosen from 3.00 till 13.00 (the full Asian session), from 3.00 till 9.00 (pure Asian session without the European session), and from 9.00 till 13.00 (both Asian and European sessions).
| Time period |
3.00-13.00 |
3.00-13.00 |
3.00-13.00 |
3.00-9.00 |
3.00-9.00 |
3.00-9.00 |
9.00-13.00 |
9.00-13.00 |
9.00-13.00 |
|
|---|---|---|---|---|---|---|---|---|---|---|
| Pair |
Description |
Profit-5 |
Profit-15 |
Profit-25 |
Profit-5 |
Profit-15 |
Profit-25 |
Profit-5 |
Profit-15 |
Profit-25 |
| USDJPY | Take Profit executed % | 74 |
58 |
50 |
78 |
64 |
52 |
70 |
52 |
44 |
| USDJPY | Stop Loss executed % | 24 |
36 |
44 |
22 |
36 |
48 |
30 |
48 |
56 |
| USDJPY | Session is neutral % | 2 |
2 |
2 |
0 |
0 |
0 |
0 |
0 |
0 |
| USDJPY | Nothing executed % | 0 |
4 |
4 |
0 |
0 |
0 |
0 |
0 |
0 |
| EURUSD | Take Profit executed % | 100 |
72 |
64 |
68 |
62 |
54 |
76 |
66 |
62 |
| EURUSD | Stop Loss executed % | 0 |
28 |
36 |
32 |
38 |
46 |
24 |
34 |
38 |
| EURUSD | Session is neutral % | 0 |
0 |
0 |
0 |
0 |
0 |
0 |
0 |
0 |
| EURUSD | Nothing executed % | 0 |
0 |
0 |
0 |
0 |
0 |
0 |
0 |
0 |
| GBPJPY | Take Profit executed % | 72 |
62 |
54 |
72 |
66 |
50 |
78 |
64 |
56 |
| GBPJPY | Stop Loss executed % | 28 |
34 |
42 |
28 |
34 |
50 |
22 |
34 |
42 |
| GBPJPY | Session is neutral % | 0 |
0 |
0 |
0 |
0 |
0 |
0 |
0 |
0 |
| GBPJPY | Nothing executed % | 0 |
4 |
4 |
0 |
0 |
0 |
0 |
2 |
2 |
| NZDUSD | Take Profit executed % | 80 |
66 |
56 |
74 |
58 |
50 |
68 |
58 |
46 |
| NZDUSD | Stop Loss executed % | 20 |
34 |
42 |
24 |
40 |
48 |
30 |
40 |
52 |
| NZDUSD | Session is neutral % | 0 |
0 |
0 |
2 |
2 |
2 |
2 |
2 |
2 |
| NZDUSD | Nothing executed % | 0 |
0 |
0 |
0 |
0 |
0 |
0 |
0 |
0 |
Table 2. The final probabilities (%).
As we see, I haven't used large Take Profits - values were 5, 15, and 25 points.
Conclusions
One can see from the table 2, the talks that "The whole day trading depends on how the Asian session is traded" is wrong, at least for these 4 currency pairs for the last 50 days.
The probability of Take Profit execution with 5 points is near to 60-70%, in such a case I consider it as a probability of tossing a coin. IMHO.
For EURUSD there is 100% probability to Take Profit with 5 points. That is, if I have traded at 13.00 depending on the trend of the Asian session, during the last 50 days, with small 5 points Take Profit, I would always trade successfully. What can I say - it's a pity that I didn't know about it. For pips hunters the results can be used as additional information, the study with the deeper history (100 and more days) yields less unambiguous results.
The value of the Expert Advisor presented isn't only the fact that its results proved the absence of any dependence between the Asian and other sessions during the day. Some people try to find the trade relationships for some trade hours, now it can be performed without the tedious manual calculations.
The indicator TradeSession.mq4 (maybe somebody wants to use it in the client terminal) and Expert Advisor 1-Session.mq4 are attached.
Translated from Russian by MetaQuotes Ltd.
Original article: https://www.mql5.com/ru/articles/1575
Warning: All rights to these materials are reserved by MetaQuotes Ltd. Copying or reprinting of these materials in whole or in part is prohibited.
This article was written by a user of the site and reflects their personal views. MetaQuotes Ltd is not responsible for the accuracy of the information presented, nor for any consequences resulting from the use of the solutions, strategies or recommendations described.
 Easy Stock Market Trading with MetaTrader
 Applying One Indicator to Another
 How to Export Quotes from МetaTrader 5 to .NET Applications Using WCF Services
 The Price Histogram (Market Profile) and its implementation in MQL5
- Free trading apps
- Over 8,000 signals for copying
- Economic news for exploring financial markets
You agree to website policy and terms of use
It's an interesting idea. However, there seems to be a bug which affects your check for profit/loss.
Your indexing of the bar shift looks like it's wrong. You seem to be offseting the bars by an additional factor by using "j" and "PEREBOR". This is resulting in bars being skipped.
Example, if bar 20 was the bar for the close price, then you should be checking bars 19, 18, 17... It seems you are checking 19, 17, 15, ...
Adjusting it so that it checks every bar gives a totally different result. Not a better one!
I am following the comments everyone makes.
Excellent tool to see the probabilities of the certain chosen periods...but, I am not programmer.
Adjusted to 0400 (London open) and closed at 1700 (New York close) and adjusted to 16 pips profit forty-nine out of fifty trades, and provided the market is trending, seem to provide 98% indication of a positive trade result. If there is no certainty the trades were buys, but lets be presumptuous and believe yes - they are. That is remarkable information. If programmer slow down EA to trade a 15 min. and monitoring any trend change indicators, you may have a lucrative trade indicator to signal the open of trade.
Horse
Can you suggest a way to read this article please?
The text is so wide that one has to either keep scrolling for left to right or use cont - which makes the text too small to read.
I tried to modified your code, I want that the ea place an order when the price break the highest and lowest session(at london session)
but it does not work well