
Area method

Table of Contents
- Introduction
- 1. Generally accepted method of evaluating the RSI indicator
- 2. Area method
- 3. RSIAreaIndicator_v1
- 3.1. Creating a draft for an indicator
- 3.2. Filling the indicator header line
- 3.3. Editing the indicator's OnInit() function
- 3.4. Creating the additional indicator function
- 3.5. Creating the main operation code of the indicator
- 4. RSIAreaExpert version 1.00 — Expert Advisor
- 4.1. Editing the Expert Advisor's header line
- 4.2. Additional function — RSIAreaFunc
- 4.3. Code for testing CopyBuffer
- 4.4. Further editing of the additional function
- 4.5. Expert Advisor's OnTick() function
- 5. Testing RSIAreaExpert version 1.00 on different periods and symbols
- Conclusion
- Reference list
Introduction
How to set indicators and Expert Advisors at the end of this article correctly: "Indicators.zip" and "Experts.zip" archives must be unzipped and saved in <data catalog>\MQL5\
The description of the area method was first published in 2004 [1]. This method is fascinating due to its unusual perspective on the RSI indicator data: it suggests evaluating the area that the oscillator draws over/under the 50 line since its last intersection. Considering that markets went through drastic changes since 2004, and the MQL5 language was created, the time was ripe to check the strategy on the MQL5 language and the modern market.
1. Generally accepted method of evaluating the RSI indicator
A regular trading method based on the RSI indicator signals implies indicator evaluation with a view of overbuying/overselling, searching for divergence between indicator readings and the price, reversal after the indicator visits overbought/oversold areas, failure swing. Thus, at least four signals are used for the technical analysis of the RSI oscillator, and that complicates the decision making system.
We also know that the RSI indicator can't be in the overbought area (overs 70)/oversold area (under 30) for a long period of time – it will definitely return and cross the 50 middle line:

Fig. 1. The RSI oscillator always returns from the overbought/oversold areas
The fig. 1 shows that the total time the oscillator spent in the oversold/overbought areas is very insignificant in comparison with the rest of the time. Also, RSI crosses the 50 middle line after entering overbought/oversold areas. The fact that the RSI oscillator always returns and crosses the 50 line, and that the technical analysis of the RSI oscillator readings should be simplified formed the base for developing the area method.
2. Area method
The area method suggests evaluating readings of the RSI oscillator based on one criterion: the area formed by the oscillator over/under the 50 line. And this value will be used to describe the overbought/oversold level:

Fig. 2. Area method — evaluating area over/under 50
In this case, the signal for opening a position is the size of the area over/under the 50 line since its last intersection with the RSI indicator.
- When RSI is over the 50 line for a long period of time, and after it overcomes a certain area value (for example, 300), a SELL position is opened:

Fig. 3. Signal for opening a SELL position once the area reaches 300
-
Accordingly, when RSI is under the 50 line for a long time and after it overcomes a certain area value, a BUY position is opened.
A closing signal is generated when the RSI oscillator crosses the 50 line with subsequent formation of the local maximum/minimum and its rollback by the scale's value of 4%.
- For example, after being over the 50 line for a long time, at some point we get an open SELL position. Then, the indicator's value starts to decrease and reaches the 40 line, for example, after which the indicator's value starts to increase (i.e. the local minimum is formed). When the indicator's value reaches 44, this will become a signal for closing a position:

Fig. 4. Signal for closing a SELL position after the formation of the local minimum and a subsequent rollback of 4%
- Similar logic is applied when the indicator is under the 50 line for a long time. Only then we expect the formation of the local maximum.
RSIAreaIndicator will be used for assistance with visualizing the area over/under the 50 line.
3. RSIAreaIndicator_v1
The RSIAreaIndicator indicator is build on the basis of the RSI oscillator. The main difference is that RSIAreaIndicator has two buffers. One buffer has the construction style DRAW_HISTOGRAM, and the second buffer — DRAW_LINE. Buffer values are obtained using the formula
![]()
Appearance of RSIAreaIndicator version 1.00:

Fig. 5. RSIAreaIndicator _v1
3.1. Creating a draft for an indicator
I suggest placing indicators that you create in a separate folder. I have such folder called "MyInd". In order to begin with writing an indicator, a draft should be created in the MetaEditor code editor using MQL5 Wizard. The initial steps for creating a draft are described in this video:
You can view the created draft at the end of the article — the indicator is saved under the name "RSIAreaIndicatorStep1.mq5".
3.2. Filling the indicator header line
The next step involves adding a description of the indicator. Subsequently, it will always appear in the indicator properties in the "Common" tab. The entire added code will be highlighted throughout the article for a better visual perception:
#property version   "1.00"
#property description   "The indicator displays area RSI over/under line 50"
#property indicator_separate_window
From what we remember, the RSIAreaIndicator indicator has two indicator buffers. Apart from those, we will require an additional one. This way, there will be a total of three buffers used in the indicator. Let's begin editing the code from the indicator header line:
#property indicator_separate_window
#property indicator_buffers 3
#property indicator_plots   2
#property indicator_type1   DRAW_HISTOGRAM
#property indicator_type2   DRAW_LINE
#property indicator_color1  clrGray
#property indicator_color2  clrGray
//--- input parameters
input int      ExtRSIPeriod=13;
Now, we must declare three arrays that will store values of the indicator and additional buffers:
//--- input parameters
input int      ExtRSIPeriod=13;
//---- buffers
double ExtMapBuffer1[];
double ExtMapBuffer2[];
double ExtMapBuffer3[];
//+------------------------------------------------------------------+
//| Custom indicator initialization function                         |
Next, since our RSIAreaIndicator is calculated based on the standard RSI indicator, and we'll need to obtain indicator values, a variable for storing the handle of the Relative Strength Index indicator will be required:
double ExtMapBuffer3[];
//--- variable for storing the handle of the iRSI indicator
int    handle;
//+------------------------------------------------------------------+
//| Custom indicator initialization function                         |
And, finally, three service variables must be declared in the header line. The name variable will store the symbol's name where the indicator is launched, the short_name variable — the indicator's short name, and the bars_calculated variable — the amount of calculated bars in the RSI indicator:
int    handle;
//--- variable for storing
string name=Symbol();
//--- name of the indicator on a chart
string short_name;
//--- we will keep the number of values in the Relative Strength Index indicator
int    bars_calculated=0;
//+------------------------------------------------------------------+
//| Custom indicator initialization function                         |
The indicator header line is filled, so now we can proceed with editing the OnInit() function.
3.3. Editing the indicator's OnInit() function
Since we are writing the indicator, our indicator buffers must be linked with the double type dynamic arrays declared earlier:
int OnInit()
  {
//--- indicator buffers mapping
   SetIndexBuffer(0,ExtMapBuffer1,INDICATOR_DATA);
   SetIndexBuffer(1,ExtMapBuffer2,INDICATOR_DATA);
   SetIndexBuffer(2,ExtMapBuffer3,INDICATOR_CALCULATIONS);
//---
   return(INIT_SUCCEEDED);
Then, right after linking buffers with arrays, we will set the indexation of the array elements as in time series (there is a good example worth checking in ArraySetAsSeries). The rightmost array element will have "0" index:
   SetIndexBuffer(1,ExtMapBuffer2,INDICATOR_DATA);
   SetIndexBuffer(2,ExtMapBuffer3,INDICATOR_CALCULATIONS);
   ArraySetAsSeries(ExtMapBuffer1,true);
   ArraySetAsSeries(ExtMapBuffer2,true);
   ArraySetAsSeries(ExtMapBuffer3,true);
//---
   return(INIT_SUCCEEDED);
Now, let's define the rendering correctness — the indicator will be displayed with 2 decimal places:
   ArraySetAsSeries(ExtMapBuffer3,true);
//--- set accuracy
   IndicatorSetInteger(INDICATOR_DIGITS,2);
//---
   return(INIT_SUCCEEDED);
The following still remains to be done in the OnInit() function: to obtain the handle of the RSI indicator, to fill the short_name variable and to give our indicator a short name:
   ArraySetAsSeries(ExtMapBuffer2,true);
   ArraySetAsSeries(ExtMapBuffer3,true);
//--- set accuracy
   IndicatorSetInteger(INDICATOR_DIGITS,2);
   handle=iRSI(name,0,ExtRSIPeriod,PRICE_CLOSE);
//--- if the handle is not created
   if(handle==INVALID_HANDLE)
     {
      //--- notify about failure and output error code
      PrintFormat("Failed to create handle of the iRSI indicator for the symbol %s/%s, error code %d",
                  name,
                  EnumToString(PERIOD_CURRENT),
                  GetLastError());
      //--- the indicator is stopped early
      return(INIT_FAILED);
     }
//--- show the symbol/timeframe the RSI Area Indicator is calculated for
   short_name=StringFormat("RSIArea(%d)",ExtRSIPeriod);
   IndicatorSetString(INDICATOR_SHORTNAME,short_name);
//--- normal initialization of the indicator
   return(INIT_SUCCEEDED);
So, we have filled the indicator header line along with the OnInit() function. You can see the edited code at the end of the article — the indicator is saved under the name "RSIAreaIndicatorStep2.mq5".
3.4. Creating the additional indicator function
For the operation of RSIAreaIndicator, data from the RSI indicator must be obtained every time the OnCalculate() function is entered. It is equally important to provide conditions for easy code reading and to divide the functionality of the program. Therefore, the additional code for receiving RSI values and copying them in one of the RSIAreaIndicator buffers are moved to the separate function named FillArrayFromBuffer(). It will be placed after OnCalculate(). Values are copied using the CopyBuffer function.
//--- return value of prev_calculated for next call
   return(rates_total);
  }
//+------------------------------------------------------------------+
//| Filling indicator buffers from the iRSI indicator                |
//+------------------------------------------------------------------+
bool FillArrayFromBuffer(double &rsi_buffer[],  // indicator buffer of Relative Strength Index values
                         int ind_handle,        // handle of the iRSI indicator
                         int amount             // number of copied values
                         )
  {
//--- reset error code
   ResetLastError();
//--- fill a part of the iRSIBuffer array with values from the indicator buffer that has 0 index
   if(CopyBuffer(ind_handle,0,0,amount,rsi_buffer)<0)
     {
      //--- output error code if copying fails
      PrintFormat("Failed to copy data from the iRSI indicator, error code %d",GetLastError());
      //--- quit with zero result - it means that the indicator is considered as not calculated
      return(false);
     }
//--- all in order
   return(true);
  }
//+------------------------------------------------------------------+
3.5. Creating the main operation code of the indicator
The main operation code (or logic) of RSIAreaIndicator is located in the OnCalculate() function. The main variable values_to_copy is declared here. Subsequently, values_to_copy will store the number of values that must be copied from the RSI indicator.
                const int &spread[])
  {
//--- number of values copied from the iRSI indicator
   int values_to_copy;
//--- determine the number of values calculated in the indicator
   int calculated=BarsCalculated(handle);
   if(calculated<=0)
     {
      PrintFormat("BarsCalculated() returned %d, error code %d",calculated,GetLastError());
      return(0);
     }
//--- return value of prev_calculated for next call
   return(rates_total);
  }
Calculation of values_to_copy:
      PrintFormat("BarsCalculated() returned %d, error code %d",calculated,GetLastError());
      return(0);
     }
//--- if it is the first calculation of the indicator or if the number of values in the iRSI indicator changed
//---or if it is necessary to calculate the indicator for two or more bars (it means something has changed in the price history)
   if(prev_calculated==0 || calculated!=bars_calculated || rates_total>prev_calculated+1)
     {
      //--- if the iRSIBuffer array is greater than the number of values in the iRSI indicator for symbol/period, then we don't copy everything
      //--- otherwise, we copy less than the size of indicator buffers
      if(calculated>rates_total) values_to_copy=rates_total;
      else                       values_to_copy=calculated;
     }
   else
     {
      //--- it means that the indicator is calculated not for the first time, but since the last call of OnCalculate()
      //--- not more than one bar is added for calculation
      values_to_copy=(rates_total-prev_calculated)+1;
     }
//--- return value of prev_calculated for next call
   return(rates_total);
Why is values_to_copy calculated this specific way? In a MQL5 indicator the array elements (time[], open[], high[], low[], close[], tick_volume[], volume[] and spread[]) that are transferred to the OnCalculate() function, have indexation from the array's beginning to end. This is how it looks on the chart as an example:

Fig. 6. Indexation of array elements, if the array is not a time series
It means that the rightmost element will have a maximum index in the array that is not a time series. This must be considered when executing mathematical calculations.
Now that values_to_copy is calculated, you can call the additional function FillArrayFromBuffer(), and fill the indicator buffers ExtMapBuffer1[] and ExtMapBuffer2[] with values:
      //--- not more than one bar is added for calculation
      values_to_copy=(rates_total-prev_calculated)+1;
     }
//--- fill the array with values of the iRSI indicator
//--- if FillArrayFromBuffer returns false, it means the information is not ready yet, quit operation
   if(!FillArrayFromBuffer(ExtMapBuffer3,handle,values_to_copy)) return(0);
//---
   for(int i=0;i<values_to_copy;i++)
     {
      ExtMapBuffer1[i]=ExtMapBuffer2[i]=ExtMapBuffer3[i]-50.0;
     }
//--- memorize the number of values in the Relative Strength Index indicator
   bars_calculated=calculated;
//--- return value of prev_calculated for next call
   return(rates_total);
The RSIAreaIndicator version 1.00 is ready. You can download the indicator named "RSIAreaIndicatorv1.mq5" at the end of the article. Now, we can proceed with writing the RSIAreaEA version 1.00 Expert Advisor that is going to trade using the area method.
4. The RSIAreaExpert version 1.00 Expert Advisor
The same way as with indicators, I recommend moving the created Expert Advisors to a separate folder. For example, my folder for Expert Advisors is called "MyExp". By analogy with the indicator, we will create a draft for the RSIAreaExpert_v1 Expert Advisor. Important clarification: all options must be unticked at one of the steps:
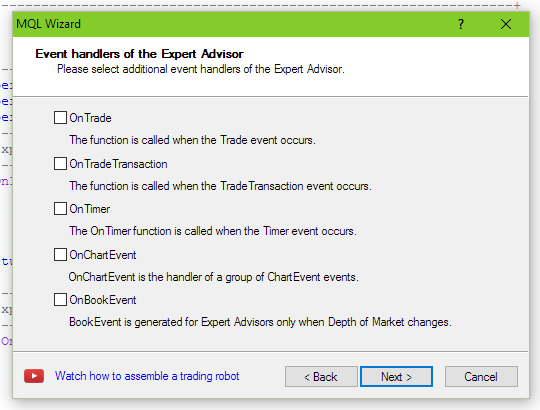
Fig. 7. Settings for creating Expert Advisor
The obtained draft of the Expert Advisor can be found at the end of the article — the Expert Advisor is named "RSIAreaExpert_v1_Step1.mq5".
4.1. Editing the Expert Advisor's header line
Let's add the Expert Advisor's description. It will appear in the "Common" tab of the Expert Advisor:
#property version   "1.00"
#property description "EA trades on \"Method areas\""
//+------------------------------------------------------------------+
//| Expert initialization function                                   |
Writing a description straightaway may seem like a nuisance, but, eventually, doing so would be a great help to you.
The Expert Advisor will use the standard library (the CTrade class) for trading. For this purpose, the CTrade class will have to be included and the my_trade variable will be declared:
#property description "EA trades on \"Method areas\""
#include <Trade\Trade.mqh>
//--- global variables
CTrade      my_trade;
//+------------------------------------------------------------------+
//| Expert initialization function                                   |
We will also add three variables (to store the handle of the Relative Strength Index indicator, the current calculated area and one auxiliary variable):
//--- global variables
CTrade      my_trade;
int         handle;     // variable for storing the handle of the iRSI indicator
double      RSIArea;    // the calculated area
double      RSIOpen;    // the auxiliary variable
//+------------------------------------------------------------------+
//| Expert initialization function                                   |
And the last step for editing the header of the Expert Advisor includes adding input parameters:
double      RSIOpen;    // the auxiliary variable
//--- input parametres
input int   ExtRSIPeriod=13;    // period of RSI
input int   AreaCondition=300;  // area
input ENUM_TIMEFRAMES period=PERIOD_M15;
//+------------------------------------------------------------------+
//| Expert initialization function                                   |
The period variable is introduced only for convenience of testing in the strategy tester — this way we can set various ranges of tested periods:
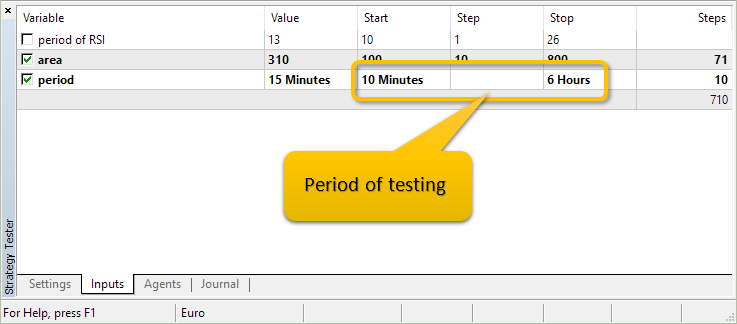
Fig. 8. The period variable allows testing the Expert Advisor in a wide range of periods
The Expert Advisor's header is filled, so it's the turn to switch to the OnInit() function. OnInit() will have just one operation — receiving the indicator's handle at a current symbol (Symbol()) and at a given period (period):
int OnInit()
  {
//---
   handle=iRSI(Symbol(),period,ExtRSIPeriod,PRICE_CLOSE);
//--- if the handle is not created
   if(handle==INVALID_HANDLE)
     {
      //--- notify about failure and output error code
      PrintFormat("Failed to create handle of the iRSI indicator for the symbol %s/%s, error code %d",
                  Symbol(),
                  EnumToString(period),
                  GetLastError());
      //--- the indicator is stopped early
      return(INIT_FAILED);
     }
//---
   return(INIT_SUCCEEDED);
  }
All changes in the process of editing the Expert Advisor can be seen in the file "RSIAreaExpert_v1_Step2.mq5".
4.2. Additional function RSIAreaFunc
The function of determining the RSIAreaFunc() area consists of several functional parts. We will be adding the functionality gradually. The first block (explanation after the code):
void OnTick()
  {
//---

  }
//+------------------------------------------------------------------+
//| Area calculation                                                 |
//+------------------------------------------------------------------+
double RSIAreaFunc(int &RSIAreaShift,int BeginShift)
  {
   int    shift,limit;
   double rsivalue,result;
//--- get current RSI
   limit=Bars(Symbol(),period)-ExtRSIPeriod;
   if(limit>100)
      limit=100;
   double   arr_rsi[];
   ArrayResize(arr_rsi,limit);
   ArraySetAsSeries(arr_rsi,true);
   if(CopyBuffer(handle,0,0,limit,arr_rsi)==-1)
     {
      Print("CopyBuffer from iRSI failed, no data");
      return(0);
     }
   return(result);
  }
The limit variable is responsible for the amount of the iRSI indicator values we are going to copy to the arr_rsi[] array using CopyBuffer. We are going to restrict the limit variable to "100" — i.e. we'll always copy the last 100 values of the iRSI indicator. Changes of editing the Expert Advisor can be seen in "RSIAreaExpert_v1_Step3.mq5".
4.3 Code for testing CopyBuffer
If you are not entirely sure how CopyBuffer operates and what the values contained in the array under "0" index are, then you can write a simple testing code: we'll write a call of the additional RSIAreaFunc() function in OnTick().
void OnTick()
  {
//---
   static int RSIAreaShift=0;
   RSIAreaFunc(RSIAreaShift,0);
  }
//+------------------------------------------------------------------+
//| Area calculation                                                 |
//+------------------------------------------------------------------+
double RSIAreaFunc(int &RSIAreaShift,int BeginShift)
At the end of the first block of the RSIAreaFunc() function we will add the comment display — values of initial and final elements of arr_rsi[]array:
   if(CopyBuffer(handle,0,0,limit,arr_rsi)==-1)
     {
      Print("CopyBuffer from iRSI failed, no data");
      return(0);
     }
//---
   Comment("arr_rsi[",limit-1,"]=",DoubleToString(arr_rsi[limit-1],2),
           "; arr_rsi[0]=",DoubleToString(arr_rsi[0],2));
   return(result);
  }
This is a testing code which is added only to RSIAreaExpert_v1_Step3_check.mq5, and it won't be present in the main Expert Advisor. The following needs to be performed for testing purposes:
- compile (if it hasn't been done yet) the Expert Advisor's file — RSIAreaExpert_v1_Step3_check.mq5;
- open a new chart of any instrument and change the time frame to M15 (as by default input parameters have the period=PERIOD_M15);
- place the RSI indicator on the chart (menu "Insert" -> "Indicators" -> "Oscillators" -> "Relative Strength Index" with settings: "Period" 13 and "Apply to" Close);
- add RSIAreaExpert_v1_Step3_check.mq5 Expert Advisor to the chart.
The chart will instantly show that the element with "0" index in the arr_rsi array corresponds to the RSI indicator's value at the rightmost bar:

Fig. 9. Testing CopyBuffer
4.4. Further editing of the additional function
The next block of the RSIAreaFunc() function:
   if(CopyBuffer(handle,0,0,limit,arr_rsi)==-1)
     {
      Print("CopyBuffer from iRSI failed, no data");
      return(0);
     }

   result=arr_rsi[0]-50.0; // values from the bar that has 0 index

   for(shift=BeginShift+1;shift<limit;shift++)
     {
      rsivalue=arr_rsi[shift]-50;
      if((result>0 && rsivalue<-3) || (result<0 && rsivalue>3))
        {
         RSIAreaShift=shift;
         break;
        }
      result+=rsivalue;
     }
   return(result);
  }
First, the result variable is assigned the RSI indicator's value at the rightmost bar minus 50. Then, it is followed by the loop of the arr_rsi array, starting from the element with "1" index up to the element with limit-1 index. The following condition is checked in this loop: "Was there any intersection with a zero line?". In case of an intersection, the bar's index (calculated from right to left) is saved in the RSIAreaShift variable.
4.5. Expert Advisor's OnTick() function
We have finished editing the additional function RSIAreaFunc() and can move on to the main trading function OnTick(). Let's add the following code to OnTick():
//+------------------------------------------------------------------+
//| Expert tick function                                             |
//+------------------------------------------------------------------+
void OnTick()
  {
//---
   static int RSIAreaShift=0;
   int      shift;
   double   RSICurrent,RSILocalMin,RSILocalMax,value;
   double   arr_rsi[1],rsi;
   MqlTick  last_tick;
//---
   if(CopyBuffer(handle,0,0,1,arr_rsi)==-1)
     {
      Print("CopyBuffer from iRSI failed, no data");
      return;
     }
   rsi=arr_rsi[0];
//---
   if(!SymbolInfoTick(Symbol(),last_tick))
      Print("SymbolInfoTick() failed, error = ",GetLastError());
//---
  }
Using the CopyBuffer function that we are already familiar with, we obtain one value of the RSI indicator at the rightmost bar, and then assign it to the rsi variable. We will be referring to this variable multiple times in the code. Then we are going to obtain current prices from this symbol and store them in the last_tick variable.
The next block of the code is processed provided that we have an open position for this instrument:
   if(!SymbolInfoTick(Symbol(),last_tick))
      Print("SymbolInfoTick() failed, error = ",GetLastError());
//--- check the conditions for opening a position
   if(!PositionSelect(Symbol()))
     {
      RSIArea=RSIAreaFunc(RSIAreaShift,0);
      //--- check for a chance to take a long position
      if(RSIArea<-AreaCondition)
        {
         my_trade.Buy(1.0,NULL,last_tick.ask,0.0,0.0,NULL);
         RSIOpen=rsi;
         return;
        }
      //--- check for a chance to take a short position
      if(RSIArea>AreaCondition)
        {
         my_trade.Sell(1.0,NULL,last_tick.bid,0.0,0.0,NULL);
         RSIOpen=rsi;
         return;
        }
      RSIAreaShift=0;
     }
//---
  }
//+------------------------------------------------------------------+
//| Area calculation                                                 |
Conditions for opening a position are checked in the code: if the area calculated at this point ( RSIArea variable) is less/greater than an input parameter (AreaCondition), then, accordingly, Buy/Sell position will be opened.
The RSICurrent variable is assigned the rsi variable value (let me remind you that it stores one value of the RSI indicator on the rightmost bar), and the conditions for exiting from the OnTick() function are checked:
- if a position was opened over the "50" line (RSIOpen>50), and we are currently over the "50" line (RSICurrent>50);
- if a position was opened under the "50" line (RSIOpen<50), and we are currently under the "50" line (RSICurrent<50):
      RSIAreaShift=0;
     }
   RSICurrent=rsi;
   if(RSIOpen>50 && RSICurrent>50) return;
   if(RSIOpen<50 && RSICurrent<50) return;

   RSILocalMin = RSICurrent;
   RSILocalMax = RSICurrent;

//---
  }
//+------------------------------------------------------------------+
//| Area calculation                                                 |
The next code block finds local minimums/maximums and assigns these values to RSILocalMin and RSILocalMax variables:
   RSILocalMin = RSICurrent;
   RSILocalMax = RSICurrent;

//--- search local minimum/maximum
   if(RSIAreaShift>1)
     {
      double   arr_rsi_1[];
      ArrayResize(arr_rsi_1,RSIAreaShift);
      ArraySetAsSeries(arr_rsi_1,true);
      if(CopyBuffer(handle,0,0,RSIAreaShift,arr_rsi_1)==-1)
        {
         Print("CopyBuffer from iRSI failed, no data");
         return;
        }
      for(shift=1; shift<RSIAreaShift; shift++)
        {
         value=arr_rsi_1[shift];
         if(value<RSILocalMin && RSIArea>0) RSILocalMin=value;
         if(value>RSILocalMax && RSIArea<0) RSILocalMax=value;
        }
     }
//---
  }
//+------------------------------------------------------------------+
//| Area calculation                                                 |
And, finally, the last block of the code:
         if(value>RSILocalMax && RSIArea<0) RSILocalMax=value;
        }
     }

//--- check for rollback
   if(PositionSelect(Symbol()))
     {
      if(PositionGetInteger(POSITION_TYPE)==POSITION_TYPE_BUY)
        {
         //--- check if it is time for closing
         if(RSILocalMax>=RSICurrent+4 && RSILocalMax>50)
            my_trade.PositionClose(Symbol(),20);
        }
      if(PositionGetInteger(POSITION_TYPE)==POSITION_TYPE_SELL)
        {
         //--- check if it is time for closing
         if(RSILocalMin<=RSICurrent-4 && RSILocalMin<50)
            my_trade.PositionClose(Symbol(),20);
        }
     }
//---
   return;
  }
//+------------------------------------------------------------------+
//| Area calculation                                                 |
If there is an open position, the condition for closing the position under the rule is checked here:
The RSI oscillator crosses the 50 line with subsequent formation of the local maximum/minimum and its rollback by the scale's value of 4%.
For example, after being over 50 for a long time, at some point we will obtain an open SELL position. Then, the indicator's value is beginning to decrease and reaches 40, for example, following which the indicator's value begins to increase (i.e. a local minimum is formed). The moment when the indicator's value reaches 44 will be a signal for closing a position.
The creation of the RSIAreaExpert_v1 Expert Advisor is finished at this stage. The "RSIAreaExpert_v1.mq5" file can be downloaded at the end of this article.
5. Testing RSIAreaExpert version 1.00 on different periods and symbols
Testing the RSIAreaExpert Expert Advisor was initially performed on the period of the H1 [1] chart, but markets have drastically changed since 2004 becoming more volatile, therefore, it was decided to test on a greater range of periods from M10 to H6 in order to check the efficiency of the area method. Also, the area size for testing was significantly increased from 100 to 800. Testing period is from 2015.01.05 to 2016.01.05.
So, these are the results for testing the RSIAreaExpert version 1 Expert Advisor for the AUDCAD symbol:

Fig. 10. Results for testing the RSIAreaExpert version 1 Expert Advisor. AUDCAD Symbol. Area interval 100-800. Period interval M10-H6
We see a great density of results on H2 period. H3 period also can be taken into consideration. Now, let's look at the figure below and evaluate the number of trades for AUDCAD over the year while testing the RSIAreaExpert version 1 Expert Advisor:

Fig. 11. Results of testing the RSIAreaExpert version 1 Expert Advisor. AUDCAD Symbol. Area interval 100-800. Period interval M10-H6
The number of trades on H2 and H3 periods throughout the year reaches 50. It is not a lot, and the error is high. Therefore, we can conclude that the area method doesn't work well with AUDCAD.
The results of testing the RSIAreaExpert version 1 Expert Advisor for AUDUSD:

Fig. 12. Results of testing the RSIAreaExpert version 1 Expert Advisor. AUDUSD symbol. Area interval 100-800. Period interval M10-H6
When considering the strategy's profitability with AUDUSD, trading on H2 and H3 periods applies. The AreaCondition parameter on these periods fluctuates from 250 to 400. To justify trading on H2 and H3 periods, you must see the number of trades on these periods throughout the year:

Fig. 13. Results of testing the RSIAreaExpert version 1 Expert Advisor. AUDUSD symbol. Area interval 100-800. Period interval M10-H6
As we see, it is dramatically low. So, it's not recommended to use the area method for trading on AUDUSD.
Results of testing the RSIAreaExpert version 1 Expert Advisor for the EURUSD symbol:

Fig. 14. Results for testing the RSIAreaExpert Expert Advisor. Area interval 100-800. Period interval M10-H6
The fig. 4 reveals a good density of profit results for M10 period when the area ranges from 400 to 550, for the M12 period — from 300 to 400, and for the M15 period — from 300 to 400. The higher periods are not considered, because the number of their trades over the year is too small (see fig. 5).
Fig. 5 reveals the chart of dependencies of the amount of trades and profit for EURUSD:

Fig. 15. Results for testing the RSIAreaExpert Expert Advisor. Area interval 100-800. Period interval M10-H6
It clearly shows here that the number of trades is minor on high periods (from H1 to H6), and that questions the justification of applying the area method on such periods. However, the number of trades on the periods M10, M12 and M15 is sufficient for the confirmation of the area method profitability on these time frames. EURUSD is definitely suitable for trading based on the area method.
Results of testing the RSIAreaExpert version 1 Expert Advisor for GBPUSD:

Fig. 16. Results of testing the RSIAreaExpert version 1 Expert Advisor. GBPUSD symbol. Area interval 100-800. Period interval M10-H6
There is a good density of positive profit for M20 period on GBPUSD. The AreaCondition parameter varies from 300 to 500.

Fig. 17. Results of testing the RSIAreaExpert version 1 Expert Advisor. GBPUSD symbol. Area interval 100-800. Period interval M10-H6
The amount of trades for GBPUSD on M20 period ranges from 140 to 250 throughout the year. This rate is not fantastic, however, can be considered. In other words, trading on GBPUSD using the area method is not suitable for everybody.
Results for testing the RSIAreaExpert version 1 Expert Advisor for the USDCAD symbol:
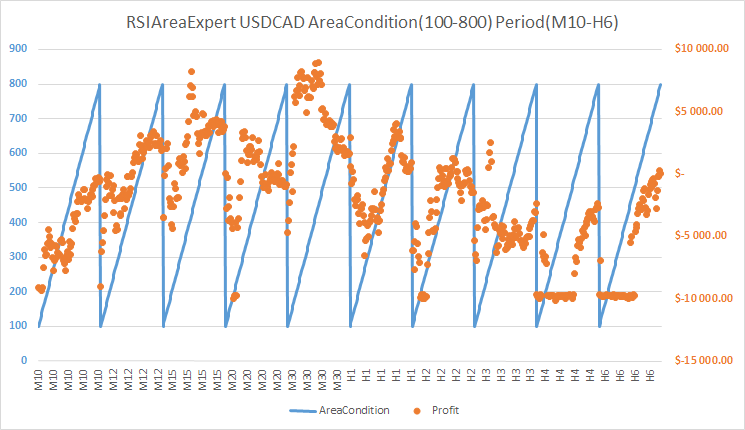
Fig. 18. Results of testing the RSIAreaExpert version 1 Expert Advisor. USDCAD symbol. Area interval 100-800. Period interval M10-H6
For USDCAD symbol I would consider only the M30 period, since a good density of positive profit is marked only there. At the same time, the AreaCondition parameter changes in the range of 280 to 550.

Fig. 19. Results of testing the RSIAreaExpert version 1 Expert Advisor. USDCAD symbol. Area interval 100-800. Period interval M10-H6
The number of yearly trades on this currency pair by the M30 time frame varies from 90 to 200. That is not a lot, so I wouldn't recommend the area method for USDCAD.
Results of testing the RSIAreaExpert version 1 Expert Advisor for the USDJPY symbol:

Fig. 20. Results of testing the RSIAreaExpert version 1 Expert Advisor. USDJPY symbol. Area interval 100-800. Period interval M10-H6
Two periods M10 and M30 are distinguished on the USDJPY symbol. The AreaCondition parameter for M10 period stays within 320-650, for M30 period — 550-600.

Fig. 21. Results of testing the RSIAreaExpert version 1 Expert Advisor. USDJPY symbol. Area interval 100-800. Period interval M10-H6
The number of trades using the area method for the USDJPY symbol is within 150-200, and for the M30 period — within 50-150 throughout the year. Thus, we see that trading recommendations are rather vague here.
Conclusion
It turns out that trading based on the area method wasn't ready to be put out to pasture. In fact, the system started showing losses on the H1 period at the current market conditions, however, previously [1] it used to hold the main profit. Trading EURUSD on M10, M12 and M15 periods using the area method proved to be the most profitable and efficient on the modern market. Testing showed a sufficient number of yearly trades with this particular currency pair.
References list
- Morozov I. V., Fatkhullin R.R. FOREX: from simple to complex. New opportunities of "MetaTrader" client terminal. - "Teletrade LTD", 2004. - 448 p.
Translated from Russian by MetaQuotes Ltd.
Original article: https://www.mql5.com/ru/articles/2249
Warning: All rights to these materials are reserved by MetaQuotes Ltd. Copying or reprinting of these materials in whole or in part is prohibited.
This article was written by a user of the site and reflects their personal views. MetaQuotes Ltd is not responsible for the accuracy of the information presented, nor for any consequences resulting from the use of the solutions, strategies or recommendations described.

 Universal Expert Advisor: the Event Model and Trading Strategy Prototype (Part 2)
 Universal Expert Advisor: Trading Modes of Strategies (Part 1)
 MetaTrader 5 features hedging position accounting system
 Graphical Interfaces II: the Separation Line and Context Menu Elements (Chapter 2)
- Free trading apps
- Over 8,000 signals for copying
- Economic news for exploring financial markets
You agree to website policy and terms of use
I didn't understand from the article how exactly the area is calculated? Can I see the code and mathematical formula?
I may have missed something, I apologise if so....
I didn't understand from the article how exactly the area is calculated? Can I see the code and mathematical formula?
I may have missed something, I apologise if so....
The area is calculated by approximation, by the method of rectangles. But under one condition - the width of such a rectangle is equal to "1".
Thank you - the idea is clear. Can you show the algorithm with a step-by-step description?
For EA from 4.2 onwards. Auxiliary function RSIAreaFunc
For EA from 4.2 onwards, auxiliary function RSIAreaFunc
To be honest, I don't see it in the code - I see the search for extrema, but not the area....