
Equivolume Charting Revisited

Introduction
The idea of accounting for volumes when constructing a chart was expressed already in 1871 by Richard W., Jr. Arms in his book "Profits in Volume, Equivolume Charting". Bars on charts constructed using his method had different width - the larger the volume is, the wider the bar is.
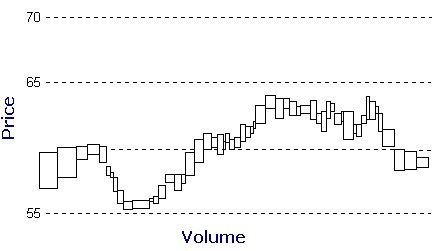
Fig.1 Example of an Equivolume Chart
Really, technical analysis, especially relating to stock markets, accounts not only for the price, but also for the volume of trades. There are numerous indicators and forecast methods based on the analysis of volumes. So, in addition to them equivolume charts were created.
In conditions of Forex markets where a trader does not possess information about the real volume of trades, the assert of using equivolume charts is rather doubtful. Like many other methods of technical analysis, the analysis of volumes is less effective than for stock markets several decades ago. Still, this does not in any way hinder those who try to find regularities that will help to gain stable profit in this unstable market.
The purpose of this article is adding one more very useful tool - equivolume charting. Please note that the implemented equivolume charting is different from the one described by Richard Arms. In our case it will consist in balancing bars by constructing them from the same number of ticks. Thus a bar will be calculated not in time (the number of minutes), but in the number of price changes.
First Stage - Collecting Ticks
First we need to collect the necessary tick history - it will be used for constructing charts. It would be unpractical to build only on-line charts - we would lose the possibility of analyzing history. That is why the first stage of the implementation of equivolume charts is collecting ticks.
All we need here is downloading and starting a tick collector (TickSave). This Expert Advisor will save ticks for all necessary securities in csv-files. Our "chart builder" will use the information from these files.
Unfortunately not everyone has the possibility of having a computer always switched on and connected to the internet with TickSave running. I would like to offer a way of solving the problem. Of course, we will not have fully updated charts with the up-to-date information. But we will get the opportunity of analyzing charts updated manually.
So, for building an equivolume chart without having available ticks we need to:
- download a tick history of a necessary security from one of free sources (for example, gaincapital.com or fin-rus.com);
- convert it into a form suitable for an Expert Advisor - "YYYY.MM.DD HH:MM:SS;Bid" (manually or using a special program-converter (perhaps I will write it later));
- save the file(s) with such ticks into a necessary directory - "path_to_terminal\experts\files\[Ticks]\Server name\";
- rename it according to the pattern - "Symbol_Year.Month. csv".
Ticks for several months (years) can be stored in one file, for example "EURUSD_2008.01.csv". The date in the file name differs from its content, but it is ok, because the date is needed for the "chart builder" to be able to find this file.
So, after all this we have the tick history. Now let's see how to use it.
Second Stage - Constructing a Chart
Now when we have "construction material", we can start constructing charts.
It is not too much more difficult than arranging the collection of ticks:
- Download the Expert Advisor EqualVolumeBars into the directiry "MetaTrader 4\experts", open it and compile (F5).
- Open the chart of the security, for which you want to build an equivolume chart (and which ticks you have). The chart period does not matter.
- Start the Expert Advisor on the open chart, indicating the necessary values of external variables:
- TicksInBar - number of ticks in a bar;
- StartYear and StartMonth - year and month - the starting date of your tick history (is used in file searching);
- Wait for a recording in the Journal (in the tab "Expert Advisors"):
2008.01.11 02:22:13 EqualVolumeBars EURUSD,M5: < - - - To view results, open the chart "!EqvEURUSDn" - - - >
- Finally, open the file indicated in the record (instead of the last 'n' you will see the value TicksInBar) using the command "Work Offline" in the menu "File".
Results
The result of the EA's operation is a constantly updated non-standard history file. After a chart is opened, the EA updates it, i.e. you can work with it as with a normal chart (though with some exceptions) - new quotes are displayed automatically.
For the visualization of results, I downloaded the history form gaincapital.com (unfortunately I do not have any collected by myself). It took no more than 20 minutes to formate and combine the information into files. You may also download ready tick archives attached to this article. All you need in this case is to save them into a necessary directory.
Below you can see equivolume charts of EURUSD for November and December 2007. The "period" of charts (number of ticks in a bar) was selected arbitrarily, figures are not based either on the analysis of an average number of ticks for a certain period or on any other data. This article was not aimed at developing a method of choosing the "period" of charts or ways of analyzing information; we only wanted to create a tool.
You can see the result either on the charts below or in your own terminal after making some amendments.
Fig.2 Equivolume Chart. 5 Tcks in a Bar.
Fig.3 Equivolume Chart. 10 Ticks in a Bar.
Fig.4 Equivolume Chart . 25 Ticks in a Bar.
Fig.5 Equivolume Chart . 50 Ticks in a Bar .
Fig.6 Equivolume Chart . 100 Ticks in a Bar .
Fig.7 Equivolume Chart . 250 Ticks in a Bar .
Fig.8 Equivolume Chart . 500 Ticks in a Bar .
Fig.9 Equivolume Chart . 1000 Ticks in a Bar .
Also, by indicating the value 1 of the variable TicksInBar, you nay get a tick chart with one tick in a bar:
Fig.10 Equivolume Chart. 1 Tick in a Bar .
What is important, the described system provides both for displaying and storing ticks. Thus the tick chart becomes a full-value tool for a trader.
Peculiarities of the Expert Advisor EqualVolumeBars
When working with history files I noticed some "peculiarities" that hinder acquiring wanted results directly. Unfortunately the file formate 'hst' is not enough documented and the algorithms of checking history files by the terminal are not enough explained. So I had to study this topic using the so called "rule of thumb".
During the process of developing and testing the Expert Advisor EqualVolumeBars I found one of the criteria of checking history files: a chart cannot contain two bars with the same time. When working with ticks (especially at small values of the variable TicksInBar) often several bars with the same time appeared on the chart. The problem has a simple solution: time written into the created file (and therefore displayed om the chart) was modeled. And while the truth of the displayed time was disturbed, I decided to make it conditional - on all generated charts the period starts from 1970.01.01 00:00, and each bar is the next minute. Holidays are not taken into account.
One more peculiarity is the omission of ticks.
After reading tick history from the files, the Expert Advisor continues working in the usual mode - it starts when a new quote is received and adds it onto the equivolume chart. MetaTrader 4 Terminal has the following feature: if an Expert Advisor has not finished processing the previous tick, it will omit the next tick. Thus the equivolume chart (especially with a small period) can contain some distortions - omitted prices.
I had the following example: a bar with all prices equal (O=H=L=C) appeared on a two-tick chart. And it cannot appear on a two-tick bar, because the condition of bar formation is price changing. I suppose the EA omitted a tick between the two equal prices and we got a bar of one price but two ticks.
Well, such cases are very rare and distortions will be visible only at small "periods". But the problem exists and you should be aware of it.
And the last thing I would like to tell you is a very obvious one - when the reference time is changed, the equivolume history also changes.
For example, you analyzed a chart starting in December 2007. Then you want to see more and download the tick history for November and recalculate the chart. The number of ticks in November can be not multiple of the selected "period". As a result the displaying of the December chart will change.
Well, actually it is not a problem, it's just a peculiarity. But do not forget about it.
Conclusion
In this article we analyzed the process of creation of equivolume charts - charts with bars consisting of the equal number of ticks.
The article includes examples of working with a ready tick history and the description of the process of setting up constantly updated charts.
It also contains the description of peculiarities that should be taken into account when working with the Expert Advisor EqualVolumeBars.
I hope this article has presented to you a convenient tool and will give you some food for thought.
Translated from Russian by MetaQuotes Ltd.
Original article: https://www.mql5.com/ru/articles/1504
Warning: All rights to these materials are reserved by MetaQuotes Ltd. Copying or reprinting of these materials in whole or in part is prohibited.
This article was written by a user of the site and reflects their personal views. MetaQuotes Ltd is not responsible for the accuracy of the information presented, nor for any consequences resulting from the use of the solutions, strategies or recommendations described.

 Using MetaTrader 4 for a Time Based Pattern Analysis
 Betting Modeling as Means of Developing "Market Intuition"
 An Expert Advisor Made to Order. Manual for a Trader
 MQL4 Language for Newbies. Custom Indicators (Part 2)
- Free trading apps
- Over 8,000 signals for copying
- Economic news for exploring financial markets
You agree to website policy and terms of use
Nice work indead but I think there's just one problem with this: a tick is a measure of time, it's not a measure of distance: Let's not confuse ticks with pips: a tick is simply the next price, a pip is the minimum price change possible (e.g. 1 pip in EUR/USD is 1/10.000 of 1 euro). A 50 pip tick (like on the monthly non-farm payrolls anouncement) is perfectly possible (which means that the next price level compared to the previous one is 50 points/pips higher).
So instead of expressing the candles as a number of ticks (like 20 ticks in this example), wouldn't it be better to use it as a new sort of timeframe that doesn't close the bar untill the next one is (e.g.) 20 PIPS lower or higher than the first price of the bar or the last price of the previous bar?
Sorry, but you did not get the point. Please read the article again :D
You talk about different charting method, with fixed size (i.e. 20 pips) for candles, that exists already, is called Renko charting and it is not subject of this article. This article is about EV charting. And yes, if next tick is 50 pips long, you WILL have a 50 pips bar in your EV chart.
Peace!
Hi,
This is great work, most of MT4 user were looking for ticks charts based, now its ready :)
I have one more question;
1. Let say, after downloading the data from gain server for the first time, then we compile it, and follow your steps, we should be able to get the ticks chart (100 ticks chart) real-time with historical data (from gain server). What will happen if we close MT4 and re-open it back the next day, do we still need to re-download the ticks data from gain server and apply them agian and again?