

Adaptive Spread Monitoring and Order Gating in MQL5
 289
289
 0
0

Introduction
Most spread guards in an Expert Advisor work the same way: check the current spread against a fixed number and block the trade if it is too wide. This catches some bad fills, but it treats every instrument as if the same spread value means the same thing everywhere.
A spread of 3 pips on an instrument that normally trades at 1 pip is a genuine anomaly. That same 3-pip spread on an instrument that normally sits at 3 pips is completely ordinary. A static threshold cannot tell the difference.
The fix is to compare the live spread not to a constant but to the instrument's own recent distribution. This article builds that comparison. It introduces CSpreadHistogram, a rolling histogram accumulator that tracks what spread values are typical for an instrument in real time, and CSpreadMonitor, which manages several symbols and exposes a simple order gate. A CDashboardRenderer provides a live visual panel built on MQL5's CCanvas class, and SpreadMonitorDemo.mq5 ties everything together. No external DLLs are used.
Section 1: The Spread as an Execution Cost
The bid-ask spread is baked directly into the price at which a market order fills. A market buy fills at Ask. The position is immediately marked against Bid, since that is the price at which it could be closed right away. The gap between the two is an unrealized loss the position carries from the instant it opens.
Expressed in points:
spread_pts = (Ask - Bid) / Point For a strategy with an expected return of 5 pips per trade, the impact is direct. At 1 pip of spread, the strategy keeps 4 pips of edge. At 3 pips, it keeps only 2. At 5 pips, the entire expected edge is consumed before the market has moved at all. A monitor that can recognize "this is currently an expensive moment to trade" addresses a risk that exists independently of, and prior to, any improvement in entry logic.
Section 2: Why Static Thresholds Fail and What Replaces Them
Consider two instruments. EURUSD typically trades around 0.5 pips. GBPJPY typically trades around 1.5 pips. Both are gated by the same static threshold of 2 pips.
On EURUSD, a spike to 3 pips gets blocked correctly — three pips is six times normal. But on GBPJPY, the same threshold produces two failures at once: it blocks perfectly ordinary trading because GBPJPY's normal spread sits close to the line, while simultaneously letting through a spread of 1.8 pips without complaint, even though 1.8 is 20% above that instrument's own normal level.
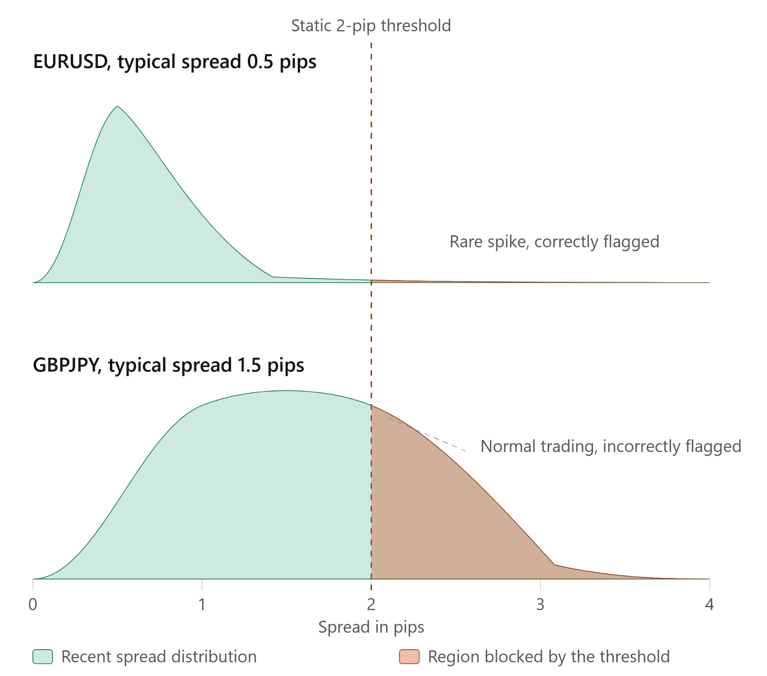
The same 2-pip threshold (dashed line) applied to two instruments. Orange shows what gets blocked. For EURUSD (top), most trading sits well below 2 pips, so only rare spikes are blocked, correctly. For GBPJPY (bottom), normal spreads cluster right around 2 pips, so the same line blocks routine trading. One fixed number cannot fit both.
The fix is to compare the live spread against the instrument's own recent distribution. A histogram accumulator makes this efficient. The observed spread range is split into a fixed number of equally spaced bins. Each new tick increments the counter for the bin it falls in. A percentile is estimated by scanning bins from the left and accumulating counts until the running total reaches the target fraction of all observations. Both updates and queries run in bounded time regardless of how much data has been collected.
A histogram that only accumulates and never forgets has its own problem: a spike from months ago would still influence today's estimates. The fix is a rolling window built on a circular buffer that stores the bin index of each observation. When a new tick arrives, the bin for the observation being evicted is decremented first, keeping the histogram synchronized to exactly the last N ticks at constant cost per update.
Percentile rank is defined formally as:
percentile_rank(s) = (number of observations <= s) / total_observations * 100 Once percentile rank is available, a three-level classification provides operational nuance:
- GREEN: current spread ranks at or below the normal threshold (e.g. 75th percentile)
- YELLOW: elevated but not yet severe enough to block
- RED: above the alert threshold — order submission stops
A fourth state, WARMING, is worth keeping separate. Before the rolling window has accumulated enough observations, any percentile estimate is unreliable. Labeling that condition the same as a genuine anomaly would make a freshly attached EA look like it is trading through constant spread spikes. Keeping WARMING distinct means "not enough data yet" is immediately distinguishable from "something is actually wrong."
Section 3: The Histogram Accumulator and Rolling Window
The histogram's bin width is derived once at initialization:
bin_width = (max_spread - min_spread) / num_bins
Mapping a raw spread to a bin index is a single division and clamp. The rolling window stores the bin index of each observation, not the raw value, since only the index is needed to reverse an observation's effect once it ages out.
Percentile queries scan the bin array once, accumulating a running count. Percentile estimation stops when the count first reaches the target fraction of observations. Percentile rank sums counts up to and including the query bin and reports the fraction of total. Both cost O(bins), not O(window size) — far cheaper than sorting the raw window on every tick.
The defaults used here — 50 bins, a 5,000-tick window, a 0-to-50-point spread range — suit a typical FX major or cross on a standard variable-spread feed. Fifty bins over a 50-point range gives one-point resolution. A 5,000-tick window on an actively traded pair typically spans a few minutes to roughly an hour of trading.
Section 4: Implementation — SpreadHistogram.mqh
CSpreadHistogram is the lowest-level building block. It owns one instrument's rolling spread distribution and answers percentile queries against it. It has no knowledge of symbols, order gating, or coordination across instruments.
//+------------------------------------------------------------------+
//|                                            SpreadHistogram.mqh   |
//+------------------------------------------------------------------+
#ifndef SPREADHISTOGRAM_MQH
#define SPREADHISTOGRAM_MQH
//+------------------------------------------------------------------+
//| Class CSpreadHistogram                                           |
//| Rolling histogram accumulator for tick-level spread observations |
//+------------------------------------------------------------------+
class CSpreadHistogram
  {
private:
   int               m_bins[];
   int               m_circular[];
   int               m_head;
   int               m_num_bins;
   double            m_bin_width;
   double            m_min_spread;
   double            m_max_spread;
   int               m_window_size;
   int               m_obs_count;
   long              m_total_ticks;
   int               PriceToBin(double spread_pts);
   double            BinToPrice(int bin);
public:
                     CSpreadHistogram(void);
                    ~CSpreadHistogram(void);
   bool              Init(int num_bins,double min_spread_pts,double max_spread_pts,int window_size);
   void              Update(double spread_pts);
   double            GetPercentileRank(double spread_pts);
   double            GetPercentileValue(double pct);
   double            GetMedian(void);
   double            GetMean(void);
   bool              IsReady(void);
   void              Reset(void);
   int               GetObsCount(void);
   bool              GetBinCounts(int &out_counts[]);
   int               GetNumBins(void);
   double            GetBinWidth(void);
   double            GetMinSpread(void);
   double            GetMaxSpread(void);
  };
m_bins[] holds the bin counters. m_circular[] records the bin index of each of the last m_window_size observations for eviction. m_head is the current write position. The geometry members define the coordinate system. m_obs_count tracks the current window population and m_total_ticks is a diagnostic counter that only ever increases. PriceToBin() and BinToPrice() are private helpers not exposed publicly since callers only need the higher-level operations built on top of them.
Init() validates inputs, computes bin geometry, allocates both arrays, and initializes them. The circular buffer is filled with -1 as a sentinel marking unwritten slots:
//+------------------------------------------------------------------+
//| Init                                                             |
//+------------------------------------------------------------------+
bool CSpreadHistogram::Init(int num_bins,double min_spread_pts,double max_spread_pts,int window_size)
  {
   if(num_bins<=0 || window_size<=0 || max_spread_pts<=min_spread_pts)
      return(false);
   m_num_bins=num_bins;
   m_min_spread=min_spread_pts;
   m_max_spread=max_spread_pts;
   m_bin_width=(m_max_spread-m_min_spread)/m_num_bins;
   m_window_size=window_size;
   m_obs_count=0;
   m_head=0;
   m_total_ticks=0;
   if(ArrayResize(m_bins,m_num_bins)!=m_num_bins)
      return(false);
   if(ArrayResize(m_circular,m_window_size)!=m_window_size)
      return(false);
   ArrayInitialize(m_bins,0);
   ArrayInitialize(m_circular,-1);
   return(true);
  }
PriceToBin() converts a raw spread into a bin index with clamping so values outside the configured range never produce an invalid index:
//+------------------------------------------------------------------+
//| PriceToBin                                                       |
//+------------------------------------------------------------------+
int CSpreadHistogram::PriceToBin(double spread_pts)
  {
   int bin=(int)((spread_pts-m_min_spread)/m_bin_width);
   if(bin<0)
      bin=0;
   if(bin>m_num_bins-1)
      bin=m_num_bins-1;
   return(bin);
  }
BinToPrice() returns the midpoint of a bin's range. The midpoint is used because observations inside a bin are assumed to spread roughly evenly across it:
//+------------------------------------------------------------------+
//| BinToPrice                                                       |
//+------------------------------------------------------------------+
double CSpreadHistogram::BinToPrice(int bin)
  {
   return(m_min_spread+(bin+0.5)*m_bin_width);
  }
Update() is the per-tick entry point. It evicts the oldest observation when the window is full, increments the new bin, records the bin index in the circular buffer, and advances the head:
//+------------------------------------------------------------------+
//| Update                                                           |
//+------------------------------------------------------------------+
void CSpreadHistogram::Update(double spread_pts)
  {
   int new_bin=PriceToBin(spread_pts);
   if(m_obs_count>=m_window_size)
     {
      int old_bin=m_circular[m_head];
      if(old_bin>=0)
         m_bins[old_bin]--;
     }
   else
      m_obs_count++;
   m_bins[new_bin]++;
   m_circular[m_head]=new_bin;
   m_head=(m_head+1)%m_window_size;
   m_total_ticks++;
  }
GetPercentileRank() sums bin counts from the first bin through the query bin and reports what fraction of the window that represents:
//+------------------------------------------------------------------+
//| GetPercentileRank                                                |
//+------------------------------------------------------------------+
double CSpreadHistogram::GetPercentileRank(double spread_pts)
  {
   if(m_obs_count<=0)
      return(0.0);
   int target_bin=PriceToBin(spread_pts);
   long cum=0;
   for(int i=0;i<=target_bin;i++)
      cum+=m_bins[i];
   return(100.0*(double)cum/(double)m_obs_count);
  }
GetPercentileValue() is the inverse: it scans bins left to right and returns the representative value of the first bin whose cumulative count reaches the target:
//+------------------------------------------------------------------+
//| GetPercentileValue                                               |
//+------------------------------------------------------------------+
double CSpreadHistogram::GetPercentileValue(double pct)
  {
   if(m_obs_count<=0)
      return(0.0);
   long target=(long)MathCeil(pct/100.0*m_obs_count);
   if(target<1)
      target=1;
   long cum=0;
   for(int i=0;i<m_num_bins;i++)
     {
      cum+=m_bins[i];
      if(cum>=target)
         return(BinToPrice(i));
     }
   return(BinToPrice(m_num_bins-1));
  }
MathCeil() is used so the 95th percentile of a 5,000-observation window targets the 4,750th observation rather than rounding down. The fallback at the end returns the last bin's value and should never be reached with correctly maintained counts.
The GetMedian() and GetMean() methods are straightforward:
//+------------------------------------------------------------------+
//| GetMedian                                                        |
//+------------------------------------------------------------------+
double CSpreadHistogram::GetMedian(void)
  {
   return(GetPercentileValue(50.0));
  }
//+------------------------------------------------------------------+
//| GetMean                                                          |
//+------------------------------------------------------------------+
double CSpreadHistogram::GetMean(void)
  {
   if(m_obs_count<=0)
      return(0.0);
   double weighted_sum=0.0;
   for(int i=0;i<m_num_bins;i++)
      weighted_sum+=BinToPrice(i)*m_bins[i];
   return(weighted_sum/m_obs_count);
  }
IsReady() uses half the configured window rather than requiring it to fill entirely. Half the window is generally enough for the bin counts to take a representative shape. Reset() clears accumulated state without releasing the underlying arrays, useful after a known feed discontinuity.
//+------------------------------------------------------------------+
//| IsReady                                                          |
//+------------------------------------------------------------------+
bool CSpreadHistogram::IsReady(void)
  {
   return(m_obs_count>=m_window_size/2);
  }
Reset() clears accumulated state without releasing or reallocating the underlying arrays. This is useful when a caller knows history should be discarded, for example after a known feed discontinuity, without paying the cost of a full reallocation through Init().
//+------------------------------------------------------------------+
//| Reset                                                            |
//+------------------------------------------------------------------+
void CSpreadHistogram::Reset(void)
  {
   ArrayInitialize(m_bins,0);
   ArrayInitialize(m_circular,-1);
   m_obs_count=0;
   m_head=0;
  }
GetObsCount() exposes the current windowed observation count, used by both the dashboard and diagnostic logging to show how populated the histogram currently is.
//+------------------------------------------------------------------+
//| GetObsCount                                                      |
//+------------------------------------------------------------------+
int CSpreadHistogram::GetObsCount(void)
  {
   return(m_obs_count);
  }
GetBinCounts() copies the live bin array into a caller-supplied array so a renderer can draw the actual observed distribution:
//+------------------------------------------------------------------+
//| GetBinCounts                                                     |
//+------------------------------------------------------------------+
bool CSpreadHistogram::GetBinCounts(int &out_counts[])
  {
   if(m_num_bins<=0)
      return(false);
   if(ArrayResize(out_counts,m_num_bins)!=m_num_bins)
      return(false);
   for(int i=0;i<m_num_bins;i++)
      out_counts[i]=m_bins[i];
   return(true);
  }
Accessors
The four geometry accessors GetNumBins(), GetBinWidth(), GetMinSpread(), and GetMaxSpread() each return a single stored value. They exist because a renderer converting bin indices into real spread values, or positioning a marker at a specific spread on a pixel axis, needs this coordinate system and has no other legitimate way to obtain it.
//+------------------------------------------------------------------+
//| GetNumBins                                                       |
//+------------------------------------------------------------------+
int CSpreadHistogram::GetNumBins(void)
  {
   return(m_num_bins);
  }
//+------------------------------------------------------------------+
//| GetBinWidth                                                      |
//+------------------------------------------------------------------+
double CSpreadHistogram::GetBinWidth(void)
  {
   return(m_bin_width);
  }
//+------------------------------------------------------------------+
//| GetMinSpread                                                     |
//+------------------------------------------------------------------+
double CSpreadHistogram::GetMinSpread(void)
  {
   return(m_min_spread);
  }
//+------------------------------------------------------------------+
//| GetMaxSpread                                                     |
//+------------------------------------------------------------------+
double CSpreadHistogram::GetMaxSpread(void)
  {
   return(m_max_spread);
  }
Section 5: Multi-Symbol Orchestration
CSpreadMonitor owns one CSpreadHistogram per monitored symbol and presents a single, symbol-indexed interface to the rest of the system. On each call to its OnTick() method, it actively queries every monitored symbol's spread using SymbolInfoInteger() with SYMBOL_SPREAD.
SYMBOL_SPREAD is preferred over computing Ask - Bid for a numerical reason: Ask and Bid are both large numbers relative to their tiny difference, and subtracting two nearly equal floating-point values is a known source of precision loss. SYMBOL_SPREAD avoids this entirely since the trade server reports the spread directly as an integer count of points.
The classification is expressed through ENUM_SPREAD_STATUS with four values declared at file scope so any file including this header can reference them without a class qualifier:
enum ENUM_SPREAD_STATUS
  {
   STATUS_GREEN,
   STATUS_YELLOW,
   STATUS_RED,
   STATUS_WARMING
  };
GetStatus() checks readiness before computing a rank. IsOrderAllowed() returns true only for GREEN or YELLOW. Both RED and WARMING block order submission — the distinction only affects how the condition is reported and displayed, not whether trading is permitted.
Section 6: Implementation — SpreadMonitor.mqh
//+------------------------------------------------------------------+
//|                                              SpreadMonitor.mqh   |
//+------------------------------------------------------------------+
#ifndef SPREADMONITOR_MQH
#define SPREADMONITOR_MQH

#include <Spread_Monitor\SpreadHistogram.mqh>

//+------------------------------------------------------------------+
//| Spread status classification, file scope                         |
//+------------------------------------------------------------------+
enum ENUM_SPREAD_STATUS
  {
   STATUS_GREEN,
   STATUS_YELLOW,
   STATUS_RED,
   STATUS_WARMING
  };
//+------------------------------------------------------------------+
//| Class CSpreadMonitor                                             |
//| Coordinates per-symbol spread histograms and the order gate      |
//+------------------------------------------------------------------+
class CSpreadMonitor
  {
private:
   CSpreadHistogram  m_histograms[];
   string            m_symbols[];
   int               m_n_symbols;
   double            m_alert_pct;
   double            m_warn_pct;
public:
                     CSpreadMonitor(void);
                    ~CSpreadMonitor(void);
   bool              Init(const string &symbols[],int n,int num_bins,double min_pts,double max_pts,
                           int window_size,double alert_pct,double warn_pct);
   void              OnTick(void);
   ENUM_SPREAD_STATUS GetStatus(int symbol_idx);
   bool              IsOrderAllowed(int symbol_idx);
   double            GetCurrentSpread(int symbol_idx);
   double            GetMedianSpread(int symbol_idx);
   double            GetPercentileRank(int symbol_idx);
   double            GetThresholdSpread(int symbol_idx);
   bool              GetBinCounts(int symbol_idx,int &out_counts[]);
   int               GetNumBins(int symbol_idx);
   double            GetBinWidth(int symbol_idx);
   double            GetMinSpread(int symbol_idx);
   double            GetMaxSpread(int symbol_idx);
  };
m_histograms[] and m_symbols[] are parallel arrays indexed identically so that index i always refers to the same instrument in both. m_alert_pct and m_warn_pct default to 95.0 and 75.0.
//+------------------------------------------------------------------+
//| Constructor                                                      |
//+------------------------------------------------------------------+
CSpreadMonitor::CSpreadMonitor(void)
  {
   m_n_symbols=0;
   m_alert_pct=95.0;
   m_warn_pct=75.0;
  }
//+------------------------------------------------------------------+
//| Destructor                                                       |
//+------------------------------------------------------------------+
CSpreadMonitor::~CSpreadMonitor(void)
  {
   ArrayFree(m_histograms);
   ArrayFree(m_symbols);
  }
Freeing m_histograms[] triggers each contained CSpreadHistogram's own destructor, so their memory is released without any extra code here.
Init()
Init() validates that the symbol count is positive and the thresholds are correctly ordered. It then allocates both arrays and configures each symbol's histogram:
//+------------------------------------------------------------------+
//| Init                                                             |
//+------------------------------------------------------------------+
bool CSpreadMonitor::Init(const string &symbols[],int n,int num_bins,double min_pts,double max_pts,
                           int window_size,double alert_pct,double warn_pct)
  {
   if(n<=0 || alert_pct<=warn_pct || alert_pct>100.0 || warn_pct<0.0)
      return(false);
   m_n_symbols=n;
   m_alert_pct=alert_pct;
   m_warn_pct=warn_pct;
   if(ArrayResize(m_histograms,m_n_symbols)!=m_n_symbols)
      return(false);
   if(ArrayResize(m_symbols,m_n_symbols)!=m_n_symbols)
      return(false);
   for(int i=0;i<m_n_symbols;i++)
     {
      m_symbols[i]=symbols[i];
      if(!m_histograms[i].Init(num_bins,min_pts,max_pts,window_size))
         return(false);
      if(!SymbolSelect(symbols[i],true))
         PrintFormat("CSpreadMonitor: SymbolSelect failed for %s",symbols[i]);
     }
   return(true);
  }
Every monitored symbol shares identical histogram geometry. SymbolSelect() ensures each symbol is present in Market Watch. A failure is logged but does not abort initialization since the symbol may already be selected by other means.
OnTick()
OnTick() walks every monitored symbol, reads its current spread, and updates its histogram://+------------------------------------------------------------------+ //| OnTick | //+------------------------------------------------------------------+ void CSpreadMonitor::OnTick(void) { for(int i=0;i<m_n_symbols;i++) { long spread_points=SymbolInfoInteger(m_symbols[i],SYMBOL_SPREAD); double spread_pts=(double)spread_points; m_histograms[i].Update(spread_pts); } }
GetStatus()
GetStatus() checks bounds, then readiness, then rank:
//+------------------------------------------------------------------+
//| GetStatus                                                        |
//+------------------------------------------------------------------+
ENUM_SPREAD_STATUS CSpreadMonitor::GetStatus(int symbol_idx)
  {
   if(symbol_idx<0 || symbol_idx>=m_n_symbols)
      return(STATUS_RED);
   if(!m_histograms[symbol_idx].IsReady())
      return(STATUS_WARMING);
   double rank=GetPercentileRank(symbol_idx);
   if(rank>m_alert_pct)
      return(STATUS_RED);
   if(rank>m_warn_pct)
      return(STATUS_YELLOW);
   return(STATUS_GREEN);
  }
An out-of-range index returns STATUS_RED as a fail-safe for a programming error, deliberately distinct from STATUS_WARMING which is reserved for the legitimate condition of insufficient data.
IsOrderAllowed()
//+------------------------------------------------------------------+
//| IsOrderAllowed                                                   |
//+------------------------------------------------------------------+
bool CSpreadMonitor::IsOrderAllowed(int symbol_idx)
  {
   ENUM_SPREAD_STATUS status=GetStatus(symbol_idx);
   return(status==STATUS_GREEN || status==STATUS_YELLOW);
  }
IsOrderAllowed() is the order-submission gate. It returns true only for GREEN or YELLOW, which means both RED and WARMING block trading. Introducing the fourth status changes nothing about how conservative this gate is. It only changes how the underlying condition is reported and displayed elsewhere in the system.
GetCurrentSpread()
//+------------------------------------------------------------------+
//| GetCurrentSpread                                                 |
//+------------------------------------------------------------------+
double CSpreadMonitor::GetCurrentSpread(int symbol_idx)
  {
   if(symbol_idx<0 || symbol_idx>=m_n_symbols)
      return(0.0);
   return((double)SymbolInfoInteger(m_symbols[symbol_idx],SYMBOL_SPREAD));
  }
GetCurrentSpread() re-queries the live spread directly rather than reading a cached value, so any caller always sees the most current reading regardless of when the last OnTick() update happened to run.
GetMedianSpread(), GetPercentileRank(), GetThresholdSpread()
//+------------------------------------------------------------------+
//| GetMedianSpread                                                  |
//+------------------------------------------------------------------+
double CSpreadMonitor::GetMedianSpread(int symbol_idx)
  {
   if(symbol_idx<0 || symbol_idx>=m_n_symbols)
      return(0.0);
   return(m_histograms[symbol_idx].GetMedian());
  }
//+------------------------------------------------------------------+
//| GetPercentileRank                                                |
//+------------------------------------------------------------------+
double CSpreadMonitor::GetPercentileRank(int symbol_idx)
  {
   if(symbol_idx<0 || symbol_idx>=m_n_symbols)
      return(0.0);
   double current=GetCurrentSpread(symbol_idx);
   return(m_histograms[symbol_idx].GetPercentileRank(current));
  }
//+------------------------------------------------------------------+
//| GetThresholdSpread                                               |
//+------------------------------------------------------------------+
double CSpreadMonitor::GetThresholdSpread(int symbol_idx)
  {
   if(symbol_idx<0 || symbol_idx>=m_n_symbols)
      return(0.0);
   return(m_histograms[symbol_idx].GetPercentileValue(m_alert_pct));
  }
These three methods delegate directly to the corresponding histogram after the usual bounds check. GetMedianSpread() exposes a stable summary statistic for display. GetPercentileRank() combines the live current spread with a query against the histogram, which is the calculation both GetStatus() and the dashboard rely on. GetThresholdSpread() reports the spread value currently sitting at the alert percentile, the exact number that would push a symbol into RED, recomputed fresh from the histogram's current contents rather than fixed at startup.
GetBinCounts(), GetNumBins(), GetBinWidth(), GetMinSpread(), and GetMaxSpread()
//+------------------------------------------------------------------+
//| GetBinCounts                                                     |
//+------------------------------------------------------------------+
bool CSpreadMonitor::GetBinCounts(int symbol_idx,int &out_counts[])
  {
   if(symbol_idx<0 || symbol_idx>=m_n_symbols)
      return(false);
   return(m_histograms[symbol_idx].GetBinCounts(out_counts));
  }
//+------------------------------------------------------------------+
//| GetNumBins                                                       |
//+------------------------------------------------------------------+
int CSpreadMonitor::GetNumBins(int symbol_idx)
  {
   if(symbol_idx<0 || symbol_idx>=m_n_symbols)
      return(0);
   return(m_histograms[symbol_idx].GetNumBins());
  }
//+------------------------------------------------------------------+
//| GetBinWidth                                                      |
//+------------------------------------------------------------------+
double CSpreadMonitor::GetBinWidth(int symbol_idx)
  {
   if(symbol_idx<0 || symbol_idx>=m_n_symbols)
      return(0.0);
   return(m_histograms[symbol_idx].GetBinWidth());
  }
//+------------------------------------------------------------------+
//| GetMinSpread                                                     |
//+------------------------------------------------------------------+
double CSpreadMonitor::GetMinSpread(int symbol_idx)
  {
   if(symbol_idx<0 || symbol_idx>=m_n_symbols)
      return(0.0);
   return(m_histograms[symbol_idx].GetMinSpread());
  }
//+------------------------------------------------------------------+
//| GetMaxSpread                                                     |
//+------------------------------------------------------------------+
double CSpreadMonitor::GetMaxSpread(int symbol_idx)
  {
   if(symbol_idx<0 || symbol_idx>=m_n_symbols)
      return(0.0);
   return(m_histograms[symbol_idx].GetMaxSpread());
  }
These five methods are thin, bounds-checked pass-throughs to the equivalent accessors on CSpreadHistogram. They exist for exactly one reason: CDashboardRenderer, which draws a histogram it does not own, needs the real bin counts and the real coordinate system behind them, and this is the only path by which it can reach that data through the multi-symbol coordinator rather than reaching into a specific histogram instance directly.
Section 7: Dashboard and Histogram Visualization
The visual layer has two panels. RenderDashboard() draws a compact summary across every monitored symbol — one row per symbol showing current spread, rolling median, alert threshold, percentile rank, and a colored status badge. RenderHistogram() is scoped to one selected symbol and draws its full empirical distribution: a bar for each bin, a vertical marker at the live spread, and bins beyond the alert threshold shaded differently.
Both panels draw from real bin counts and real coordinate geometry exposed through the accessors in Sections 4 and 6, not from approximations. A marker positioned using anything other than the histogram's real minimum and maximum would not line up with the bars it sits among.
The status badge uses four colors: lime green for GREEN, gold for YELLOW, crimson for RED, and silver for WARMING. A silver badge lets an operator immediately distinguish "still collecting data" from "confirmed anomaly."
Both panels refresh on a fixed timer rather than on every tick. A liquid FX pair can generate more than ten ticks per second during active sessions. Redrawing on every tick would add overhead to the tick-processing path where the gating logic needs to run without delay. A 500-millisecond timer keeps the display responsive while keeping per-tick code free of rendering work.
Section 8: Implementation — DashboardRenderer.mqh
CDashboardRenderer reads from a CSpreadMonitor passed into each render call and turns that state into pixels on two CCanvas objects. The monitor and histogram classes carry no drawing code, and the renderer can be replaced without touching the data layer.
//+------------------------------------------------------------------+
//|                                          DashboardRenderer.mqh   |
//+------------------------------------------------------------------+
#ifndef DASHBOARDRENDERER_MQH
#define DASHBOARDRENDERER_MQH

#include <Canvas\Canvas.mqh>
#include <Spread_Monitor\SpreadMonitor.mqh>
//+------------------------------------------------------------------+
//| Class CDashboardRenderer                                         |
//| Draws the summary panel and per-symbol histogram on CCanvas      |
//+------------------------------------------------------------------+
class CDashboardRenderer
  {
private:
   CCanvas           m_canvas;
   CCanvas           m_hist_canvas;
   int               m_panel_width;
   int               m_panel_height;
   int               m_hist_width;
   int               m_hist_height;
public:
                     CDashboardRenderer(void);
                    ~CDashboardRenderer(void);
   bool              Init(int x,int y,int panel_width,int panel_height,
                           int hist_x,int hist_y,int hist_width,int hist_height);
   void              RenderDashboard(CSpreadMonitor &monitor);
   void              RenderHistogram(CSpreadMonitor &monitor,int symbol_idx);
   void              Destroy(void);
  };
//+------------------------------------------------------------------+
//| Constructor                                                      |
//+------------------------------------------------------------------+
CDashboardRenderer::CDashboardRenderer(void)
  {
   m_panel_width=0;
   m_panel_height=0;
   m_hist_width=0;
   m_hist_height=0;
  }
//+------------------------------------------------------------------+
//| Destructor                                                       |
//+------------------------------------------------------------------+
CDashboardRenderer::~CDashboardRenderer(void)
  {
   Destroy();
  }
The destructor calls Destroy() so both canvas objects are removed if the renderer goes out of scope without an explicit Destroy() call.
Init()
Init() creates both bitmap-backed chart objects and clears them to a light background:
//+------------------------------------------------------------------+
//| Init                                                             |
//+------------------------------------------------------------------+
bool CDashboardRenderer::Init(int x,int y,int panel_width,int panel_height,
                               int hist_x,int hist_y,int hist_width,int hist_height)
  {
   m_panel_width=panel_width;
   m_panel_height=panel_height;
   m_hist_width=hist_width;
   m_hist_height=hist_height;
   if(!m_canvas.CreateBitmapLabel("SpreadDashboardPanel",x,y,panel_width,panel_height,COLOR_FORMAT_ARGB_NORMALIZE))
      return(false);
   if(!m_hist_canvas.CreateBitmapLabel("SpreadHistogramPanel",hist_x,hist_y,hist_width,hist_height,COLOR_FORMAT_ARGB_NORMALIZE))
      return(false);
   m_canvas.Erase(ColorToARGB(clrWhiteSmoke,255));
   m_hist_canvas.Erase(ColorToARGB(clrWhiteSmoke,255));
   m_canvas.Update();
   m_hist_canvas.Update();
   return(true);
  }
RenderDashboard()
RenderDashboard() loops over the monitored symbols, pulls each one's current spread, median, threshold, rank, and status through the monitor's accessors, and draws a formatted row plus a colored badge:
//+------------------------------------------------------------------+
//| RenderDashboard                                                  |
//+------------------------------------------------------------------+
void CDashboardRenderer::RenderDashboard(CSpreadMonitor &monitor)
  {
   m_canvas.Erase(ColorToARGB(clrWhiteSmoke,255));
   int row_height=40;
   int y=10;
   for(int i=0;i<3;i++)
     {
      double current=monitor.GetCurrentSpread(i);
      double median=monitor.GetMedianSpread(i);
      double threshold=monitor.GetThresholdSpread(i);
      double rank=monitor.GetPercentileRank(i);
      ENUM_SPREAD_STATUS status=monitor.GetStatus(i);
      color badge_color=clrLimeGreen;
      if(status==STATUS_YELLOW)
         badge_color=clrGold;
      if(status==STATUS_RED)
         badge_color=clrCrimson;
      if(status==STATUS_WARMING)
         badge_color=clrSilver;
      string line=StringFormat("Sym%d  Cur:%.1f  Med:%.1f  Thr:%.1f  Pct:%.1f",
                                i+1,current,median,threshold,rank);
      m_canvas.FontSet("Arial",12,FW_NORMAL);
      m_canvas.TextOut(10,y,line,ColorToARGB(clrBlack,255));
      m_canvas.FillRectangle(m_panel_width-30,y,m_panel_width-10,y+18,ColorToARGB(badge_color,255));
      y+=row_height;
     }
   m_canvas.Update();
  }
RenderHistogram()
RenderHistogram() draws the empirical distribution for one symbol. Bar heights are scaled relative to the tallest bin. Each bar's color depends on whether its real spread value, computed from the histogram's actual minimum and bin width, sits at or above the alert threshold. The marker line for the current spread is positioned as a fraction of the full configured range, so it aligns correctly with the bars regardless of what that range is:
//+------------------------------------------------------------------+
//| RenderHistogram                                                  |
//+------------------------------------------------------------------+
void CDashboardRenderer::RenderHistogram(CSpreadMonitor &monitor,int symbol_idx)
  {
   m_hist_canvas.Erase(ColorToARGB(clrWhiteSmoke,255));

   int num_bins=monitor.GetNumBins(symbol_idx);
   int counts[];
   if(num_bins<=0 || !monitor.GetBinCounts(symbol_idx,counts))
     {
      m_hist_canvas.FontSet("Arial",10,FW_NORMAL);
      m_hist_canvas.TextOut(5,5,"Histogram not ready",ColorToARGB(clrGray,255));
      m_hist_canvas.Update();
      return;
     }

   double bin_width=monitor.GetBinWidth(symbol_idx);
   double min_spread=monitor.GetMinSpread(symbol_idx);
   double max_spread=monitor.GetMaxSpread(symbol_idx);
   double current=monitor.GetCurrentSpread(symbol_idx);
   double threshold=monitor.GetThresholdSpread(symbol_idx);

   int max_count=1;
   for(int b=0;b<num_bins;b++)
      if(counts[b]>max_count)
         max_count=counts[b];

   int bar_width=m_hist_width/num_bins;
   int plot_height=m_hist_height-30;
   for(int b=0;b<num_bins;b++)
     {
      int bar_h=(int)((double)counts[b]/max_count*plot_height);
      int x0=b*bar_width;
      int y0=plot_height-bar_h;
      double bin_value=min_spread+(b+0.5)*bin_width;
      color bar_color=(bin_value>=threshold)?clrCrimson:clrDodgerBlue;
      m_hist_canvas.FillRectangle(x0,y0,x0+bar_width-1,plot_height,ColorToARGB(bar_color,180));
     }

   double total_range=max_spread-min_spread;
   double frac=(total_range>0.0)?(current-min_spread)/total_range:0.0;
   int marker_x=(int)(frac*m_hist_width);
   if(marker_x<0)
      marker_x=0;
   if(marker_x>=m_hist_width)
      marker_x=m_hist_width-1;
   m_hist_canvas.Line(marker_x,0,marker_x,plot_height,ColorToARGB(clrBlue,255));

   m_hist_canvas.FontSet("Arial",10,FW_NORMAL);
   m_hist_canvas.TextOut(5,plot_height+5,
      StringFormat("Spread (pts)  Cur=%.1f  Thr=%.1f",current,threshold),
      ColorToARGB(clrBlack,255));
   m_hist_canvas.TextOut(5,plot_height+18,
      StringFormat("Range: %.0f - %.0f pts",min_spread,max_spread),
      ColorToARGB(clrGray,255));
   m_hist_canvas.Update();
  }
Destroy()
//+------------------------------------------------------------------+
//| Destroy                                                          |
//+------------------------------------------------------------------+
void CDashboardRenderer::Destroy(void)
  {
   m_canvas.Destroy();
   m_hist_canvas.Destroy();
  }
Destroy() removes both underlying chart objects entirely. It is called both from the destructor as a safety net and explicitly from the host EA's OnDeinit(), so the dashboard disappears promptly rather than lingering until the object's eventual destruction.
Section 9: Implementation — SpreadMonitorDemo.mq5
//+------------------------------------------------------------------+
//|                                          SpreadMonitorDemo.mq5   |
//+------------------------------------------------------------------+

#include <Spread_Monitor\SpreadMonitor.mqh>
#include <Spread_Monitor\DashboardRenderer.mqh>

//--- Inputs
input string InpSymbol1      ="EURUSD";   // InpSymbol1
input string InpSymbol2      ="GBPJPY";   // InpSymbol2
input string InpSymbol3      ="USDJPY";   // InpSymbol3
input int    InpWindowSize   =5000;       // InpWindowSize
input int    InpNumBins      =50;         // InpNumBins
input double InpMinSpreadPts =0.0;        // InpMinSpreadPts
input double InpMaxSpreadPts =50.0;       // InpMaxSpreadPts
input double InpAlertPct     =95.0;       // InpAlertPct
input double InpWarnPct      =75.0;       // InpWarnPct
input int    InpAlertCooldownSec =30;  // Minimum seconds between repeated alerts per symbol

CSpreadMonitor     g_Monitor;
CDashboardRenderer g_Renderer;
bool               g_AlertArmed[3];
datetime           g_LastAlertTime[3];
g_AlertArmed[] controls whether a new alert is allowed to fire per symbol. g_LastAlertTime[] records when each symbol last alerted, used for the cooldown check.
OnInit()
OnInit() initializes both components, resets alert state, and starts the 500-millisecond refresh timer:
//+------------------------------------------------------------------+
//| Expert initialization function                                   |
//+------------------------------------------------------------------+
int OnInit(void)
  {
   string symbols[3];
   symbols[0]=InpSymbol1;
   symbols[1]=InpSymbol2;
   symbols[2]=InpSymbol3;

   if(!g_Monitor.Init(symbols,3,InpNumBins,InpMinSpreadPts,InpMaxSpreadPts,
                      InpWindowSize,InpAlertPct,InpWarnPct))
     {
      Print("SpreadMonitorDemo: failed to initialize CSpreadMonitor");
      return(INIT_FAILED);
     }

   if(!g_Renderer.Init(10,20,260,150,10,190,300,200))
     {
      Print("SpreadMonitorDemo: failed to initialize CDashboardRenderer");
      return(INIT_FAILED);
     }

   for(int i=0;i<3;i++)
     {
      g_AlertArmed[i]=true;
      g_LastAlertTime[i]=0;
     }

   EventSetMillisecondTimer(500);

   PrintFormat("SpreadMonitorDemo initialized: Symbols=%s,%s,%s WindowSize=%d NumBins=%d AlertPct=%.1f WarnPct=%.1f",
               InpSymbol1,InpSymbol2,InpSymbol3,InpWindowSize,InpNumBins,InpAlertPct,InpWarnPct);

   return(INIT_SUCCEEDED);
  }
OnTick()
OnTick() updates the monitor and handles alert logic. Two independent conditions must both hold before an alert fires: the arm flag and the cooldown:
//+------------------------------------------------------------------+
//| Expert tick function                                             |
//+------------------------------------------------------------------+
void OnTick(void)
  {
   g_Monitor.OnTick();

   datetime now=TimeCurrent();
   for(int i=0;i<3;i++)
     {
      ENUM_SPREAD_STATUS status=g_Monitor.GetStatus(i);
      bool cooldown_elapsed=((now-g_LastAlertTime[i])>=InpAlertCooldownSec);
      if(status==STATUS_RED && g_AlertArmed[i] && cooldown_elapsed)
        {
         PrintFormat("ALERT %s | Symbol=%s CurrentSpread=%.1f MedianSpread=%.1f PercentileRank=%.1f",
                     TimeToString(TimeCurrent(),TIME_DATE|TIME_SECONDS),
                     (i==0?InpSymbol1:(i==1?InpSymbol2:InpSymbol3)),
                     g_Monitor.GetCurrentSpread(i),
                     g_Monitor.GetMedianSpread(i),
                     g_Monitor.GetPercentileRank(i));
         g_AlertArmed[i]=false;
         g_LastAlertTime[i]=now;
        }
      if(status==STATUS_GREEN)
         g_AlertArmed[i]=true;
     }
  }
The arm flag disarms when a symbol reaches RED and only resets when the symbol recovers all the way to GREEN, not merely out of RED into YELLOW. This stops a symbol hovering near the boundary from re-triggering on every small fluctuation. The cooldown provides a separate cap for instruments that oscillate across the boundary faster than a human would want to see repeated notifications. Together, a sustained anomaly is reported once and stays quiet until it clears, while a flickering one is capped to one alert per cooldown window.
OnTimer()
//+------------------------------------------------------------------+
//| Expert timer function                                            |
//+------------------------------------------------------------------+
void OnTimer(void)
  {
   g_Renderer.RenderDashboard(g_Monitor);
   g_Renderer.RenderHistogram(g_Monitor,0);
  }
OnTimer() fires at the fixed interval set in OnInit() and performs the two rendering calls discussed in Section 7. RenderDashboard() redraws the three-symbol summary, and RenderHistogram() redraws the detail histogram for symbol index 0, InpSymbol1, as the actively inspected instrument.
OnDeinit()
//+------------------------------------------------------------------+
//| Expert deinitialization function                                 |
//+------------------------------------------------------------------+
void OnDeinit(const int reason)
  {
   EventKillTimer();
   g_Renderer.Destroy();
  }
OnDeinit() stops the refresh timer with EventKillTimer() and removes both canvas objects immediately through g_Renderer.Destroy(), rather than leaving them to be cleaned up only when the global renderer instance is eventually destructed. g_Monitor needs no explicit cleanup here, since it is a module-level object whose own destructor runs automatically as the program unloads.

The SpreadMonitorDemo dashboard running live on EURUSD H1. All three symbols show green badges. The histogram below shows EURUSD's empirical spread distribution, heavily concentrated near 0 points with a thin tail extending toward the alert threshold.
Section 10: Verification
//+------------------------------------------------------------------+
//|                                         TestSpreadHistogram.mq5  |
//+------------------------------------------------------------------+

#property script_show_inputs

#include <Spread_Monitor\SpreadHistogram.mqh>

#define ASSERT(cond,msg) \
   if(!(cond)) { PrintFormat("FAIL: %s",msg); } \
   else        { PrintFormat("PASS: %s",msg); }

//+------------------------------------------------------------------+
//| Script program start function                                    |
//+------------------------------------------------------------------+
void OnStart(void)
  {
   CSpreadHistogram hist;
   hist.Init(50,0.0,50.0,2000);

   MathSrand(7);
   int n=2000;
   for(int i=0;i<n;i++)
     {
      double base=10.0;
      double noise=(double)(MathRand()%1000)/100.0-5.0;
      double spread=base+noise;
      if(spread<0.0)
         spread=0.0;
      hist.Update(spread);
     }

   double median=hist.GetMedian();
   double p95=hist.GetPercentileValue(95.0);
   double rank_at_10=hist.GetPercentileRank(10.0);

   PrintFormat("Median: %.2f  P95: %.2f  RankAt10: %.2f",median,p95,rank_at_10);

   ASSERT(median>8.0 && median<12.0,"Median falls within expected band around base spread");
   ASSERT(p95>12.0 && p95<17.0,"95th percentile falls within expected band above median");
   ASSERT(rank_at_10>45.0 && rank_at_10<75.0,"Percentile rank of base spread falls near the middle of the distribution");
  }
//+------------------------------------------------------------------+
The script feeds 2,000 synthetic observations: a base value of 10 points plus uniform noise spanning 10 points. The noise range is intentionally wide relative to the 1-point bin width, so that percentile results reflect the actual distribution shape rather than bin-boundary artifacts. The three assertions check the median, the 95th-percentile value, and the percentile rank of the distribution's known center. Bands are used rather than exact values because bin-level rounding and the specific random sequence both introduce small variation. A median far from 10, a P95 that does not sit meaningfully above the median, or a rank for the center that lands far from 50 would all indicate a defect in the core logic.
Section 11: Calibrating the Monitor
InpWindowSize: A shorter window (~1,000 ticks) reacts quickly but produces noisier estimates. A longer window (~10,000 ticks) is smoother but slower to reflect a real regime change. The default of 5,000 suits a typical FX major under normal conditions.
InpNumBins / InpMinSpreadPts / InpMaxSpreadPts: After running for a while, inspect the rendered histogram. Bars concentrated in the leftmost bins with the rest empty means the range is too wide — tighten it for sharper resolution. An unusually tall final bar means observations are clamping at the top — raise InpMaxSpreadPts, since clamped values degrade accuracy in the upper tail this monitor cares about most.
InpAlertPct / InpWarnPct: Lowering InpAlertPct toward 90 catches more anomalies but blocks more ordinary trading. Raising it toward 99 does the opposite. The right value depends on how costly a missed anomaly is versus a blocked legitimate trade.
InpAlertCooldownSec: An instrument whose typical spread sits comfortably away from the threshold rarely needs the cooldown. An instrument whose spread sits close to the alert boundary will lean on it more heavily. In that situation, raising InpAlertPct so the boundary no longer sits inside the instrument's normal range is usually a better fix than simply lengthening the cooldown — a longer cooldown delays repeat notifications rather than addressing why they keep triggering.
Section 12: Limitations
The histogram loses resolution when the observed spread range exceeds InpMaxSpreadPts. Every observation above that ceiling clamps into the final bin, so the monitor cannot distinguish a spread of 51 points from one of 500 points if the maximum is configured at 50.
The rolling window forgets observations uniformly by tick count with no regard for time of day. A wide spread seen during thin overnight liquidity is weighted identically to a narrow spread during a liquid session.
The system cannot tell a persistent shift in an instrument's spread profile apart from a short-lived spike. The rolling window will adapt to either, at a speed set by InpWindowSize, but nothing in the monitor signals which is occurring.
Tick arrival rate is not uniform across brokers, instruments, or times of day. A thinly traded instrument's window measured in ticks can span a much longer real duration than an active pair's identical window, diluting sensitivity to genuinely recent conditions.
Finally, an instrument whose spread naturally sits close to the configured alert threshold will alert more often regardless of how well the hysteresis and cooldown logic behaves. Genuine calibration — moving the threshold relative to the instrument's real behavior — is the correct response, not additional alert suppression.
Conclusion
This implementation provides a complete, distribution-adaptive spread-monitoring system for MQL5. CSpreadHistogram maintains a rolling histogram synchronized to a fixed-size tick window via a circular buffer. It answers percentile queries in O(bins) time and updates in O(1). CSpreadMonitor coordinates one histogram per symbol, reads live spreads through SymbolInfoInteger(), and exposes a four-state classification alongside a boolean order gate. CDashboardRenderer turns that state into a live display built from real bin counts and real geometry. SpreadMonitorDemo.mq5 wires all three together with an alert path that combines a recovery-based arm flag and a time cooldown.
Three properties define the system. Anomalies are detected relative to each instrument's own history, not an external constant. Per-tick cost remains negligible regardless of how many symbols are monitored. The order gate requires no per-instrument tuning beyond shared histogram parameters and two percentile thresholds.
Readers extending this work might consider exponentially weighted percentile tracking so recent observations carry more influence. Running multiple histograms at different window lengths can help separate short-term spikes from longer drift. Folding IsOrderAllowed() into a broader pre-trade risk check alongside volatility, margin, and exposure gates is a natural next step for a production system.
Programs used in the article
| # | Name | Type | Description |
|---|---|---|---|
| 1 | SpreadHistogram.mqh | Include File | Maintains a rolling histogram accumulator synchronized to a circular buffer of recent tick spreads and exposes both percentile queries and its raw bin geometry for external consumers. |
| 2 | SpreadMonitor.mqh | Include File | Coordinates one CSpreadHistogram per monitored symbol, reads live spread data, and exposes a four-state GREEN, YELLOW, RED, or WARMING classification along with a boolean order-submission gate. |
| 3 | DashboardRenderer.mqh | Include File | Renders a per-symbol summary status panel and a per-symbol empirical spread histogram, built from real bin data, using two CCanvas objects refreshed on a fixed timer. |
| 4 | SpreadMonitorDemo.mq5 | Demo EA | Demonstrates the complete spread-monitoring system across three configurable symbols, combining a recovery-based hysteresis flag with a time cooldown to control alert frequency, and refreshing the dashboard independently of tick arrival rate. |
| 5 | TestSpreadHistogram.mq5 | Script | Verifies the CSpreadHistogram implementation against a known synthetic spread distribution, confirming that the reported median, 95th-percentile value, and percentile rank all fall within statistically expected bounds. |
| 6 | Spread_Monitor.zip | Zip Archive | Zip archive containing all the attached files and their paths relative to the terminal's root folder. |
Warning: All rights to these materials are reserved by MetaQuotes Ltd. Copying or reprinting of these materials in whole or in part is prohibited.
This article was written by a user of the site and reflects their personal views. MetaQuotes Ltd is not responsible for the accuracy of the information presented, nor for any consequences resulting from the use of the solutions, strategies or recommendations described.

 Ordinal Pattern Transition Networks in MQL5
 How to Test and Customize Built-in MQL5 Programs: Custom BullishBearish MeetingLines Stoch Expert Advisor
 Symbolic Price Forecasting Equation Using SymPy
 Comparing Trade Return Distributions with Mann-Whitney U in MQL5

- Free trading apps
- Over 8,000 signals for copying
- Economic news for exploring financial markets
You agree to website policy and terms of use