

Trade Duration vs Profitability Scatter Plot Indicator in MQL5
 103
103
 0
0

Introduction
Every trader who has tried to tighten up their exits has asked the same question: does holding a trade longer actually help, or is it just adding risk without adding return? Aggregate statistics like win rate cannot answer this. A strategy can have a solid win rate at every hold time, yet its profitable trades may cluster in one duration range while its losing trades cluster in another. That relationship is account- and strategy-specific. MQL5 has no built-in tool that visualizes it.
This article builds a script that extracts every closed deal, computes each trade's hold duration (minutes) and net profit, and plots them on a CCanvas scatter plot. Each trade is shown as one dot, colored by symbol. A linear regression line overlaid on the scatter reveals the overall trend, and a duration-bucket analysis identifies which range of hold times has produced the best average result. Two short theory sections along the way explain the math doing the actual work: least-squares regression with its R², and why the chart's duration axis is scaled logarithmically rather than linearly.
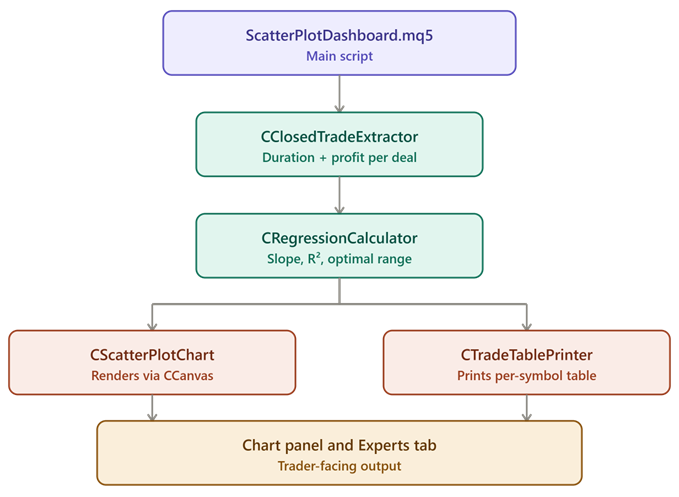
Architectural diagram: The main script extracts closed trades, computes the regression line and identifies the best-performing duration bucket, then renders both the scatter plot and the per-symbol table.
Section 1: ScatterTypes.mqh — Trade Points and Regression Results
Every trade the script analyzes is reduced to four fields: which symbol it was on, how long it was held, what it made or lost, and its ticket for reference. CTradePoint is deliberately flat. It is the smallest record that carries what every downstream consumer, the regression calculator and the chart, actually needs.
CRegressionResult holds the three numbers a linear fit produces: slope, the average change in profit per additional minute of hold time; intercept, the fitted profit at a hypothetical zero-minute hold; and r_squared, how much of the scatter's variation the line actually explains.
//+------------------------------------------------------------------+
//|                                                 ScatterTypes.mqh |
//+------------------------------------------------------------------+
#ifndef SCATTERTYPES_MQH
#define SCATTERTYPES_MQH

//+------------------------------------------------------------------+
//| CTradePoint                                                      |
//| One closed trade reduced to the fields the scatter plot needs:   |
//| its symbol, hold duration in minutes, and net profit.            |
//+------------------------------------------------------------------+
struct CTradePoint
  {
   ulong             ticket;
   string            symbol;
   double            duration_minutes;
   double            profit;
  };

//+------------------------------------------------------------------+
//| CRegressionResult                                                |
//| The fitted line's slope and intercept, and the R-squared value   |
//| describing how much of the profit variation the line explains.   |
//+------------------------------------------------------------------+
struct CRegressionResult
  {
   double            slope;
   double            intercept;
   double            r_squared;
  };

#endif // SCATTERTYPES_MQH
//+------------------------------------------------------------------+
Section 2: CClosedTradeExtractor — Reading Duration and Profit Per Trade
Extracting a trade's duration requires the same open-time recovery problem seen whenever MQL5 deal history is walked: a closing deal only carries its own close time, so the matching open time has to be found by looking up the earliest deal sharing the same position ID.
//+------------------------------------------------------------------+
//|                                         ClosedTradeExtractor.mqh |
//+------------------------------------------------------------------+
#ifndef CLOSEDTRADEEXTRACTOR_MQH
#define CLOSEDTRADEEXTRACTOR_MQH

#include "ScatterTypes.mqh"

//+------------------------------------------------------------------+
//| CClosedTradeExtractor                                            |
//| Reads closed deal history for a date range and computes each     |
//| trade's hold duration in minutes and net profit.                 |
//+------------------------------------------------------------------+
class CClosedTradeExtractor
  {
private:
   datetime              FindOpenTime(ulong position_id, datetime close_time_utc) const;

public:
                     CClosedTradeExtractor(void);
                    ~CClosedTradeExtractor(void);

   int                   Read(datetime from, datetime to, CTradePoint &trades[]);
  };

//+------------------------------------------------------------------+
//| Constructor: no member state to initialize.                      |
//+------------------------------------------------------------------+
CClosedTradeExtractor::CClosedTradeExtractor(void)
  {
  }

//+------------------------------------------------------------------+
//| Destructor: no dynamic resources to release.                     |
//+------------------------------------------------------------------+
CClosedTradeExtractor::~CClosedTradeExtractor(void)
  {
  }
Read() filters to DEAL_ENTRY_OUT and DEAL_ENTRY_INOUT deals and combines DEAL_PROFIT, DEAL_SWAP, and DEAL_COMMISSION into one net profit figure per trade, since a trade that looks profitable on raw price movement alone can still lose money once swap and commission are counted. Duration is computed as the difference between the recovered open time and the close time, converted from seconds to minutes.
//+------------------------------------------------------------------+
//| Read                                                             |
//+------------------------------------------------------------------+
int CClosedTradeExtractor::Read(datetime from, datetime to, CTradePoint &trades[])
  {
//--- scope the terminal's history cache to the requested range
   if(!::HistorySelect(from, to))
     {
      ::Print("ScatterDashboard: HistorySelect failed, error ", ::GetLastError());
      return(0);
     }
   int      total       = ::HistoryDealsTotal();
   ::ArrayResize(trades, total);
   int      found       = 0;
   ulong    ticket      = 0;
   long     entry_type  = 0;
   double   profit      = 0.0;
   double   swap        = 0.0;
   double   commission  = 0.0;
   string   symbol      = "";
   datetime close_time  = 0;
   datetime open_time   = 0;
   ulong    position_id = 0;
//--- iterate every deal in the selected history range
   for(int i = 0; i < total; i++)
     {
      ticket = ::HistoryDealGetTicket(i);
      if(ticket == 0)
         continue;
      //--- keep only deals that represent an actual closed trade
      entry_type = ::HistoryDealGetInteger(ticket, DEAL_ENTRY);
      if(entry_type != DEAL_ENTRY_OUT && entry_type != DEAL_ENTRY_INOUT)
         continue;
      profit      = ::HistoryDealGetDouble(ticket, DEAL_PROFIT);
      swap        = ::HistoryDealGetDouble(ticket, DEAL_SWAP);
      commission  = ::HistoryDealGetDouble(ticket, DEAL_COMMISSION);
      symbol      = ::HistoryDealGetString(ticket, DEAL_SYMBOL);
      close_time  = (datetime)::HistoryDealGetInteger(ticket, DEAL_TIME);
      position_id = (ulong)::HistoryDealGetInteger(ticket, DEAL_POSITION_ID);
      //--- recover the open time from the earliest deal on this position
      open_time = FindOpenTime(position_id, close_time);
      //--- populate the trade point
      trades[found].ticket           = ticket;
      trades[found].symbol           = symbol;
      trades[found].duration_minutes = (double)(close_time - open_time) / 60.0;
      trades[found].profit           = profit + swap + commission;
      found++;
     }
   ::ArrayResize(trades, found);
   return(found);
  }
FindOpenTime() searches the currently selected history for the earliest deal sharing the given position id and returns its time. It falls back to close_time_utc if no earlier deal on the position is found.
//+------------------------------------------------------------------+
//| FindOpenTime                                                     |
//+------------------------------------------------------------------+
datetime CClosedTradeExtractor::FindOpenTime(ulong position_id, datetime close_time_utc) const
  {
   int      total        = ::HistoryDealsTotal();
   datetime earliest     = close_time_utc;
   bool     found        = false;
   ulong    ticket       = 0;
   ulong    scanned_id   = 0;
   datetime scanned_time = 0;
   for(int i = 0; i < total; i++)
     {
      ticket     = ::HistoryDealGetTicket(i);
      if(ticket == 0)
         continue;
      scanned_id = (ulong)::HistoryDealGetInteger(ticket, DEAL_POSITION_ID);
      if(scanned_id != position_id)
         continue;
      scanned_time = (datetime)::HistoryDealGetInteger(ticket, DEAL_TIME);
      if(!found || scanned_time < earliest)
        {
         earliest = scanned_time;
         found    = true;
        }
     }
   return(earliest);
  }
Section 3 — Simple Linear Regression and R²
Before looking at CRegressionCalculator's code, it helps to see the two formulas it implements, since the variable names in the code (ss_xy, ss_xx, ss_tot, ss_res) are shorthand for exactly this math.
Given a set of (duration, profit) pairs, the least-squares regression line finds the slope and intercept that minimize the squared vertical distance between the line and every point. The slope is the ratio of how duration and profit vary together to how much duration varies on its own:
| Symbol | Meaning | Formula |
|---|---|---|
| x̄, ȳ | mean duration, mean profit | sum divided by count |
| SS_xy | how duration and profit co-vary | Σ (xᵢ − x̄)(yᵢ − ȳ) |
| SS_xx | how duration varies on its own | Σ (xᵢ − x̄)² |
| slope | change in profit per minute | SS_xy / SS_xx |
| intercept | fitted profit at zero minutes | ȳ − slope × x̄ |
A negative slope means, on average, every extra minute a trade is held corresponds to less profit. That is a correlation across the account's own history, not a law, and it says nothing about any single future trade, but it is exactly the signal a trader optimizing hold time is looking for.
R² answers a different question: not what the trend is, but how much to trust it. It compares how much of the profit's total variation is left unexplained after fitting the line, against how much variation existed in the first place:
| Symbol | Meaning | Formula |
|---|---|---|
| SS_tot | total variation in profit | Σ (yᵢ − ȳ)² |
| SS_res | variation left over after the fit | Σ (yᵢ − (intercept + slope × xᵢ))² |
| R² | fraction of variation explained | 1 − SS_res / SS_tot |
An R² near 1.0 means duration explains most of the spread in profit; an R² near 0.0 means the fitted line performs barely better than guessing the average profit for every trade, and the slope, however striking it looks, should not be trusted as a strong signal. R² measures only how well a straight line fits this particular historical sample; it says nothing about whether the relationship is causal, whether it will hold on future trades, or whether a handful of outlier trades are driving the whole fit. A high R² is evidence the line describes the past well, not a guarantee about the future. A real account mixing several symbols with very different trading styles will often land much closer to 0.0 than to 1.0, since one straight line rarely describes several unrelated strategies at once.
Section 4: CRegressionCalculator — Fitting the Line and Finding the Best-Performing Bucket
After duration and profit are computed for each trade, the data still has to be summarized. That is what CRegressionCalculator does. It looks at the same list of trades from two different angles: one method asks whether there's an overall trend across the whole dataset, and the other asks a more down-to-earth question, which specific stretch of hold times has actually paid off best. Neither answer is inherently more correct. They capture different patterns, and showing both provides a cross-check.
//+------------------------------------------------------------------+
//|                                         RegressionCalculator.mqh |
//+------------------------------------------------------------------+
#ifndef REGRESSIONCALCULATOR_MQH
#define REGRESSIONCALCULATOR_MQH

#include "ScatterTypes.mqh"

//+------------------------------------------------------------------+
//| CRegressionCalculator                                            |
//| Fits a least-squares line to duration versus profit and reports  |
//| the R². Also buckets trades by duration to identify the          |
//| best-performing historical bucket.                               |
//+------------------------------------------------------------------+
class CRegressionCalculator
  {
public:
                     CRegressionCalculator(void);
                    ~CRegressionCalculator(void);

   bool                  Compute(const CTradePoint &trades[], int count,
                                 CRegressionResult &result_out);
   string                ComputeBestHistoricalBucket(const CTradePoint &trades[], int count,
                                 double &best_avg_profit_out);
  };

//+------------------------------------------------------------------+
//| Constructor: no member state to initialize.                      |
//+------------------------------------------------------------------+
CRegressionCalculator::CRegressionCalculator(void)
  {
  }

//+------------------------------------------------------------------+
//| Destructor: no dynamic resources to release.                     |
//+------------------------------------------------------------------+
CRegressionCalculator::~CRegressionCalculator(void)
  {
  }
Compute() is the method that does the actual line-fitting, following the formulas from the theory section above step by step: find the two means, accumulate how duration and profit move together against how much duration moves on its own, divide one by the other for the slope, then work out the intercept from there. It bails out early in two situations where a slope simply wouldn't mean anything: fewer than two trades, or every trade happening to share the exact same duration, since without any spread in duration there's nothing for a slope to describe.
//+------------------------------------------------------------------+
//| Compute                                                          |
//+------------------------------------------------------------------+
bool CRegressionCalculator::Compute(const CTradePoint &trades[], int count,
                                    CRegressionResult &result_out)
  {
   if(count < 2)
      return(false);
//--- compute the mean duration and mean profit across all trades
   double sum_x = 0.0;
   double sum_y = 0.0;
   for(int i = 0; i < count; i++)
     {
      sum_x += trades[i].duration_minutes;
      sum_y += trades[i].profit;
     }
   double mean_x = sum_x / count;
   double mean_y = sum_y / count;
//--- accumulate the co-variation and the duration-only variation
   double ss_xy = 0.0;
   double ss_xx = 0.0;
   for(int i = 0; i < count; i++)
     {
      double dx = trades[i].duration_minutes - mean_x;
      double dy = trades[i].profit - mean_y;
      ss_xy += dx * dy;
      ss_xx += dx * dx;
     }
   if(ss_xx <= 0.0)
      return(false);
//--- the slope and intercept of the least-squares line
   double slope     = ss_xy / ss_xx;
   double intercept = mean_y - slope * mean_x;
//--- compute R²: one minus the leftover variation over the total variation
   double ss_tot = 0.0;
   double ss_res = 0.0;
   for(int i = 0; i < count; i++)
     {
      double fitted   = intercept + slope * trades[i].duration_minutes;
      double residual = trades[i].profit - fitted;
      ss_res += residual * residual;
      ss_tot += (trades[i].profit - mean_y) * (trades[i].profit - mean_y);
     }
   double r_squared = (ss_tot > 0.0) ? (1.0 - ss_res / ss_tot) : 0.0;
   result_out.slope     = slope;
   result_out.intercept = intercept;
   result_out.r_squared = r_squared;
   return(true);
  }
ComputeBestHistoricalBucket() takes a completely different approach, and deliberately so. Rather than trusting one straight line to describe the whole account, it just sorts every trade into one of three plain buckets, short, medium, and long holds, and averages the profit in each. Whichever bucket comes out ahead gets reported as the best-performing bucket. There's no curve-fitting here, so it does not assume profit changes smoothly as duration grows, but it carries its own assumptions: the 60- and 240-minute cutoffs are fixed rather than derived from the data, every trade counts equally regardless of size, and no significance test confirms the winning bucket's average is real rather than noise. That simplicity is the point: a bucket-based view can catch a sharp cutoff, like everything past four hours quietly losing money, that a single regression line would blur into an average and hide.
//+-------------------------------------------------------------------+
//| ComputeBestHistoricalBucket                                       |
//+-------------------------------------------------------------------+
string CRegressionCalculator::ComputeBestHistoricalBucket(const CTradePoint &trades[], int count,
      double &best_avg_profit_out)
  {
   double short_sum  = 0.0;
   int short_count   = 0;
   double medium_sum = 0.0;
   int medium_count  = 0;
   double long_sum   = 0.0;
   int long_count    = 0;
//--- sort every trade into a duration bucket and accumulate its profit
   for(int i = 0; i < count; i++)
     {
      double d = trades[i].duration_minutes;
      if(d <= 60.0)
        {
         short_sum += trades[i].profit;
         short_count++;
        }
      else
         if(d <= 240.0)
           {
            medium_sum += trades[i].profit;
            medium_count++;
           }
         else
           {
            long_sum += trades[i].profit;
            long_count++;
           }
     }
//--- compute each bucket's average profit, guarding against an empty bucket
   double short_avg  = (short_count  > 0) ? short_sum  / short_count  : 0.0;
   double medium_avg = (medium_count > 0) ? medium_sum / medium_count : 0.0;
   double long_avg   = (long_count   > 0) ? long_sum   / long_count   : 0.0;
//--- report whichever non-empty bucket had the highest average profit;
//--- an empty bucket must never be selected by a default of 0.0 outscoring
//--- a genuinely negative average in a bucket that actually has trades
   string label    = "";
   double best     = 0.0;
   bool   have_any = false;

   if(short_count > 0)
     {
      label    = "0-60 min";
      best     = short_avg;
      have_any = true;
     }
   if(medium_count > 0 && (!have_any || medium_avg > best))
     {
      best     = medium_avg;
      label    = "60-240 min";
      have_any = true;
     }
   if(long_count > 0 && (!have_any || long_avg > best))
     {
      best     = long_avg;
      label    = "240+ min";
      have_any = true;
     }
   best_avg_profit_out = best;
   return(have_any ? label : "N/A");
  }
Both methods take the same flat array of trades as input and hand back their answer independently of one another, so either one works fine on its own if that's all a caller needs. The dashboard's main script calls both anyway and shows them together, the regression line as the account's overall trend, the best-performing bucket as a simpler check, carrying its own assumptions rather than none, on whether that trend actually holds up.
Section 5: Why the Duration Axis Is Log-Scaled
A real trading account rarely has hold times clustered neatly around one typical value. Most trades might last minutes to a few hours, while a small number sit open for days, sometimes because of a forgotten position or an unusually stubborn drawdown before the exit finally triggered. That kind of distribution, mostly small values with a long tail of much larger ones, is exactly what a linear axis handles badly.
The problem is proportional space. On a linear axis spanning 0 to 10,000 minutes, a trade at 20 minutes and a trade at 200 minutes sit almost on top of each other, both squeezed into the first 2% of the width, even though one trade lasted ten times longer than the other. Every ordinary trade ends up crushed into a sliver on one edge, and the chart's only visible structure becomes wherever the few extreme outliers happen to land.
| Duration (minutes) | Linear position (0–10,000 scale) | log10(duration + 1) position (0–4 scale) |
|---|---|---|
| 20 | 0.2% | 33.1% |
| 200 | 2.0% | 57.6% |
| 2,000 | 20.0% | 82.5% |
| 10,000 | 100.0% | 100.0% |
A log10 transform fixes this by measuring distance in orders of magnitude rather than raw units: the gap from 20 to 200 minutes (a 10x increase) takes up the same width as the gap from 200 to 2,000 minutes (also a 10x increase), regardless of how large the raw numbers get. Adding 1 before taking the logarithm, log10(duration + 1), avoids taking the logarithm of zero for any trade that closed at the same time it opened.
One consequence worth being explicit about: the regression itself is still fitted on the real, linear duration values, since "profit per minute" only means something in linear units. But once the chart's x-axis is log-scaled, that straight fitted line no longer looks straight when drawn in pixel space, it curves gently, because equal steps in pixel space no longer correspond to equal steps in minutes. The chart accounts for this by sampling the fitted line at many points across the duration range and connecting them with short segments, tracing the curve's true shape rather than drawing one straight segment that would drift away from the actual fit.
Section 6: CScatterPlotChart — Rendering with CCanvas
The chart plots one dot per trade, positioned by duration on a log-scaled horizontal axis and profit on the vertical axis, colored by symbol so a trader running the same account across several instruments can see at a glance whether the duration-profit relationship holds for all of them or is really just one symbol's pattern.
//+------------------------------------------------------------------+ //| ScatterPlotChart.mqh | //+------------------------------------------------------------------+ #ifndef SCATTERPLOTCHART_MQH #define SCATTERPLOTCHART_MQH #include <Canvas\Canvas.mqh> #include "ScatterTypes.mqh" //+------------------------------------------------------------------+ //| CScatterPlotChart | //| Renders a duration-versus-profit scatter plot with a regression | //| line overlay and a summary footer, using a CCanvas panel. | //+------------------------------------------------------------------+ class CScatterPlotChart { private: CCanvas m_canvas; string m_object_name; bool m_created; string m_font_name; int m_font_size; uint m_font_flags; uint ColorForSymbol(const string symbol, string &known_symbols[], int known_count); uint HueForIndex(int index) const; int DurationToX(double duration_minutes, double log_min, double log_range, int plot_left, int plot_right) const; void CollectUniqueSymbols(const CTradePoint &trades[], int count, string &unique_out[]) const; public: CScatterPlotChart(void); ~CScatterPlotChart(void); bool Draw(const CTradePoint &trades[], int count, const CRegressionResult ®ression, bool has_regression, const string best_bucket_label, double best_bucket_avg_profit, int x, int y, int width, int height); void Clear(void); }; //+------------------------------------------------------------------+ //| Constructor: assigns a fixed object name for the canvas panel. | //| This dashboard only ever creates one scatter panel, so a single | //| constant name is sufficient; two instances of this class on the | //| same chart would collide and overwrite each other's panel. | //+------------------------------------------------------------------+ CScatterPlotChart::CScatterPlotChart(void) { m_object_name = "ScatterPlotPanel"; m_created = false; m_font_name = "Arial"; m_font_size = 12; m_font_flags = FW_BOLD; } //+------------------------------------------------------------------+ //| Destructor: intentionally does not remove the canvas panel. The | //| panel is a chart object owned by the chart itself, and must | //| remain visible after the CScatterPlotChart instance that drew it | //| goes out of scope at the end of a script's OnStart. | //+------------------------------------------------------------------+ CScatterPlotChart::~CScatterPlotChart(void) { }
Draw() first determines the padded profit range and the log-space duration bounds. Next, it collects the distinct symbols and lays out a wrapped legend so the plot area can be sized correctly. It plots each trade via DurationToX(), using the same symbol colors as the legend. When a regression fit succeeds, it then draws the regression curve by sampling the fitted line at 24 points in log space and connecting them with segments; when the fit fails, this step is skipped and the dots, legend, and footer are still drawn. Finally, it labels the min/max duration and renders the footer, positioning the slope, R² (when present), and best-bucket labels by measured text width to prevent overlap.
//+------------------------------------------------------------------+ //| Draw | //+------------------------------------------------------------------+ bool CScatterPlotChart::Draw(const CTradePoint &trades[], int count, const CRegressionResult ®ression, bool has_regression, const string best_bucket_label, double best_bucket_avg_profit, int x, int y, int width, int height) { Clear(); if(!m_canvas.CreateBitmapLabel(m_object_name, x, y, width, height, COLOR_FORMAT_ARGB_NORMALIZE)) { ::Print("ScatterDashboard: CreateBitmapLabel failed, error ", ::GetLastError()); return(false); } m_created = true; m_canvas.FontSet(m_font_name, m_font_size, m_font_flags); ::TextSetFont(m_font_name, m_font_size, m_font_flags); m_canvas.Erase(::ColorToARGB(clrWhiteSmoke, 255)); if(count < 1) { m_canvas.Update(); return(true); } //--- find the duration and profit range across every trade, with padding double min_dur = trades[0].duration_minutes; double max_dur = trades[0].duration_minutes; double min_pnl = trades[0].profit; double max_pnl = trades[0].profit; for(int i = 1; i < count; i++) { if(trades[i].duration_minutes < min_dur) min_dur = trades[i].duration_minutes; if(trades[i].duration_minutes > max_dur) max_dur = trades[i].duration_minutes; if(trades[i].profit < min_pnl) min_pnl = trades[i].profit; if(trades[i].profit > max_pnl) max_pnl = trades[i].profit; } double pnl_range = max_pnl - min_pnl; if(pnl_range <= 0.0) pnl_range = 1.0; double pnl_pad = pnl_range * 0.1; min_pnl -= pnl_pad; max_pnl += pnl_pad; pnl_range = max_pnl - min_pnl; //--- the duration axis is log-scaled rather than linear, since a handful of //--- very long trades otherwise crush every ordinary-length trade into a //--- sliver of the panel; log10(duration + 1) spreads short and long holds //--- across comparable pixel widths instead of one dominating the axis double log_min = ::MathLog10(min_dur + 1.0); double log_max = ::MathLog10(max_dur + 1.0); double log_range = log_max - log_min; if(log_range <= 0.0) log_range = 1.0; //--- reserve space for the footer row at the bottom of the panel int footer_height = m_font_size + 16; int plot_left = 50; int plot_right = width - 10; int legend_left = plot_left; //--- collect every distinct symbol first, so the legend's height is known //--- before the plot area is laid out, and so every dot below can reuse //--- the same color-to-symbol assignment the legend itself displays string unique_symbols[]; CollectUniqueSymbols(trades, count, unique_symbols); int symbol_count = ::ArraySize(unique_symbols); int dot_radius = 5; int legend_gap = 14; int legend_row_h = m_font_size + 8; //--- wrap legend entries onto as many rows as needed for the panel width int legend_rows = 1; int row_x = legend_left; for(int i = 0; i < symbol_count; i++) { uint entry_w = 0; uint entry_h = 0; ::TextGetSize(unique_symbols[i], entry_w, entry_h); int needed = (dot_radius * 2) + 6 + (int)entry_w + legend_gap; if(row_x + needed > plot_right && row_x > legend_left) { legend_rows++; row_x = legend_left; } row_x += needed; } int legend_height = 6 + (legend_rows * legend_row_h); int plot_top = legend_height; int plot_bottom = height - footer_height; //--- draw the legend itself: one colored dot plus symbol name per entry, //--- wrapping onto a new row whenever the next entry would run past the //--- right edge of the plot area int legend_y = 6; row_x = legend_left; for(int i = 0; i < symbol_count; i++) { uint entry_w = 0; uint entry_h = 0; ::TextGetSize(unique_symbols[i], entry_w, entry_h); int needed = (dot_radius * 2) + 6 + (int)entry_w + legend_gap; if(row_x + needed > plot_right && row_x > legend_left) { legend_y += legend_row_h; row_x = legend_left; } uint dot_color = ColorForSymbol(unique_symbols[i], unique_symbols, symbol_count); m_canvas.FillCircle(row_x + dot_radius, legend_y + (legend_row_h / 2), dot_radius, dot_color); m_canvas.TextOut(row_x + (dot_radius * 2) + 6, legend_y + 2, unique_symbols[i], ::ColorToARGB(clrBlack, 255)); row_x += needed; } //--- plot every trade as a colored dot, positioned on the log-scaled axis, //--- reusing the same unique_symbols list so a symbol's dot color always //--- matches its color in the legend drawn above for(int i = 0; i < count; i++) { int px = DurationToX(trades[i].duration_minutes, log_min, log_range, plot_left, plot_right); int py = plot_bottom - (int)(((trades[i].profit - min_pnl) / pnl_range) * (plot_bottom - plot_top)); uint dot_color = ColorForSymbol(trades[i].symbol, unique_symbols, symbol_count); m_canvas.FillCircle(px, py, 4, dot_color); } //--- overlay the regression curve only when a fit actually succeeded. A //--- failed fit (for example, every trade sharing an identical duration) //--- still leaves the dots, legend, and best-bucket footer meaningful, so //--- the whole panel is not thrown away just because the line could not //--- be drawn if(has_regression) { int segment_count = 24; int prev_x = 0; int prev_y = 0; for(int s = 0; s <= segment_count; s++) { double log_pos = log_min + (log_range * s / segment_count); double duration_s = ::MathPow(10.0, log_pos) - 1.0; double fitted = regression.intercept + regression.slope * duration_s; int sx = DurationToX(duration_s, log_min, log_range, plot_left, plot_right); int sy = plot_bottom - (int)(((fitted - min_pnl) / pnl_range) * (plot_bottom - plot_top)); if(s > 0) m_canvas.Line(prev_x, prev_y, sx, sy, ::ColorToARGB(clrBlack, 255)); prev_x = sx; prev_y = sy; } } //--- label the actual duration range so the log-scaled axis stays readable string min_dur_text = ::DoubleToString(min_dur, 0) + " min"; string max_dur_text = ::DoubleToString(max_dur, 0) + " min"; m_canvas.TextOut(plot_left, plot_bottom + 2, min_dur_text, ::ColorToARGB(clrGray, 255)); uint max_dur_w = 0; uint max_dur_h = 0; ::TextGetSize(max_dur_text, max_dur_w, max_dur_h); m_canvas.TextOut(plot_right - (int)max_dur_w, plot_bottom + 2, max_dur_text, ::ColorToARGB(clrGray, 255)); //--- draw the summary footer. Slope and R^2 are only drawn when a fit //--- succeeded; the best-bucket figure is always drawn, since it never //--- depends on the regression. Each entry's x-position is measured off //--- the previous one, so the footer stays correctly spaced regardless of //--- whether it holds two entries or three int footer_y = plot_bottom + footer_height / 2 + 4; int next_x = 10; uint measured_w = 0; uint measured_h = 0; int gap = 16; if(has_regression) { string slope_text = "Slope: " + ::DoubleToString(regression.slope, 3) + "/min"; string r2_text = "R^2: " + ::DoubleToString(regression.r_squared, 2); m_canvas.TextOut(next_x, footer_y, slope_text, ::ColorToARGB(clrBlack, 255)); ::TextGetSize(slope_text, measured_w, measured_h); next_x += (int)measured_w + gap; m_canvas.TextOut(next_x, footer_y, r2_text, ::ColorToARGB(clrBlack, 255)); ::TextGetSize(r2_text, measured_w, measured_h); next_x += (int)measured_w + gap; } string range_text = "Best bucket: " + best_bucket_label + " (avg " + ::DoubleToString(best_bucket_avg_profit, 2) + ")"; m_canvas.TextOut(next_x, footer_y, range_text, ::ColorToARGB(clrBlack, 255)); m_canvas.Update(); return(true); }
DurationToX() is the small helper both the dots and the regression curve share: it converts a raw duration in minutes into a pixel x-position using the log10 transform described above, so every caller maps duration to pixels the exact same way.
//+------------------------------------------------------------------+
//| DurationToX                                                      |
//+------------------------------------------------------------------+
int CScatterPlotChart::DurationToX(double duration_minutes, double log_min, double log_range,
                                   int plot_left, int plot_right) const
  {
   double log_val = ::MathLog10(duration_minutes + 1.0);
   double frac     = (log_val - log_min) / log_range;
   return(plot_left + (int)(frac * (plot_right - plot_left)));
  }
CollectUniqueSymbols() builds the list of distinct symbols before anything else is laid out, since the legend's row count, and therefore the vertical space it needs, has to be known before the plot area beneath it can be sized.
//+------------------------------------------------------------------+
//| CollectUniqueSymbols                                             |
//+------------------------------------------------------------------+
void CScatterPlotChart::CollectUniqueSymbols(const CTradePoint &trades[], int count,
      string &unique_out[]) const
  {
   ::ArrayResize(unique_out, 0);
   for(int i = 0; i < count; i++)
     {
      bool already_seen = false;
      int  n = ::ArraySize(unique_out);
      for(int j = 0; j < n; j++)
        {
         if(unique_out[j] == trades[i].symbol)
           {
            already_seen = true;
            break;
           }
        }
      if(!already_seen)
        {
         ::ArrayResize(unique_out, n + 1);
         unique_out[n] = trades[i].symbol;
        }
     }
  }
ColorForSymbol() assigns each unique symbol a color by looking it up in (or appending it to) a caller-supplied list, so the same symbol always gets the same color across the whole chart. Rather than drawing from a short fixed list, a new symbol's color is generated procedurally by HueForIndex(), so distinct colors do not run out and start repeating once an account trades more than a handful of symbols.
//+------------------------------------------------------------------+
//| ColorForSymbol                                                   |
//+------------------------------------------------------------------+
uint CScatterPlotChart::ColorForSymbol(const string symbol, string &known_symbols[], int known_count)
  {
//--- look for the symbol among those already seen
   for(int i = 0; i < known_count; i++)
     {
      if(known_symbols[i] == symbol)
         return(HueForIndex(i));
     }
//--- a new symbol: append it and generate its color from its index
   ::ArrayResize(known_symbols, known_count + 1);
   known_symbols[known_count] = symbol;
   return(HueForIndex(known_count));
  }
HueForIndex() generates a color by stepping hue around the color wheel by the golden angle (about 137.5 degrees) each time a new symbol appears. Because that step is irrational relative to a full 360-degree rotation, successive colors stay visually distinct from their neighbors far longer than a short fixed palette that repeats exactly every few symbols. Saturation and brightness are held fixed so every generated color stays similarly readable against the panel.
//+------------------------------------------------------------------+
//| HueForIndex                                                      |
//+------------------------------------------------------------------+
uint CScatterPlotChart::HueForIndex(int index) const
  {
   double hue = ::MathMod(index * 137.508, 360.0);
   double sat = 0.65;
   double val = 0.80;
//--- standard HSV to RGB conversion
   double c  = val * sat;
   double x  = c * (1.0 - ::MathAbs(::MathMod(hue / 60.0, 2.0) - 1.0));
   double m  = val - c;
   double r1 = 0.0, g1 = 0.0, b1 = 0.0;
   if(hue < 60.0)
     {
      r1 = c;
      g1 = x;
      b1 = 0.0;
     }
   else if(hue < 120.0)
     {
      r1 = x;
      g1 = c;
      b1 = 0.0;
     }
   else if(hue < 180.0)
     {
      r1 = 0.0;
      g1 = c;
      b1 = x;
     }
   else if(hue < 240.0)
     {
      r1 = 0.0;
      g1 = x;
      b1 = c;
     }
   else if(hue < 300.0)
     {
      r1 = x;
      g1 = 0.0;
      b1 = c;
     }
   else
     {
      r1 = c;
      g1 = 0.0;
      b1 = x;
     }
   uchar r = (uchar)((r1 + m) * 255.0);
   uchar g = (uchar)((g1 + m) * 255.0);
   uchar b = (uchar)((b1 + m) * 255.0);
   return(::ColorToARGB((color)((b << 16) | (g << 8) | r), 255));
  }
This method is not declared const, even though it looks at first glance like a simple lookup: it both resizes and writes into known_symbols, and MQL5 treats a reference array parameter inside a const method as read-only, regardless of whether the parameter itself is declared const. A method that genuinely needs to grow the array it was handed cannot carry the const qualifier.
Clear() follows the same pattern used throughout this dashboard's CCanvas work: it removes the bitmap and resets the created flag, still runs at the top of Draw() to avoid leaving a stale bitmap behind, and remains available for a caller that wants to tear the panel down explicitly.
//+------------------------------------------------------------------+
//| Clear                                                            |
//+------------------------------------------------------------------+
void CScatterPlotChart::Clear(void)
  {
   if(!m_created)
      return;
   m_canvas.Destroy();
   m_created = false;
  }
Section 7: CTradeTablePrinter — Per-Symbol Summary Table
The scatter plot shows every individual trade, but a trader who wants a quick per-symbol comparison needs a table: how many trades on each symbol, their average duration, and their average profit.
//+------------------------------------------------------------------+
//|                                            TradeTablePrinter.mqh |
//+------------------------------------------------------------------+
#ifndef TRADETABLEPRINTER_MQH
#define TRADETABLEPRINTER_MQH

#include "ScatterTypes.mqh"

//+------------------------------------------------------------------+
//| CTradeTablePrinter                                               |
//| Prints a per-symbol summary table to the Experts tab: trade      |
//| count, average duration, and average profit for each symbol.     |
//+------------------------------------------------------------------+
class CTradeTablePrinter
  {
private:
   string                PadRight(string value, int width) const;

public:
                     CTradeTablePrinter(void);
                    ~CTradeTablePrinter(void);

   void                  Print(const CTradePoint &trades[], int count) const;
  };

//+------------------------------------------------------------------+
//| Constructor: no member state to initialize.                      |
//+------------------------------------------------------------------+
CTradeTablePrinter::CTradeTablePrinter(void)
  {
  }

//+------------------------------------------------------------------+
//| Destructor: no dynamic resources to release.                     |
//+------------------------------------------------------------------+
CTradeTablePrinter::~CTradeTablePrinter(void)
  {
  }

//+------------------------------------------------------------------+
//| Print                                                            |
//| Groups trades by symbol and prints one row per symbol with the   |
//| trade count, average duration in minutes, and average profit.    |
//+------------------------------------------------------------------+
void CTradeTablePrinter::Print(const CTradePoint &trades[], int count) const
  {
   string symbols[];
   double dur_sum[];
   double pnl_sum[];
   int    trade_count[];
   ::ArrayResize(symbols, 0);
//--- accumulate duration and profit totals per distinct symbol
   for(int i = 0; i < count; i++)
     {
      int idx = -1;
      int n   = ::ArraySize(symbols);
      for(int j = 0; j < n; j++)
        {
         if(symbols[j] == trades[i].symbol)
           {
            idx = j;
            break;
           }
        }
      if(idx == -1)
        {
         ::ArrayResize(symbols,     n + 1);
         ::ArrayResize(dur_sum,     n + 1);
         ::ArrayResize(pnl_sum,     n + 1);
         ::ArrayResize(trade_count, n + 1);
         symbols[n]     = trades[i].symbol;
         dur_sum[n]     = trades[i].duration_minutes;
         pnl_sum[n]     = trades[i].profit;
         trade_count[n] = 1;
        }
      else
        {
         dur_sum[idx] += trades[i].duration_minutes;
         pnl_sum[idx] += trades[i].profit;
         trade_count[idx]++;
        }
     }
//--- print the header row with fixed-width column labels
   string header = PadRight("Symbol", 12) + PadRight("Trades", 10) +
                   PadRight("Avg Dur(min)", 14) + PadRight("Avg Profit", 14);
   ::Print(header);
//--- print one row per symbol
   int symbol_count = ::ArraySize(symbols);
   for(int i = 0; i < symbol_count; i++)
     {
      double avg_dur = dur_sum[i] / trade_count[i];
      double avg_pnl = pnl_sum[i] / trade_count[i];
      string row = PadRight(symbols[i], 12) +
                   PadRight(::IntegerToString(trade_count[i]), 10) +
                   PadRight(::DoubleToString(avg_dur, 1), 14) +
                   PadRight(::DoubleToString(avg_pnl, 2), 14);
      ::Print(row);
     }
  }

//+------------------------------------------------------------------+
//| PadRight                                                         |
//| Pads a string with trailing spaces up to the given width, or     |
//| returns the original string unchanged if it already meets or     |
//| exceeds that width.                                              |
//+------------------------------------------------------------------+
string CTradeTablePrinter::PadRight(string value, int width) const
  {
   int need = width - ::StringLen(value);
   if(need <= 0)
      return(value);
   string result = value;
   for(int i = 0; i < need; i++)
      result += " ";
   return(result);
  }

#endif // TRADETABLEPRINTER_MQH
//+------------------------------------------------------------------+
Section 8: ScatterPlotDashboard.mq5 — Assembling the Main Script
The main script's inputs cover the lookback window and the panel's position and size on the chart.
//+------------------------------------------------------------------+
//|                                         ScatterPlotDashboard.mq5 |
//+------------------------------------------------------------------+
#property script_show_inputs

#include <ScatterDashboard/ScatterTypes.mqh>
#include <ScatterDashboard/ClosedTradeExtractor.mqh>
#include <ScatterDashboard/RegressionCalculator.mqh>
#include <ScatterDashboard/ScatterPlotChart.mqh>
#include <ScatterDashboard/TradeTablePrinter.mqh>

input int InpLookbackDays = 90;    // Number of days to look back from now
input int InpPanelX       = 20;    // Canvas panel X coordinate
input int InpPanelY       = 20;    // Canvas panel Y coordinate
input int InpPanelWidth   = 640;   // Canvas panel width in pixels
input int InpPanelHeight  = 300;   // Canvas panel height in pixels
OnStart() extracts every closed trade in the lookback window and stops early only if none are found. It then attempts the regression fit, which requires at least two trades to produce a meaningful slope and silently skips itself otherwise, identifies the best-performing historical duration bucket regardless, and renders both the scatter plot and the per-symbol table either way.
//+------------------------------------------------------------------+
//| OnStart                                                          |
//+------------------------------------------------------------------+
void OnStart(void)
  {
//--- resolve the date range from the lookback input
   datetime to_time   = ::TimeCurrent();
   datetime from_time = to_time - (InpLookbackDays * 86400);
//--- extract closed trades with their duration and profit
   CClosedTradeExtractor extractor;
   CTradePoint           trades[];
   int                   trade_count = extractor.Read(from_time, to_time, trades);
   ::Print("ScatterDashboard: extracted ", trade_count, " closed trades");
   if(trade_count < 1)
     {
      ::Print("ScatterDashboard: no closed trades found in the selected range");
      return;
     }
//--- fit the regression line and find the best-performing bucket
   CRegressionCalculator calculator;
   CRegressionResult     regression;
   bool has_regression = calculator.Compute(trades, trade_count, regression);
   if(!has_regression)
     {
      regression.slope     = 0.0;
      regression.intercept = 0.0;
      regression.r_squared = 0.0;
      ::Print("ScatterDashboard: regression could not be computed (durations may be identical); showing scatter plot and table without a fitted line");
     }
   double best_bucket_avg_profit = 0.0;
   string best_bucket            = calculator.ComputeBestHistoricalBucket(trades, trade_count, best_bucket_avg_profit);
   ::PrintFormat("ScatterDashboard: slope %.4f/min, R^2 %.4f, best bucket %s (avg profit %.2f)",
                 regression.slope, regression.r_squared, best_bucket, best_bucket_avg_profit);
//--- render the scatter plot
   CScatterPlotChart chart;
   chart.Draw(trades, trade_count, regression, has_regression, best_bucket, best_bucket_avg_profit,
              InpPanelX, InpPanelY, InpPanelWidth, InpPanelHeight);
//--- print the per-symbol summary table
   CTradeTablePrinter printer;
   printer.Print(trades, trade_count);
  }
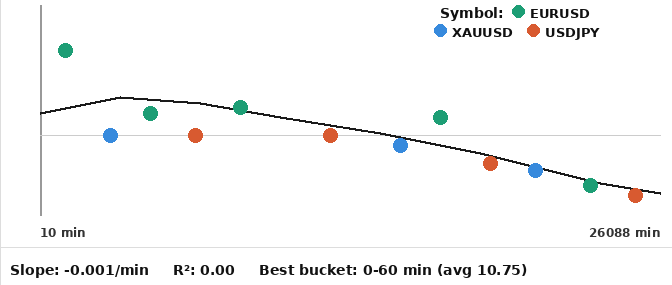
Scatter plot mock-up image
Section 9: Verification — TestScatterAnalytics.mq5
The verification script builds a fixed synthetic set of 26 trades: 12 short trades under an hour, 8 medium trades between one and four hours, and 6 long trades over four hours, with profit deliberately declining as duration increases. It also checks the regression and bucket logic against numbers worked out by hand, including a synthetic case designed to catch the empty-bucket selection bug directly.
//+------------------------------------------------------------------+
//|                                         TestScatterAnalytics.mq5 |
//+------------------------------------------------------------------+

#include <ScatterDashboard/ScatterTypes.mqh>
#include <ScatterDashboard/RegressionCalculator.mqh>

#define ASSERT(condition, message) TestAssert((condition), (message))

int g_pass_count = 0;
int g_fail_count = 0;

//+------------------------------------------------------------------+
//| TestAssert                                                       |
//| Prints a pass or fail message for a single test condition and    |
//| tracks the running pass and fail counts.                         |
//+------------------------------------------------------------------+
void TestAssert(bool condition, string message)
  {
   if(condition)
     {
      g_pass_count++;
      ::Print("PASS: ", message);
     }
   else
     {
      g_fail_count++;
      ::Print("FAIL: ", message);
     }
  }

//+------------------------------------------------------------------+
//| OnStart                                                          |
//| Builds a synthetic set of 26 trades with profit declining as     |
//| duration increases, then checks the regression fit and the       |
//| best-performing historical bucket against hand-worked values,    |
//| including a case where the short bucket is empty.                |
//+------------------------------------------------------------------+
void OnStart(void)
  {
//--- durations in minutes and matching profits, 12 short, 8 medium, 6 long
   double d[26] = {10,15,20,25,30,35,40,45,50,55,12,18,
                   70,90,110,130,150,170,200,230,
                   250,300,350,400,450,500
                  };
   double p[26] = {15,20,10,-5,25,12,-8,18,22,9,-3,14,
                   10,-15,5,20,-10,8,-2,12,
                   -20,-35,-15,-40,-25,-30
                  };
   CTradePoint trades[26];
   for(int i = 0; i < 26; i++)
     {
      trades[i].ticket           = (ulong)(i + 1);
      trades[i].symbol           = "EURUSD";
      trades[i].duration_minutes = d[i];
      trades[i].profit           = p[i];
     }
//--- fit the regression line
   CRegressionCalculator calculator;
   CRegressionResult     regression;
   bool ok = calculator.Compute(trades, 26, regression);
//--- test 1: the regression should succeed with 26 distinct-duration trades
   ASSERT(ok, "regression computes successfully for 26 trades");
//--- test 2: the slope should be negative, since profit declines with duration
   ASSERT(regression.slope < 0.0,
          "slope is negative, since profit declines as duration increases");
//--- test 3: the slope matches the hand-worked value
   ASSERT(::MathAbs(regression.slope - (-0.097558)) < 0.0001,
          "slope computes to approximately -0.0976 per minute");
//--- test 4: the intercept matches the hand-worked value
   ASSERT(::MathAbs(regression.intercept - 13.781949) < 0.001,
          "intercept computes to approximately 13.78");
//--- test 5: R² matches the hand-worked value
   ASSERT(::MathAbs(regression.r_squared - 0.594973) < 0.001,
          "R^2 computes to approximately 0.595");
//--- find the best-performing historical bucket
   double best_avg = 0.0;
   string range = calculator.ComputeBestHistoricalBucket(trades, 26, best_avg);
//--- test 6: the short duration bucket should be identified as best-performing
   ASSERT(range == "0-60 min",
          "the 0-60 minute bucket is identified as the best-performing historical bucket");
//--- test 7: the short bucket's average profit matches the hand-worked value
   ASSERT(::MathAbs(best_avg - 10.75) < 0.001,
          "the best historical bucket's average profit computes to 10.75");
//--- test 8 and 9: an empty short bucket must never be selected by default.
//--- 2 medium trades (avg -10) and 2 long trades (avg -20), no short
//--- trades at all; the fixed bug would have returned "0-60 min" here
//--- since an empty bucket's average defaults to 0.0, which beats both
//--- real, negative bucket averages
   CTradePoint empty_bucket_trades[4];
   empty_bucket_trades[0].symbol           = "EURUSD";
   empty_bucket_trades[0].duration_minutes = 70.0;
   empty_bucket_trades[0].profit           = -5.0;
   empty_bucket_trades[1].symbol           = "EURUSD";
   empty_bucket_trades[1].duration_minutes = 90.0;
   empty_bucket_trades[1].profit           = -15.0;
   empty_bucket_trades[2].symbol           = "EURUSD";
   empty_bucket_trades[2].duration_minutes = 300.0;
   empty_bucket_trades[2].profit           = -15.0;
   empty_bucket_trades[3].symbol           = "EURUSD";
   empty_bucket_trades[3].duration_minutes = 400.0;
   empty_bucket_trades[3].profit           = -25.0;
   double empty_bucket_best_avg = 0.0;
   string empty_bucket_label = calculator.ComputeBestHistoricalBucket(empty_bucket_trades, 4, empty_bucket_best_avg);
   ASSERT(empty_bucket_label != "0-60 min",
          "an empty short bucket is never selected by default over real, negative bucket averages");
   ASSERT(empty_bucket_label == "60-240 min",
          "the least-negative non-empty bucket (60-240 min, avg -10.0) is correctly selected as best");
//--- print the final summary of pass and fail counts
   ::Print("TestScatterAnalytics: ", g_pass_count, " passed, ", g_fail_count, " failed");
  }
//+------------------------------------------------------------------+
Section 10: Extending the Dashboard
A trader who suspects the duration-profit relationship is not a straight line, for instance a sharp cliff at some threshold rather than a steady decline, could extend CRegressionCalculator with a polynomial fit or finer-grained bucketing, showing average profit for every 30-minute band rather than just three broad ranges.
Filtering the scatter plot to a single symbol would let a trader check whether the account-wide trend actually holds for the specific instrument they are trying to optimize, since a strong trend on the whole account can sometimes be driven by one symbol alone, or, just as often, a weak account-wide trend can be hiding a much clearer pattern within a single symbol that gets diluted once every other symbol is mixed in. This would mean adding a symbol parameter to CClosedTradeExtractor::Read() and skipping any deal whose DEAL_SYMBOL does not match.
Exporting every trade point to CSV would let a trader run a more sophisticated statistical analysis outside the terminal.
A rolling-window version could refit the regression over just the most recent N trades rather than the whole lookback period, showing whether the duration-profit relationship is stable over time or has been drifting as the trader's strategy or the market conditions changed.
Section 11: Limitations
The regression assumes a straight-line relationship, and R² only measures how well that line fits the data, not whether a different shape, such as a step change, would fit better. The duration-bucket analysis helps here, but a suspected sharp cutoff should be checked against both figures rather than either alone.
A regression fit across several mixed symbols can produce a low R² even when each symbol individually shows a clear pattern. A low combined R² means duration may matter differently per symbol, not that it fails to matter at all.
Net profit includes swap and commission but not slippage or other execution costs; a trader who tracks those needs to fold them in separately.
Profit is raw account-currency profit, not normalized by position size, risk, or pip value. A duration-profit correlation may partly reflect that larger or riskier trades cluster at certain durations rather than duration itself driving the result.
FindOpenTime() only searches within the selected history range. A position opened before that range but closed inside it will have its duration understated, since the fallback uses the close time as the open time rather than flagging it as unknown.
Each DEAL_ENTRY_OUT or DEAL_ENTRY_INOUT deal becomes one scatter point, so a position closed through several partial fills appears as multiple points with truncated durations and partial profits, rather than one dot per completed position.
The procedural color generator spaces colors by a fixed angle rather than cycling a short palette, so collisions are far less frequent, though not impossible: with enough symbols, two generated hues can eventually round to the same displayed color once mapped to 8-bit channels.
The 60- and 240-minute bucket boundaries are fixed rather than derived from the data, so a strategy whose real cutoff sits elsewhere, say 90 minutes, will have its trades split across the wrong buckets.
When every bucket is empty, ComputeBestHistoricalBucket() returns "N/A" rather than a misleading default; this should be read as "no trades in this window," not an error.
A single trade in the lookback window produces a scatter plot with one dot and a table with one row, but no regression line, since a slope needs at least two distinct points to mean anything.
Verification covers one hand-built dataset plus one built for the empty-bucket case. It does not cover every edge case, such as identical durations across trades or multiple symbols mixed together, so passing confirms the formulas are implemented correctly, not that the dashboard handles every possible input.
The log-scaled axis keeps the chart readable across a wide spread of hold times, but visual distance no longer maps to a fixed number of minutes: two dots close together near the right edge can differ by hours, while two close together near the left edge might differ by a minute.
Conclusion
This article built a trade duration versus profitability dashboard from two structs, a closed-trade extractor, a regression calculator that also buckets trades by duration, a CCanvas scatter plot with a log-scaled duration axis and a traced regression curve, and a per-symbol Experts tab table. A verification script confirmed the regression's slope, intercept, and R² match hand-worked values, and that the best-performing historical bucket is correctly identified, including the case where a bucket is empty, from a synthetic dataset where profit clearly declines as hold time increases.
What this dashboard adds over aggregate win-rate statistics is a direct, visual answer to whether a trader's own hold times correlate with profitability, and how strong that correlation actually is via R², rather than a slope taken on faith, readable even when an account's hold times span minutes on one trade and days on another. What it does not cover is any relationship more complex than a straight line, execution costs beyond swap and commission, or a data-driven choice of bucket boundaries. A trader who needs any of these will need to extend the classes described in Section 10.
Programs used in the article:
| # | Name | Type | Description |
|---|---|---|---|
| 1 | ScatterTypes.mqh | Include File | Defines the CTradePoint and CRegressionResult structs |
| 2 | ClosedTradeExtractor.mqh | Include File | CClosedTradeExtractor class: reads closed deals and computes duration and profit per trade |
| 3 | RegressionCalculator.mqh | Include File | CRegressionCalculator class: fits a least-squares line and identifies the best-performing historical duration bucket |
| 4 | ScatterPlotChart.mqh | Include File | CScatterPlotChart class: renders the log-scaled scatter plot, regression curve, and summary footer via CCanvas |
| 5 | TradeTablePrinter.mqh | Include File | CTradeTablePrinter class: prints the per-symbol summary table to the Experts tab |
| 6 | ScatterPlotDashboard.mq5 | Script | Main script: wires all components, extracts trades, fits the regression, and renders |
| 7 | TestScatterAnalytics.mq5 | Script | Verification script covering the regression fit, the best-performing historical bucket, and the empty-bucket edge case |
| 8 | ScatterDashboard.zip | Zip Archive | Zip archive containing all the attached files and their paths relative to the terminal's root folder. |
Warning: All rights to these materials are reserved by MetaQuotes Ltd. Copying or reprinting of these materials in whole or in part is prohibited.
This article was written by a user of the site and reflects their personal views. MetaQuotes Ltd is not responsible for the accuracy of the information presented, nor for any consequences resulting from the use of the solutions, strategies or recommendations described.

 Building Volatility Models in MQL5: Implementing the APARCH Volatility Process
 Neural Networks in Trading: Robust Trading Signals in Any Market Regime (ST-Expert)
 Features of Experts Advisors
 Building a Market Behavior Analyzer in MQL5

- Free trading apps
- Over 8,000 signals for copying
- Economic news for exploring financial markets
You agree to website policy and terms of use