

Profit Factor Stability Chart Across Rolling Windows in MQL5
 108
108
 0
0

Introduction
Most trading platforms summarize an entire history of closed trades with one Profit Factor. It is a convenient number, but it compresses years of decisions into a single static figure, and a single figure cannot describe how a strategy actually behaved over time.
Consider two strategies that both report a lifetime Profit Factor of 1.60. The first strategy oscillated gently between 1.50 and 1.75 throughout its life. The second opened with a Profit Factor above 3.00 during its first months, then declined steadily below breakeven for the remainder of its history. Both strategies report identical lifetime statistics, yet they describe completely different risk profiles.
A single lifetime number cannot answer the questions traders actually care about:
- Has the edge deteriorated?
- Is profitability improving?
- Are losing periods becoming more frequent?
- Did one profitable cluster dominate the entire history?
This article builds a reusable MQL5 framework to compute Profit Factor across rolling trade windows and render it as a CCanvas dashboard. It also explains the statistical rationale, the incremental O(N) algorithm, and the modular, testable architecture.
Understanding Profit Factor
Gross Profit is the sum of the net profits from every profitable closed trade in a sample:
GrossProfit = Σ profit(i) for every trade i where profit(i) > 0
Gross Loss is the absolute value of the sum of net losses from every losing closed trade in the same sample:
GrossLoss = |Σ profit(i)| for every trade i where profit(i) < 0
The denominator uses absolute magnitude rather than the signed sum because Profit Factor compares two positive quantities: how much was earned against how much was given back. Profit Factor itself is the ratio of the two totals:
ProfitFactor = GrossProfit / GrossLoss
The result is commonly read against informal thresholds. A value above 2.0 typically indicates a strong historical edge. A value between 1.5 and 2.0 indicates a solid, workable edge. A value between 1.0 and 1.5 indicates modest profitability that may not comfortably absorb transaction costs or drawdown. A value of exactly 1.0 represents breakeven, and anything below 1.0 means the sample lost money overall. These thresholds are guidelines rather than universal rules; a high-frequency strategy with many small trades may need a different acceptable Profit Factor than a swing strategy with few, large trades.
Rolling computation exposes numerical situations that lifetime calculations often hide. A lifetime figure is computed once; a rolling series recomputes the ratio for every window. If a window contains only profitable trades, Gross Loss equals zero and the ratio becomes undefined. This implementation resolves that with a large finite sentinel, ROLLING_PF_INFINITE, set well above any realistic Profit Factor. A sentinel keeps every downstream calculation, including averages and chart scaling, working with ordinary floating-point arithmetic, while remaining unambiguous when displayed.
If a window contains only losing trades, Gross Profit is zero and the ratio correctly evaluates to zero, requiring no special handling. If the available history contains fewer trades than the requested window size, no complete window can be built at all, and the calculator reports failure rather than attempting a partial or misleading result. Finally, a losing trade can be extremely close to zero without being exactly zero. The implementation therefore treats any Gross Loss below an epsilon as zero and applies the same sentinel logic to avoid inflated ratios from floating-point artifacts. This epsilon defaults to a small constant, but it is configurable through SetZeroEpsilon(), since accounts quoted in different currencies or instruments with different point values may reasonably need a different threshold.
Rolling Windows and Local Performance
A lifetime Profit Factor discards temporal information. The order, clustering, and evolution of results all disappear once every trade is folded into two running totals, which is exactly why two very different trading histories can report the same lifetime number. Rolling statistics restore that missing dimension by estimating local behavior instead of global behavior: the calculation repeats on a fixed-size subset that moves forward through the data, rather than summarizing everything at once.
A trade window is a fixed-size sequence of exactly N consecutive closed trades. A rolling window slides that trade window forward one trade at a time, removing the oldest trade and adding one new trade at each step. Rolling Profit Factor is therefore not a single cumulative value; it is the sequence of Profit Factor values computed independently for every rolling window.
Trades

1 2 3 4 5 6 7 8 9 10

Window Size = 5

1 2 3 4 5
  2 3 4 5 6
    3 4 5 6 7
      4 5 6 7 8
        5 6 7 8 9
          6 7 8 9 10
Because neighboring windows share most of their trades, the series moves smoothly, which is what makes it chartable. That same overlap also means adjacent points are not statistically independent, a point worth remembering when interpreting the chart.
Trade Windows versus Calendar Windows
An important design decision here is the use of trade-count windows rather than calendar windows such as weekly or monthly intervals. A calendar month may contain a handful of trades for one strategy and hundreds for another, and even one strategy can generate very different trade counts from month to month depending on volatility. When sample size varies from one observation to the next, the statistical reliability of each Profit Factor estimate varies with it.
Trade-count windows hold the sample size constant. Every rolling window in this implementation contains exactly N completed trades, which equalizes sample size but not necessarily statistical reliability, since trade size, holding time, and market conditions still vary between windows. The trade-off is that the elapsed calendar time each window represents will vary; during active periods a window of N trades may span days, while during quiet periods the same N trades may span weeks. That variability is expected, since the goal is to evaluate a fixed number of trading decisions rather than a fixed span of time.
Reading the Series
Once the rolling series exists, its shape carries meaning. A relatively flat line sitting consistently above 1.5 suggests stable behavior, an edge that has held its character throughout the evaluated history. A gradually rising line may indicate an improving strategy, while a steadily falling one suggests deterioration worth investigating rather than an automatic reason to stop trading. Frequent oscillation around breakeven often points to regime dependence, a strategy whose effectiveness shifts with changing market conditions rather than staying constant.
Two terms recur throughout this discussion. Stability describes the consistency of a strategy's edge over time, not its profitability; a stable strategy can consistently lose money, and an unstable one can still report a high lifetime Profit Factor. Edge refers to the statistical advantage demonstrated by historical results. Profit Factor estimates that edge; it does not guarantee it will persist.
Pipeline and Algorithm
The complete flow of data through the system runs from closed deal history, through trade extraction and profit calculation, into rolling window construction, rolling Profit Factor computation, time series generation and finally chart scaling and canvas rendering.
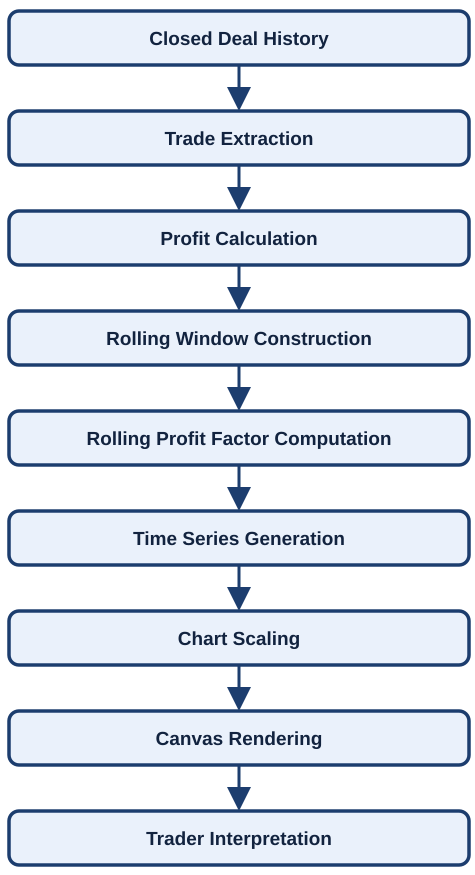
Analytical Pipeline showing how data moves through the framework.
A naive approach recomputes every window from scratch: O(N × W) work for N trades and window size W. Since consecutive windows differ by only two trades, one leaving and one entering, the calculation can instead track running totals incrementally, subtracting the outgoing trade and adding the incoming one at each step. That reduces the whole pass to O(N). The calculator also clamps its running totals to zero if floating-point drift ever pushes them slightly negative, so a rounding artifact can never corrupt a result.
Software Architecture
The project is organized as small, single-purpose components rather than one large class, which keeps the codebase easier to test and extend.
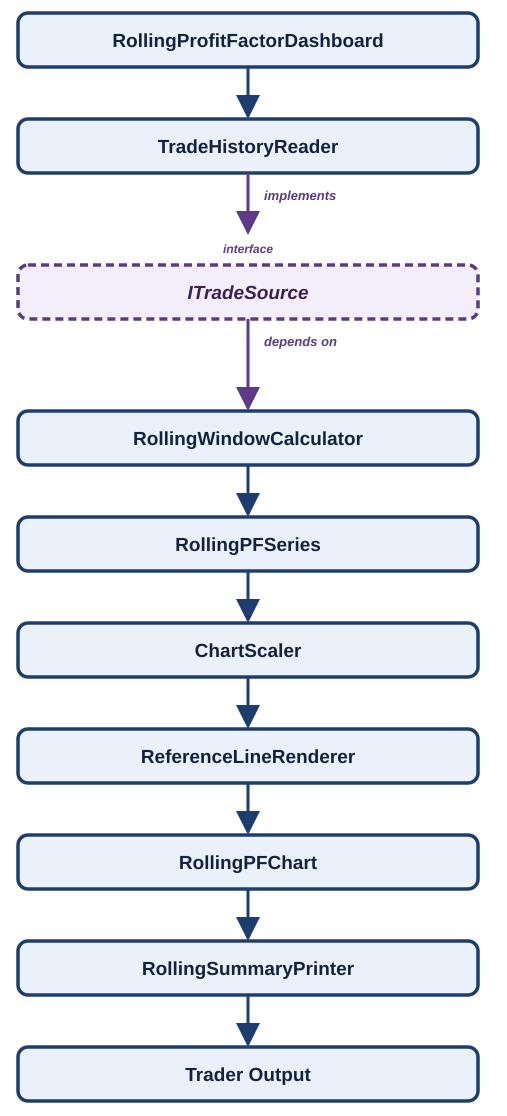
Software Architecture showing how responsibility is divided across components.
ITradeSource.mqh defines the interface both the reader and the test suite's synthetic trade source implement, so RollingWindowCalculator never has to know where trades actually come from. From there, the responsibilities split cleanly: TradeHistoryReader.mqh reads and filters deals, RollingWindowCalculator.mqh runs the incremental algorithm, ChartScaler.mqh maps values to pixels, ReferenceLineRenderer.mqh draws threshold lines, RollingPFChart.mqh owns the canvas and drives rendering, and RollingSummaryPrinter.mqh prints the numeric summary. The dashboard script wires all of this together, while a separate test script checks the math on its own, with no chart involved.
Shared Data Structures: RollingPFTypes.mqh
STradeRecord keeps only closing time and net profit, since that is all the rolling calculation needs. SRollingPFRecord keeps more than the chart alone requires — Gross Profit, Gross Loss, and win/loss counts alongside the ratio — so later extensions such as tooltips or CSV export need no recomputation. A second sentinel, ROLLING_PF_UNDEFINED, marks a window that realized no result either way, distinct from the all-winning sentinel above it.
//+------------------------------------------------------------------+
//|                                             RollingPFTypes.mqh   |
//|                                         Shared data structures   |
//+------------------------------------------------------------------+
#ifndef ROLLING_PF_TYPES_MQH
#define ROLLING_PF_TYPES_MQH

//--- sentinel value used when Gross Loss is effectively zero
#define ROLLING_PF_INFINITE 999.0

//--- sentinel value used when a window has no realized result at all (Gross
//--- Profit and Gross Loss both effectively zero); mathematically undefined,
//--- not a genuine breakeven, so it must be distinguished from PF = 1.0
#define ROLLING_PF_UNDEFINED (-1.0)

//+------------------------------------------------------------------+
//| Lightweight representation of one completed trade                |
//+------------------------------------------------------------------+
struct STradeRecord
  {
   datetime          close_time;   // time the position was closed
   double            net_profit;   // realized profit including commission and swap
  };

//+------------------------------------------------------------------+
//| One computed observation in the rolling Profit Factor series     |
//+------------------------------------------------------------------+
struct SRollingPFRecord
  {
   int               end_index;      // index of the last trade in this window
   datetime          end_time;       // close time of the last trade in this window
   double            gross_profit;   // sum of winning trades in this window
   double            gross_loss;     // absolute sum of losing trades in this window
   double            profit_factor;  // gross_profit / gross_loss, with edge-case handling
   int               win_count;      // number of winning trades in this window
   int               loss_count;     // number of losing trades in this window
  };

#endif // ROLLING_PF_TYPES_MQH
//+------------------------------------------------------------------+
Defining a Trade Source: ITradeSource.mqh
CRollingWindowCalculator depends on data it can enumerate, not on where that data comes from. ITradeSource.mqh defines this as a minimal interface. It requires only two things: report how many trades exist, and return one by index.
CTradeHistoryReader implements this interface against real account history. A synthetic trade source in the test script implements it against a hand-built sequence. Both satisfy the same contract. Both can be handed to the same Compute() method.
This is what lets the rolling algorithm be tested against exact, known cases. It no longer has to rely only on whatever trades a real account happens to contain.
//+------------------------------------------------------------------+
//|                                              ITradeSource.mqh    |
//|           Abstract source of trade records for the calculator    |
//+------------------------------------------------------------------+
#ifndef I_TRADE_SOURCE_MQH
#define I_TRADE_SOURCE_MQH

#include "RollingPFTypes.mqh"

//+------------------------------------------------------------------+
//| Anything that can report a trade count and return trades by      |
//| index. CTradeHistoryReader and CSyntheticTradeSource (in the     |
//| test script) both implement this, so CRollingWindowCalculator    |
//| depends on neither concretely.                                   |
//+------------------------------------------------------------------+
class ITradeSource
  {
public:
   virtual int       TradeCount(void) const = 0;
   virtual bool      GetTrade(const int index, STradeRecord &trade) const = 0;
  };

#endif // I_TRADE_SOURCE_MQH
//+------------------------------------------------------------------+
This file contributes no behavior of its own. It exists purely so the calculator can depend on an abstraction rather than a concrete class, which is what makes the test suite's coverage of Compute() (below) possible in the first place.
Reading Completed Trades: TradeHistoryReader.mqh
TradeHistoryReader.mqh turns raw account history into the trade array the rest of the pipeline consumes. Access begins with HistorySelect(), which loads deals within a date range into an internal cache, followed by HistoryDealsTotal() and HistoryDealGetTicket() to enumerate them. CTradeHistoryReader implements ITradeSource, so the calculator can consume it without knowing its concrete type. Deal properties come from HistoryDealGetDouble() for numeric values such as profit, commission, and swap, and HistoryDealGetInteger() for type, entry, and time.
//+------------------------------------------------------------------+
//|                                          TradeHistoryReader.mqh  |
//|                     Reads completed trades from account history  |
//+------------------------------------------------------------------+
#ifndef TRADE_HISTORY_READER_MQH
#define TRADE_HISTORY_READER_MQH

#include "RollingPFTypes.mqh"
#include "ITradeSource.mqh"

//+------------------------------------------------------------------+
//| Reads closed trading history and exposes it as trade records     |
//+------------------------------------------------------------------+
class CTradeHistoryReader : public ITradeSource
  {
private:
   STradeRecord      m_trades[];

public:
                     CTradeHistoryReader(void);
                    ~CTradeHistoryReader(void);

   bool              ReadHistory(const datetime from_date, const datetime to_date);
   virtual int       TradeCount(void) const;
   virtual bool      GetTrade(const int index, STradeRecord &trade) const;

private:
   bool              IsClosingDeal(const ulong deal_ticket) const;
   void              SortByCloseTime(void);
  };

//+------------------------------------------------------------------+
//| Constructor                                                      |
//+------------------------------------------------------------------+
CTradeHistoryReader::CTradeHistoryReader(void)
  {
   ArrayResize(m_trades, 0);
  }

//+------------------------------------------------------------------+
//| Destructor                                                       |
//+------------------------------------------------------------------+
CTradeHistoryReader::~CTradeHistoryReader(void)
  {
  }
IsClosingDeal() checks whether DEAL_ENTRY is DEAL_ENTRY_OUT, DEAL_ENTRY_OUT_BY, or DEAL_ENTRY_INOUT. The first two are ordinary closing deals; the third is included because a position reversal also realizes a result on the same deal that flips the position's direction, and excluding it would silently drop trades that genuinely closed out a position's prior exposure.
//+------------------------------------------------------------------+
//| IsClosingDeal                                                    |
//+------------------------------------------------------------------+
bool CTradeHistoryReader::IsClosingDeal(const ulong deal_ticket) const
  {
   long entry = HistoryDealGetInteger(deal_ticket, DEAL_ENTRY);
   return(entry == DEAL_ENTRY_OUT || entry == DEAL_ENTRY_OUT_BY || entry == DEAL_ENTRY_INOUT);
  }
SortByCloseTime() guarantees chronological order explicitly, rather than relying on the order deals happen to be returned in by the history cache. The rolling calculation depends critically on order, since sliding the window forward one trade at a time only means something if "forward" is well defined.
//+------------------------------------------------------------------+
//| SortByCloseTime                                                  |
//+------------------------------------------------------------------+
void CTradeHistoryReader::SortByCloseTime(void)
  {
   int total = ArraySize(m_trades);
   for(int i = 1; i < total; i++)
     {
      STradeRecord key = m_trades[i];
      int j = i - 1;
      while(j >= 0 && m_trades[j].close_time > key.close_time)
        {
         m_trades[j + 1] = m_trades[j];
         j--;
        }
      m_trades[j + 1] = key;
     }
  }
ReadHistory() selects the date range through HistorySelect(), walks every deal, keeps only BUY/SELL closing deals, and adds commission and swap into net profit, since both are genuinely part of what a trade cost or earned.
//+------------------------------------------------------------------+
//| ReadHistory                                                      |
//+------------------------------------------------------------------+
bool CTradeHistoryReader::ReadHistory(const datetime from_date, const datetime to_date)
  {
   ArrayResize(m_trades, 0);

   if(!HistorySelect(from_date, to_date))
      return(false);

   int total = HistoryDealsTotal();
   if(total <= 0)
      return(true);

   for(int i = 0; i < total; i++)
     {
      ulong ticket = HistoryDealGetTicket(i);
      if(ticket == 0)
         continue;

      long deal_type = HistoryDealGetInteger(ticket, DEAL_TYPE);
      if(deal_type != DEAL_TYPE_BUY && deal_type != DEAL_TYPE_SELL)
         continue;

      if(!IsClosingDeal(ticket))
         continue;

      //--- net profit includes the trade result plus commission and swap
      //--- recorded on this closing deal; fee or correction entries some
      //--- brokers post as separate, non-trading deals are not captured
      double profit      = HistoryDealGetDouble(ticket, DEAL_PROFIT);
      double commission  = HistoryDealGetDouble(ticket, DEAL_COMMISSION);
      double swap_amount = HistoryDealGetDouble(ticket, DEAL_SWAP);
      double net_profit  = profit + commission + swap_amount;

      datetime close_time = (datetime)HistoryDealGetInteger(ticket, DEAL_TIME);

      int size = ArraySize(m_trades);
      ArrayResize(m_trades, size + 1);
      m_trades[size].close_time = close_time;
      m_trades[size].net_profit = net_profit;
     }

   SortByCloseTime();

   return(true);
  }
TradeCount() and GetTrade() are simple accessors: one reports the array size, the other retrieves a trade by index, returning false rather than reading out of bounds.
//+------------------------------------------------------------------+
//| TradeCount                                                       |
//| Reports the number of completed trades currently held            |
//| by the reader                                                    |
//+------------------------------------------------------------------+
int CTradeHistoryReader::TradeCount(void) const
  {
   return(ArraySize(m_trades));
  }

//+------------------------------------------------------------------+
//| GetTrade                                                         |
//| Retrieves a trade by index                                       |
//| Returns: false if the index is out of range                      |
//+------------------------------------------------------------------+
bool CTradeHistoryReader::GetTrade(const int index, STradeRecord &trade) const
  {
   if(index < 0 || index >= ArraySize(m_trades))
      return(false);

   trade = m_trades[index];
   return(true);
  }
Computing Rolling Profit Factor: RollingWindowCalculator.mqh
RollingWindowCalculator.mqh is the computational core of the project. Every chart, every statistic, and every interpretation downstream depends on its correctness, so it deserves careful attention.
//+------------------------------------------------------------------+
//|                                    RollingWindowCalculator.mqh   |
//|                   Computes rolling Profit Factor incrementally   |
//+------------------------------------------------------------------+
#ifndef ROLLING_WINDOW_CALCULATOR_MQH
#define ROLLING_WINDOW_CALCULATOR_MQH

#include "RollingPFTypes.mqh"
#include "ITradeSource.mqh"

//+------------------------------------------------------------------+
//| Builds the rolling Profit Factor time series from any trade      |
//| source; depends on the ITradeSource interface, not a concrete    |
//| reader, so a synthetic trade sequence can drive the same code    |
//| path as live account history                                     |
//+------------------------------------------------------------------+
class CRollingWindowCalculator
  {
private:
   SRollingPFRecord  m_series[];
   int               m_window_size;
   double            m_zero_epsilon;

public:
                     CRollingWindowCalculator(void);
                    ~CRollingWindowCalculator(void);

   void              SetZeroEpsilon(const double epsilon);
   bool              Compute(const ITradeSource &source, const int window_size);
   int               SeriesCount(void) const;
   bool              GetRecord(const int index, SRollingPFRecord &record) const;

private:
   double            SafeProfitFactor(const double gross_profit, const double gross_loss) const;
  };

//+------------------------------------------------------------------+
//| Constructor                                                      |
//+------------------------------------------------------------------+
CRollingWindowCalculator::CRollingWindowCalculator(void) : m_window_size(0), m_zero_epsilon(0.0000001)
  {
   ArrayResize(m_series, 0);
  }

//+------------------------------------------------------------------+
//| Destructor                                                       |
//+------------------------------------------------------------------+
CRollingWindowCalculator::~CRollingWindowCalculator(void)
  {
  }
SetZeroEpsilon() overrides the default threshold below which Gross Loss is treated as zero. The default of 1e-7 is a reasonable starting point, not a universal constant.
//+------------------------------------------------------------------+
//| SetZeroEpsilon                                                   |
//+------------------------------------------------------------------+
void CRollingWindowCalculator::SetZeroEpsilon(const double epsilon)
  {
   if(epsilon > 0.0)
      m_zero_epsilon = epsilon;
  }
SafeProfitFactor() is the small private helper the rest of the class relies on for every division. It resolves the zero-loss case with the sentinel described earlier, and separately resolves the case where both totals sit at zero by returning ROLLING_PF_UNDEFINED rather than a neutral 1.0, since a window with no realized result either way is mathematically undefined, not a genuine breakeven.
//+------------------------------------------------------------------+
//| SafeProfitFactor                                                 |
//+------------------------------------------------------------------+
double CRollingWindowCalculator::SafeProfitFactor(const double gross_profit, const double gross_loss) const
  {
   if(gross_loss <= m_zero_epsilon)
     {
      if(gross_profit <= m_zero_epsilon)
         return(ROLLING_PF_UNDEFINED);
      return(ROLLING_PF_INFINITE);
     }

   return(gross_profit / gross_loss);
  }
Compute() is the core of the whole project. It seeds the first window by full accumulation, then advances one trade at a time, subtracting the outgoing trade and adding the incoming one before recomputing the ratio. Each slide adds exactly one incoming trade and removes exactly one outgoing trade from the running totals, which is what keeps the incremental update correct and the pass linear.
//+------------------------------------------------------------------+
//| Compute                                                          |
//+------------------------------------------------------------------+
bool CRollingWindowCalculator::Compute(const ITradeSource &source, const int window_size)
  {
   ArrayResize(m_series, 0);
   m_window_size = window_size;

   int total_trades = source.TradeCount();
   if(window_size <= 0 || total_trades < window_size)
      return(false);

   double gross_profit = 0.0;
   double gross_loss   = 0.0;
   int    win_count    = 0;
   int    loss_count   = 0;

   STradeRecord trade;

//--- accumulate the first rolling window
   for(int i = 0; i < window_size; i++)
     {
      source.GetTrade(i, trade);
      if(trade.net_profit > 0.0)
        {
         gross_profit += trade.net_profit;
         win_count++;
        }
      else
         if(trade.net_profit < 0.0)
           {
            gross_loss += MathAbs(trade.net_profit);
            loss_count++;
           }
     }

   int record_count = total_trades - window_size + 1;
   ArrayResize(m_series, record_count);

   source.GetTrade(window_size - 1, trade);
   m_series[0].end_index     = window_size - 1;
   m_series[0].end_time      = trade.close_time;
   m_series[0].gross_profit  = gross_profit;
   m_series[0].gross_loss    = gross_loss;
   m_series[0].profit_factor = SafeProfitFactor(gross_profit, gross_loss);
   m_series[0].win_count     = win_count;
   m_series[0].loss_count    = loss_count;

//--- slide the window forward one trade at a time
   for(int w = 1; w < record_count; w++)
     {
      STradeRecord outgoing, incoming;
      source.GetTrade(w - 1, outgoing);
      source.GetTrade(w + window_size - 1, incoming);

      if(outgoing.net_profit > 0.0)
        {
         gross_profit -= outgoing.net_profit;
         win_count--;
        }
      else
         if(outgoing.net_profit < 0.0)
           {
            gross_loss -= MathAbs(outgoing.net_profit);
            loss_count--;
           }

      if(incoming.net_profit > 0.0)
        {
         gross_profit += incoming.net_profit;
         win_count++;
        }
      else
         if(incoming.net_profit < 0.0)
           {
            gross_loss += MathAbs(incoming.net_profit);
            loss_count++;
           }

      //--- guard against floating-point drift accumulating over long histories.
      //--- Logged rather than clamped silently: a large or repeated negative
      //--- total is more likely a data or algorithm error than ordinary
      //--- rounding noise, and should not disappear unnoticed.
      if(gross_profit < 0.0)
        {
         Print("Rolling Profit Factor Calculator: negative Gross Profit detected and clamped, check trade data.");
         gross_profit = 0.0;
        }
      if(gross_loss < 0.0)
        {
         Print("Rolling Profit Factor Calculator: negative Gross Loss detected and clamped, check trade data.");
         gross_loss = 0.0;
        }

      m_series[w].end_index     = w + window_size - 1;
      m_series[w].end_time      = incoming.close_time;
      m_series[w].gross_profit  = gross_profit;
      m_series[w].gross_loss    = gross_loss;
      m_series[w].profit_factor = SafeProfitFactor(gross_profit, gross_loss);
      m_series[w].win_count     = win_count;
      m_series[w].loss_count    = loss_count;
     }

   return(true);
  }
SeriesCount() and GetRecord() expose the finished series the same safe way trades were exposed earlier.
//+------------------------------------------------------------------+
//| SeriesCount                                                      |
//+------------------------------------------------------------------+
int CRollingWindowCalculator::SeriesCount(void) const
  {
   return(ArraySize(m_series));
  }

//+------------------------------------------------------------------+
//| GetRecord                                                        |
//+------------------------------------------------------------------+
bool CRollingWindowCalculator::GetRecord(const int index, SRollingPFRecord &record) const
  {
   if(index < 0 || index >= ArraySize(m_series))
      return(false);

   record = m_series[index];
   return(true);
  }
Mapping Values to Pixels: ChartScaler.mqh
A Profit Factor of 1.6 has no inherent meaning as a screen position until it is mapped against a chosen value range and a chosen pixel range. ChartScaler.mqh performs exactly that transformation, independent of both the calculation logic and the drawing logic.
//+------------------------------------------------------------------+
//|                                                 ChartScaler.mqh  |
//|                    Converts data values into screen coordinates  |
//+------------------------------------------------------------------+
#ifndef CHART_SCALER_MQH
#define CHART_SCALER_MQH

//+------------------------------------------------------------------+
//| Maps analytical values and window indices onto pixel coordinates |
//+------------------------------------------------------------------+
class CChartScaler
  {
private:
   double            m_min_value;
   double            m_max_value;
   int               m_plot_left;
   int               m_plot_top;
   int               m_plot_width;
   int               m_plot_height;

public:
                     CChartScaler(void);
                    ~CChartScaler(void);

   void              Configure(const double min_value, const double max_value,
                               const int plot_left, const int plot_top,
                               const int plot_width, const int plot_height);

   int               ValueToY(const double value) const;
   int               IndexToX(const int index, const int total_points) const;
   double            MinValue(void) const { return(m_min_value); }
   double            MaxValue(void) const { return(m_max_value); }
  };

//+------------------------------------------------------------------+
//| Constructor                                                      |
//+------------------------------------------------------------------+
CChartScaler::CChartScaler(void) : m_min_value(0.0), m_max_value(1.0),
   m_plot_left(0), m_plot_top(0),
   m_plot_width(1), m_plot_height(1)
  {
  }

//+------------------------------------------------------------------+
//| Destructor                                                       |
//+------------------------------------------------------------------+
CChartScaler::~CChartScaler(void)
  {
  }
Configure() sets the data range and drawing rectangle. If every value happens to be identical, the range would collapse to a point and break the later division, so the method widens it symmetrically instead.
//+------------------------------------------------------------------+
//| Configure                                                        |
//+------------------------------------------------------------------+
void CChartScaler::Configure(const double min_value, const double max_value,
                             const int plot_left, const int plot_top,
                             const int plot_width, const int plot_height)
  {
   m_min_value = min_value;
   m_max_value = max_value;

//--- guard against a degenerate range where every value is identical
   if(MathAbs(m_max_value - m_min_value) < 0.0000001)
     {
      m_min_value -= 0.5;
      m_max_value += 0.5;
     }

   m_plot_left   = plot_left;
   m_plot_top    = plot_top;
   m_plot_width  = MathMax(plot_width, 1);
   m_plot_height = MathMax(plot_height, 1);
  }
ValueToY() and IndexToX() convert values and indices into coordinates. ValueToY() clamps its input to the configured range, which is also what lets an extreme outlier be drawn as a line reaching the top of the plot rather than distorting the whole chart. IndexToX() anchors a single-point series to the left edge.
//+------------------------------------------------------------------+
//| ValueToY                                                         |
//+------------------------------------------------------------------+
int CChartScaler::ValueToY(const double value) const
  {
   double clamped = value;
   if(clamped < m_min_value)
      clamped = m_min_value;
   if(clamped > m_max_value)
      clamped = m_max_value;

   double ratio = (clamped - m_min_value) / (m_max_value - m_min_value);
   int y = m_plot_top + (int)MathRound(m_plot_height - ratio * m_plot_height);
   return(y);
  }

//+------------------------------------------------------------------+
//| IndexToX                                                         |
//+------------------------------------------------------------------+
int CChartScaler::IndexToX(const int index, const int total_points) const
  {
   if(total_points <= 1)
      return(m_plot_left);

   double ratio = (double)index / (double)(total_points - 1);
   int x = m_plot_left + (int)MathRound(ratio * m_plot_width);
   return(x);
  }
Drawing the Reference Lines: ReferenceLineRenderer.mqh
ReferenceLineRenderer.mqh exists because the dashboard draws the same visual pattern three times: a dashed horizontal line at a fixed Profit Factor value, with a label to its right. Rather than repeating that logic inline for breakeven, moderate, and strong thresholds, it lives in one method.
//+------------------------------------------------------------------+
//|                                     ReferenceLineRenderer.mqh    |
//|                    Draws horizontal analytical threshold lines   |
//+------------------------------------------------------------------+
#ifndef REFERENCE_LINE_RENDERER_MQH
#define REFERENCE_LINE_RENDERER_MQH

#include <Canvas\Canvas.mqh>
#include "ChartScaler.mqh"

//+------------------------------------------------------------------+
//| Draws a single dashed horizontal reference level with a label    |
//+------------------------------------------------------------------+
class CReferenceLineRenderer
  {
public:
                     CReferenceLineRenderer(void);
                    ~CReferenceLineRenderer(void);

   void              DrawLine(CCanvas &canvas, const CChartScaler &scaler,
                              const double value, const int plot_left, const int plot_right,
                              const uint line_color, const string label);
  };

//+------------------------------------------------------------------+
//| Constructor                                                      |
//+------------------------------------------------------------------+
CReferenceLineRenderer::CReferenceLineRenderer(void)
  {
  }

//+------------------------------------------------------------------+
//| Destructor                                                       |
//+------------------------------------------------------------------+
CReferenceLineRenderer::~CReferenceLineRenderer(void)
  {
  }
DrawLine() converts a value into a y-coordinate, then draws short dashed segments across the plot with a label at the end. It also handles a detail that matters for every drawing call in this project: the canvas uses an ARGB pixel format, and a plain color value has alpha zero, which renders fully transparent. DrawLine() converts its incoming color to an opaque ARGB value once before drawing anything.
//+-------------------------------------------------------------------+
//| DrawLine                                                          |
//+-------------------------------------------------------------------+
void CReferenceLineRenderer::DrawLine(CCanvas &canvas, const CChartScaler &scaler,
                                      const double value, const int plot_left, const int plot_right,
                                      const uint line_color, const string label)
  {
   int y = scaler.ValueToY(value);

//--- canvases created with COLOR_FORMAT_ARGB_NORMALIZE require an explicit
//--- alpha channel; a raw 'color' value has alpha = 0 and would be fully
//--- transparent, so every draw call below uses the opaque ARGB form
   uint opaque_color = ::ColorToARGB((color)line_color, 255);

//--- draw a dashed line so reference levels remain distinguishable from the data series
   int dash_length = 6;
   int gap_length  = 4;
   int x = plot_left;
   while(x < plot_right)
     {
      int segment_end = MathMin(x + dash_length, plot_right);
      canvas.Line(x, y, segment_end, y, opaque_color);
      x = segment_end + gap_length;
     }

   canvas.TextOut(plot_right + 6, y - 6, label, opaque_color);
  }
Rendering the Dashboard: RollingPFChart.mqh
CCanvas, part of the MQL5 Standard Library, provides complete pixel-level control over graphical presentation, which makes it well suited to a custom analytical chart that does not map cleanly onto the built-in indicator drawing styles.
RollingPFChart.mqh owns one CCanvas instance and drives every step of the rendering pass. Because that canvas is created with COLOR_FORMAT_ARGB_NORMALIZE, the same alpha requirement described above applies to every color this class touches, and every drawing call below wraps its color in ColorToARGB(..., 255) for that reason. The chart's title, its 'weak' threshold, its display ceiling, and its three reference levels are all configurable through Configure(), defaulting to Profit Factor's own values so nothing changes for a caller that never invokes it. RollingPFChart coordinates several rendering concerns as one class: scale selection, weak-region shading, and drawing order. It is not split apart further, since each step depends on the one before it. What Configure() removes is the class's dependence on Profit Factor's own semantics. It does not remove its role as the single rendering coordinator.
//+------------------------------------------------------------------+
//|                                             RollingPFChart.mqh   |
//|              Owns CCanvas and renders the analytical dashboard   |
//+------------------------------------------------------------------+
#ifndef ROLLING_PF_CHART_MQH
#define ROLLING_PF_CHART_MQH

#include <Canvas\Canvas.mqh>
#include "RollingPFTypes.mqh"
#include "RollingWindowCalculator.mqh"
#include "ChartScaler.mqh"
#include "ReferenceLineRenderer.mqh"

#define CLR_BACKGROUND     C'250,250,248'
#define CLR_AXIS           C'60,60,60'
#define CLR_GRID           C'225,225,222'
#define CLR_PF_LINE        C'30,90,160'
#define CLR_REF_BREAKEVEN  C'170,60,60'
#define CLR_REF_MODERATE   C'150,120,40'
#define CLR_REF_STRONG     C'40,130,80'
#define CLR_TEXT           C'40,40,40'
#define CLR_SHADED_WEAK    C'250,225,225'

//--- default display ceiling for Profit Factor. ROLLING_PF_INFINITE (999.0,
//--- defined in RollingPFTypes.mqh) is the sentinel used for statistical
//--- purposes; auto-scaling the chart's vertical axis to that value would
//--- crush the readable range into an unreadable sliver, so the chart scales
//--- to this far smaller ceiling instead and relies on CChartScaler's
//--- existing clamping to flatten anything above it to the top of the plot.
#define ROLLING_PF_CHART_DISPLAY_CAP 5.0

//+------------------------------------------------------------------+
//| One horizontal analytical reference level: a value, its color,   |
//| and the label drawn beside it. RollingPFChart always draws       |
//| exactly three of these; which metric they describe is            |
//| configurable, so the chart is not permanently tied to Profit     |
//| Factor's own thresholds.                                         |
//+------------------------------------------------------------------+
struct SRollingChartReferenceLevel
  {
   double            value;
   uint              line_color;
   string            label;
  };

//+------------------------------------------------------------------+
//| Renders a rolling analytical dashboard onto a CCanvas            |
//+------------------------------------------------------------------+
class CRollingPFChart
  {
private:
   CCanvas           m_canvas;
   int               m_width;
   int               m_height;
   int               m_margin_left;
   int               m_margin_right;
   int               m_margin_top;
   int               m_margin_bottom;
   string            m_object_name;

//--- configurable, metric-specific presentation; defaults match Profit
//--- Factor so a caller that never calls Configure() behaves exactly as
//--- before
   string                      m_title;
   double                      m_weak_below;
   double                      m_display_cap;
   SRollingChartReferenceLevel m_levels[3];

public:
                     CRollingPFChart(void);
                    ~CRollingPFChart(void);

   bool              Create(const string object_name, const int width, const int height);
   void              Configure(const string title, const double weak_below, const double display_cap,
                               const SRollingChartReferenceLevel &level1,
                               const SRollingChartReferenceLevel &level2,
                               const SRollingChartReferenceLevel &level3);
   void              Render(const CRollingWindowCalculator &calculator, const int window_size);
   void              Destroy(void);

private:
   void              DrawBackground(void);
   void              DrawAxes(const int plot_left, const int plot_top, const int plot_right, const int plot_bottom);
   void              DrawGrid(const CChartScaler &scaler, const double min_pf, const double max_pf,
                              const int plot_left, const int plot_top, const int plot_right, const int plot_bottom);
   void              DrawTitle(const int window_size, const bool any_values_capped);
   void              DrawWeakRegions(const CRollingWindowCalculator &calculator, const CChartScaler &scaler,
                                     const int plot_top, const int plot_bottom);
   void              DrawSeries(const CRollingWindowCalculator &calculator, const CChartScaler &scaler);
  };

//+------------------------------------------------------------------+
//| Constructor                                                      |
//+------------------------------------------------------------------+
CRollingPFChart::CRollingPFChart(void) : m_width(0), m_height(0),
   m_margin_left(60), m_margin_right(90),
   m_margin_top(50), m_margin_bottom(40),
   m_title("Rolling Profit Factor Stability Chart"),
   m_weak_below(1.0),
   m_display_cap(ROLLING_PF_CHART_DISPLAY_CAP)
  {
   m_levels[0].value = 1.0;
   m_levels[0].line_color = CLR_REF_BREAKEVEN;
   m_levels[0].label = "PF = 1.0";
   m_levels[1].value = 1.5;
   m_levels[1].line_color = CLR_REF_MODERATE;
   m_levels[1].label = "PF = 1.5";
   m_levels[2].value = 2.0;
   m_levels[2].line_color = CLR_REF_STRONG;
   m_levels[2].label = "PF = 2.0";
  }

//+------------------------------------------------------------------+
//| Destructor                                                       |
//+------------------------------------------------------------------+
CRollingPFChart::~CRollingPFChart(void)
  {
  }
Create() builds the canvas bitmap; Destroy() releases it explicitly. CCanvas does not free its own resource automatically, which is why a wrapper built this way can be constructed as a local variable inside a script and still leave its image on the chart after the script ends — teardown only happens when Destroy() is called on purpose.
//+------------------------------------------------------------------+
//| Create                                                           |
//| Create the underlying canvas bitmap object                       |
//+------------------------------------------------------------------+
bool CRollingPFChart::Create(const string object_name, const int width, const int height)
  {
   m_object_name = object_name;
   m_width  = width;
   m_height = height;

   return(m_canvas.CreateBitmapLabel(object_name, 20, 20, width, height, COLOR_FORMAT_ARGB_NORMALIZE));
  }

//+------------------------------------------------------------------+
//| Destroy                                                          |
//+------------------------------------------------------------------+
void CRollingPFChart::Destroy(void)
  {
   m_canvas.Destroy();
  }
Configure() overrides the title, the weak threshold, the display ceiling, and the three reference levels, so the chart can render a different rolling metric — expectancy or win rate, say — using its own thresholds instead of Profit Factor's.
//+------------------------------------------------------------------+
//| Configure                                                        |
//+------------------------------------------------------------------+
void CRollingPFChart::Configure(const string title, const double weak_below, const double display_cap,
                                const SRollingChartReferenceLevel &level1,
                                const SRollingChartReferenceLevel &level2,
                                const SRollingChartReferenceLevel &level3)
  {
   m_title       = title;
   m_weak_below  = weak_below;
   m_display_cap = display_cap;
   m_levels[0]   = level1;
   m_levels[1]   = level2;
   m_levels[2]   = level3;
  }
DrawBackground() fills the canvas; DrawTitle() prints the chart name, the window size, and a note whenever a value was clamped for display, so a flattened peak is never mistaken for missing data. Both wrap every color in ColorToARGB(..., 255) for the same reason as above.
//+------------------------------------------------------------------+
//| DrawBackground                                                   |
//+------------------------------------------------------------------+
void CRollingPFChart::DrawBackground(void)
  {
   m_canvas.Erase(::ColorToARGB(CLR_BACKGROUND, 255));
  }

//+------------------------------------------------------------------+
//| DrawTitle                                                        |
//+------------------------------------------------------------------+
void CRollingPFChart::DrawTitle(const int window_size, const bool any_values_capped)
  {
   m_canvas.FontSet("Arial", 16, FW_BOLD);
   m_canvas.TextOut(m_margin_left, 12, m_title, ::ColorToARGB(CLR_TEXT, 255));

   m_canvas.FontSet("Arial", 10, FW_NORMAL);
   string subtitle = StringFormat("Trade Window Size: %d", window_size);
   if(any_values_capped)
      subtitle += StringFormat("   (values above %.1f are capped for display)", m_display_cap);
   m_canvas.TextOut(m_margin_left, 32, subtitle, ::ColorToARGB(CLR_TEXT, 255));
  }
DrawAxes() draws the two frame lines; DrawGrid() divides the vertical range into five even steps with a light line and label at each one.
//+------------------------------------------------------------------+
//| DrawAxes                                                         |
//+------------------------------------------------------------------+
void CRollingPFChart::DrawAxes(const int plot_left, const int plot_top, const int plot_right, const int plot_bottom)
  {
   m_canvas.Line(plot_left, plot_top, plot_left, plot_bottom, ::ColorToARGB(CLR_AXIS, 255));
   m_canvas.Line(plot_left, plot_bottom, plot_right, plot_bottom, ::ColorToARGB(CLR_AXIS, 255));
  }

//+------------------------------------------------------------------+
//| DrawGrid                                                         |
//+------------------------------------------------------------------+
void CRollingPFChart::DrawGrid(const CChartScaler &scaler, const double min_pf, const double max_pf,
                               const int plot_left, const int plot_top, const int plot_right, const int plot_bottom)
  {
   m_canvas.FontSet("Arial", 8, FW_NORMAL);

   int divisions = 5;
   for(int i = 0; i <= divisions; i++)
     {
      double value = min_pf + (max_pf - min_pf) * i / divisions;
      int y = scaler.ValueToY(value);

      m_canvas.Line(plot_left, y, plot_right, y, ::ColorToARGB(CLR_GRID, 255));

      string label = DoubleToString(value, 2);
      m_canvas.TextOut(plot_left - 40, y - 6, label, ::ColorToARGB(CLR_TEXT, 255));
     }
  }
DrawWeakRegions() shades any contiguous stretch below breakeven, tracking where a weak run starts and filling the rectangle the moment it ends, so the shading sits behind the grid and the line. A finite value below the configured threshold counts as weak; the undefined sentinel is excluded explicitly, and a zero-width rectangle is padded to two pixels so a single weak window is never invisible.
//+------------------------------------------------------------------+
//| DrawWeakRegions                                                  |
//+------------------------------------------------------------------+
void CRollingPFChart::DrawWeakRegions(const CRollingWindowCalculator &calculator, const CChartScaler &scaler,
                                      const int plot_top, const int plot_bottom)
  {
   int total = calculator.SeriesCount();
   if(total <= 0)
      return;

   SRollingPFRecord record;
   int region_start = -1;

   for(int i = 0; i < total; i++)
     {
      calculator.GetRecord(i, record);
      //--- only a finite value below the configured threshold counts as weak;
      //--- the undefined sentinel is excluded explicitly so a window with no
      //--- realized result is never shaded as though it had lost money
      bool weak = (record.profit_factor >= 0.0 && record.profit_factor < m_weak_below);

      if(weak && region_start < 0)
         region_start = i;

      bool at_end = (i == total - 1);

      if((!weak || at_end) && region_start >= 0)
        {
         int region_end = weak ? i : i - 1;
         int x1 = scaler.IndexToX(region_start, total);
         int x2 = scaler.IndexToX(region_end, total);

         //--- guard against a zero-width, invisible rectangle when only a
         //--- single window in the stretch is weak
         if(x2 - x1 < 2)
            x2 = x1 + 2;

         m_canvas.FillRectangle(x1, plot_top, x2, plot_bottom, ::ColorToARGB(CLR_SHADED_WEAK, 255));
         region_start = -1;
        }
     }
  }
DrawSeries() connects each observation to the next. An undefined window is treated as a gap rather than a real point, since drawing it at its raw -1.0 value would look like a severe loss that never happened. An isolated point — whether the whole series has one observation, or one simply follows a gap — is drawn as a small filled circle so it stays visible with nothing to connect it to.
//+------------------------------------------------------------------+
//| DrawSeries                                                       |
//+------------------------------------------------------------------+
void CRollingPFChart::DrawSeries(const CRollingWindowCalculator &calculator, const CChartScaler &scaler)
  {
   int total = calculator.SeriesCount();
   if(total <= 0)
      return;

   bool have_previous = false;
   int  prev_x = 0, prev_y = 0;

   for(int i = 0; i < total; i++)
     {
      SRollingPFRecord current;
      calculator.GetRecord(i, current);

      if(current.profit_factor <= ROLLING_PF_UNDEFINED)
        {
         have_previous = false;
         continue;
        }

      int x = scaler.IndexToX(i, total);
      int y = scaler.ValueToY(current.profit_factor);

      if(have_previous)
         m_canvas.Line(prev_x, prev_y, x, y, ::ColorToARGB(CLR_PF_LINE, 255));
      else
         m_canvas.FillCircle(x, y, 3, ::ColorToARGB(CLR_PF_LINE, 255));

      prev_x = x;
      prev_y = y;
      have_previous = true;
     }
  }
Render() executes the steps in order (background first, annotations last). It also selects the vertical scale before drawing. ROLLING_PF_INFINITE, the sentinel used for statistics, is far larger than any Profit Factor a chart should scale to — a single all-winning window would otherwise stretch the axis to 999 and crush the reference lines into an unreadable sliver. Render() instead scans the series against a separate, much smaller display ceiling, ROLLING_PF_CHART_DISPLAY_CAP, and lets ChartScaler's existing clamping in ValueToY() flatten anything above that ceiling to the top of the plot. Undefined windows are skipped entirely while scanning for the visible range, since letting -1.0 into that scan would drag the axis down and compress every genuine observation into a thin band. The three reference lines are now drawn from the configurable m_levels array rather than three hardcoded calls.
//+------------------------------------------------------------------+
//| Render                                                           |
//| Render the complete analytical dashboard                         |
//| Parameters: calculator  - populated rolling Profit Factor series |
//|             window_size - active trade window size for the title |
//+------------------------------------------------------------------+
void CRollingPFChart::Render(const CRollingWindowCalculator &calculator, const int window_size)
  {
   DrawBackground();

   int plot_left   = m_margin_left;
   int plot_top    = m_margin_top;
   int plot_right  = m_width  - m_margin_right;
   int plot_bottom = m_height - m_margin_bottom;

   int total = calculator.SeriesCount();

   double min_pf            = 0.0;
   double max_pf            = 2.5;
   bool   any_values_capped = false;
   bool   have_observed     = false;
   double observed_min      = 0.0, observed_max = 0.0;

   for(int i = 0; i < total; i++)
     {
      SRollingPFRecord record;
      calculator.GetRecord(i, record);

      //--- undefined windows carry no real value and must not influence the
      //--- visible scale; without this check, -1.0 would drag the axis down
      //--- and compress every genuine observation into a thin band
      if(record.profit_factor <= ROLLING_PF_UNDEFINED)
         continue;

      if(record.profit_factor > m_display_cap)
         any_values_capped = true;
      double pf = MathMin(record.profit_factor, m_display_cap);

      if(!have_observed)
        {
         observed_min  = pf;
         observed_max  = pf;
         have_observed = true;
        }
      else
        {
         if(pf < observed_min)
            observed_min = pf;
         if(pf > observed_max)
            observed_max = pf;
        }
     }

   if(have_observed)
     {
      //--- always include the analytical reference levels in the visible range
      min_pf = MathMin(0.0, observed_min - 0.1);
      max_pf = MathMax(2.5, observed_max + 0.1);
     }

   DrawTitle(window_size, any_values_capped);

   CChartScaler scaler;
   scaler.Configure(min_pf, max_pf, plot_left, plot_top, plot_right - plot_left, plot_bottom - plot_top);

   DrawWeakRegions(calculator, scaler, plot_top, plot_bottom);
   DrawGrid(scaler, min_pf, max_pf, plot_left, plot_top, plot_right, plot_bottom);
   DrawAxes(plot_left, plot_top, plot_right, plot_bottom);

   CReferenceLineRenderer ref_renderer;
   ref_renderer.DrawLine(m_canvas, scaler, m_levels[0].value, plot_left, plot_right, m_levels[0].line_color, m_levels[0].label);
   ref_renderer.DrawLine(m_canvas, scaler, m_levels[1].value, plot_left, plot_right, m_levels[1].line_color, m_levels[1].label);
   ref_renderer.DrawLine(m_canvas, scaler, m_levels[2].value, plot_left, plot_right, m_levels[2].line_color, m_levels[2].label);

   DrawSeries(calculator, scaler);

   m_canvas.Update();
  }
Summarizing the Series: RollingSummaryPrinter.mqh
A chart communicates trends; a numeric summary quantifies them. RollingSummaryPrinter.mqh complements the visual dashboard with concise statistics written to the Experts tab.
//+------------------------------------------------------------------+
//|                                     RollingSummaryPrinter.mqh    |
//|              Prints numeric summary statistics for the series    |
//+------------------------------------------------------------------+
#ifndef ROLLING_SUMMARY_PRINTER_MQH
#define ROLLING_SUMMARY_PRINTER_MQH

#include "RollingWindowCalculator.mqh"

//+------------------------------------------------------------------+
//| Computes and prints summary statistics for the rolling series    |
//+------------------------------------------------------------------+
class CRollingSummaryPrinter
  {
public:
                     CRollingSummaryPrinter(void);
                    ~CRollingSummaryPrinter(void);

   void              PrintSummary(const CRollingWindowCalculator &calculator);

private:
   double            Median(double &values[]) const;
   double            StandardDeviation(double &values[], const double mean) const;
  };

//+------------------------------------------------------------------+
//| Constructor                                                      |
//+------------------------------------------------------------------+
CRollingSummaryPrinter::CRollingSummaryPrinter(void)
  {
  }

//+------------------------------------------------------------------+
//| Destructor                                                       |
//+------------------------------------------------------------------+
CRollingSummaryPrinter::~CRollingSummaryPrinter(void)
  {
  }
Median() works from a sorted copy so the caller's original array order stays intact; StandardDeviation() follows the standard population formula against a mean already computed by the caller.
//+------------------------------------------------------------------+
//| Median                                                           |
//+------------------------------------------------------------------+
double CRollingSummaryPrinter::Median(double &values[]) const
  {
   int total = ArraySize(values);
   if(total == 0)
      return(0.0);

   double sorted[];
   ArrayResize(sorted, total);
   ArrayCopy(sorted, values);
   ArraySort(sorted);

   if(total % 2 == 1)
      return(sorted[total / 2]);

   return((sorted[total / 2 - 1] + sorted[total / 2]) / 2.0);
  }

//+------------------------------------------------------------------+
//| StandardDeviation                                                |
//+------------------------------------------------------------------+
double CRollingSummaryPrinter::StandardDeviation(double &values[], const double mean) const
  {
   int total = ArraySize(values);
   if(total <= 1)
      return(0.0);

   double sum_sq = 0.0;
   for(int i = 0; i < total; i++)
     {
      double diff = values[i] - mean;
      sum_sq += diff * diff;
     }

   return(MathSqrt(sum_sq / total));
  }
PrintSummary() computes the minimum, maximum, sum, and longest consecutive runs below and above their thresholds in a single pass, then prints the report. Sentinel (all-winning) and undefined (no realized result) windows are excluded from the minimum, maximum, average, median, and standard deviation, since mixing either into ordinary arithmetic distorts the summary; both are reported separately as excluded counts instead. The name matters: a method called Print would hide the built-in logging function inside its own body, since MQL5 resolves an unqualified call to the closest name in scope, and every log line inside would recurse into itself instead of reaching the Experts tab.
//+------------------------------------------------------------------+
//| PrintSummary                                                     |
//+------------------------------------------------------------------+
void CRollingSummaryPrinter::PrintSummary(const CRollingWindowCalculator &calculator)
  {
   int total = calculator.SeriesCount();
   if(total <= 0)
     {
      Print("Rolling Profit Factor summary unavailable: no rolling windows were computed.");
      return;
     }

   double finite_values[];
   ArrayResize(finite_values, total);
   int finite_count    = 0;
   int sentinel_count  = 0;
   int undefined_count = 0;

   int below_one_count   = 0;
   int longest_below_one = 0, current_below_one = 0;
   int longest_above_two = 0, current_above_two = 0;

   SRollingPFRecord record;

   for(int i = 0; i < total; i++)
     {
      calculator.GetRecord(i, record);
      double pf = record.profit_factor;

      //--- an undefined window has no realized result either way; it does not
      //--- belong in the statistics, and it does not extend a below-1 or
      //--- above-2 streak either, since it is neither
      if(pf <= ROLLING_PF_UNDEFINED)
        {
         undefined_count++;
         current_below_one = 0;
         current_above_two = 0;
         continue;
        }

      if(pf >= ROLLING_PF_INFINITE)
         sentinel_count++;
      else
        {
         finite_values[finite_count] = pf;
         finite_count++;
        }

      if(pf < 1.0)
        {
         below_one_count++;
         current_below_one++;
         if(current_below_one > longest_below_one)
            longest_below_one = current_below_one;
        }
      else
         current_below_one = 0;

      if(pf > 2.0)
        {
         current_above_two++;
         if(current_above_two > longest_above_two)
            longest_above_two = current_above_two;
        }
      else
         current_above_two = 0;
     }

   ArrayResize(finite_values, finite_count);

   double min_pf = 0.0, max_pf = 0.0, average_pf = 0.0, median_pf = 0.0, std_dev = 0.0;
   if(finite_count > 0)
     {
      double sum_pf = 0.0;
      min_pf = finite_values[0];
      max_pf = finite_values[0];

      for(int i = 0; i < finite_count; i++)
        {
         if(finite_values[i] < min_pf)
            min_pf = finite_values[i];
         if(finite_values[i] > max_pf)
            max_pf = finite_values[i];
         sum_pf += finite_values[i];
        }

      average_pf = sum_pf / finite_count;
      median_pf  = Median(finite_values);
      std_dev    = StandardDeviation(finite_values, average_pf);
     }

   double pct_below_one = 100.0 * below_one_count / total;

   Print("----------------------------------------------------------");
   Print("Rolling Profit Factor Summary");
   Print("Total rolling windows evaluated  : ", total);
   Print("Windows excluded (sentinel PF)   : ", sentinel_count);
   Print("Windows excluded (undefined PF)  : ", undefined_count);
   Print("Minimum rolling Profit Factor    : ", (finite_count > 0 ? DoubleToString(min_pf, 3) : "n/a"));
   Print("Maximum rolling Profit Factor    : ", (finite_count > 0 ? DoubleToString(max_pf, 3) : "n/a"));
   Print("Average rolling Profit Factor    : ", (finite_count > 0 ? DoubleToString(average_pf, 3) : "n/a"));
   Print("Median rolling Profit Factor     : ", (finite_count > 0 ? DoubleToString(median_pf, 3) : "n/a"));
   Print("Standard deviation               : ", (finite_count > 0 ? DoubleToString(std_dev, 3) : "n/a"));
   Print("Windows below breakeven (PF < 1) : ", DoubleToString(pct_below_one, 1), "%");
   Print("Longest consecutive run below 1  : ", longest_below_one, " windows");
   Print("Longest consecutive run above 2  : ", longest_above_two, " windows");
   Print("----------------------------------------------------------");
  }
Main Dashboard
The main script orchestrates the pipeline in sequence: determine the analysis period, read trade history, validate data sufficiency, build rolling windows, compute rolling Profit Factor, generate summary statistics, render the dashboard, and display results. An InpZeroEpsilon input lets the near-zero-loss threshold be tuned per account rather than relying on a single hardcoded constant. Each stage delegates to exactly one of the components built above, so the main script itself contains no analytical logic of its own; it is purely coordination.
//+------------------------------------------------------------------+
//|                                 RollingProfitFactorDashboard.mq5 |
//|         Main entry point for the rolling Profit Factor dashboard |
//+------------------------------------------------------------------+

#property script_show_inputs

#include <RollingProfitFactor/RollingPFTypes.mqh>
#include <RollingProfitFactor/ITradeSource.mqh>
#include <RollingProfitFactor/TradeHistoryReader.mqh>
#include <RollingProfitFactor/RollingWindowCalculator.mqh>
#include <RollingProfitFactor/RollingPFChart.mqh>
#include <RollingProfitFactor/RollingSummaryPrinter.mqh>

//+------------------------------------------------------------------+
//|                                                                  |
//+------------------------------------------------------------------+
input int      InpWindowSize   = 30;         // Trade window size (number of trades per window)
input int      InpHistoryDays  = 365;        // Number of calendar days of history to analyze
input int      InpChartWidth   = 900;        // Chart width in pixels
input int      InpChartHeight  = 500;        // Chart height in pixels
input double   InpZeroEpsilon  = 0.0000001;  // Minimum loss magnitude treated as zero

//+------------------------------------------------------------------+
//| Script entry point                                               |
//+------------------------------------------------------------------+
void OnStart()
  {
   datetime to_date   = TimeCurrent();
   datetime from_date = to_date - InpHistoryDays * 24 * 60 * 60;

   CTradeHistoryReader reader;
   if(!reader.ReadHistory(from_date, to_date))
     {
      Print("Rolling Profit Factor Dashboard: failed to read trade history.");
      return;
     }

   int trade_count = reader.TradeCount();
   Print("Rolling Profit Factor Dashboard: ", trade_count, " completed trades loaded.");

   if(trade_count < InpWindowSize)
     {
      Print("Rolling Profit Factor Dashboard: insufficient trade history for the requested window size. ",
            "Required: ", InpWindowSize, ", Available: ", trade_count);
      return;
     }

   CRollingWindowCalculator calculator;
   calculator.SetZeroEpsilon(InpZeroEpsilon);
   if(!calculator.Compute(reader, InpWindowSize))
     {
      Print("Rolling Profit Factor Dashboard: rolling calculation failed.");
      return;
     }

   CRollingSummaryPrinter printer;
   printer.PrintSummary(calculator);

//--- CRollingPFChart is declared as a local object here, not allocated
//--- with 'new'. Its destructor is intentionally empty, so the rendered
//--- panel remains visible on the chart after OnStart returns and this
//--- local object goes out of scope. No heap allocation is required to
//--- keep the chart persistent, and none is left undeleted.
//--- chart.Configure(...) is available if this dashboard is ever adapted
//--- to a different rolling metric; the defaults here match Profit Factor.
   CRollingPFChart chart;
   if(!chart.Create("RollingPFChart", InpChartWidth, InpChartHeight))
     {
      Print("Rolling Profit Factor Dashboard: failed to create canvas.");
      return;
     }

   chart.Render(calculator, InpWindowSize);
   ChartRedraw(0);

   Print("Rolling Profit Factor Dashboard: chart rendered successfully.");
  }
//+------------------------------------------------------------------+
Testing and Validation: TestRollingProfitFactor.mq5
Analytical code should never rely on visual inspection alone. TestRollingProfitFactor.mq5 verifies the rolling calculation independently of any chart, using small assertion helpers rather than the platform's own testing framework.
//+------------------------------------------------------------------+
//|                                     TestRollingProfitFactor.mq5  |
//|        Independent verification script for rolling calculations  |
//+------------------------------------------------------------------+
#property script_show_inputs

#include <RollingProfitFactor/RollingPFTypes.mqh>
#include <RollingProfitFactor/ITradeSource.mqh>
#include <RollingProfitFactor/TradeHistoryReader.mqh>
#include <RollingProfitFactor/RollingWindowCalculator.mqh>

int g_assert_count = 0;
int g_fail_count   = 0;
ExpectTrue() and ExpectNear() are the two assertion primitives every test in the suite calls. The first checks a plain boolean condition, and the second checks that two floating-point values agree within a tolerance, which matters because exact equality is rarely meaningful once division is involved.
//+------------------------------------------------------------------+
//| ExpectTrue                                                       |
//| Assert a boolean condition and report the result                 |
//+------------------------------------------------------------------+
void ExpectTrue(const bool condition, const string test_name)
  {
   g_assert_count++;
   if(!condition)
     {
      g_fail_count++;
      Print("FAILED: ", test_name);
     }
   else
      Print("PASSED: ", test_name);
  }

//+------------------------------------------------------------------+
//| ExpectNear                                                       |
//| Assert that two doubles are equal within a tolerance             |
//+------------------------------------------------------------------+
void ExpectNear(const double actual, const double expected, const double tolerance, const string test_name)
  {
   g_assert_count++;
   if(MathAbs(actual - expected) > tolerance)
     {
      g_fail_count++;
      Print("FAILED: ", test_name, " expected=", DoubleToString(expected, 5),
            " actual=", DoubleToString(actual, 5));
     }
   else
      Print("PASSED: ", test_name);
  }
CSyntheticTradeSource and NaiveProfitFactor() support the first and most important test. The synthetic source implements ITradeSource directly, the same interface CRollingWindowCalculator consumes from CTradeHistoryReader, so it lets a test build an exact, known trade sequence and still exercise the real Compute() path, rather than a hand-written duplicate of the formula.
//+------------------------------------------------------------------+
//| CSyntheticTradeSource                                            |
//| Minimal synthetic trade source used to drive controlled tests.   |
//| Implements ITradeSource directly, the same interface             |
//| CRollingWindowCalculator consumes from CTradeHistoryReader, so   |
//| every test below exercises the real Compute() path rather than   |
//| a duplicate hand-written formula.                                |
//+------------------------------------------------------------------+
class CSyntheticTradeSource : public ITradeSource
  {
private:
   STradeRecord      m_trades[];

public:
   void              Add(const double net_profit)
     {
      int size = ArraySize(m_trades);
      ArrayResize(m_trades, size + 1);
      m_trades[size].net_profit = net_profit;
      m_trades[size].close_time = (datetime)(1000000 + size * 3600);
     }

   virtual int       TradeCount(void) const { return(ArraySize(m_trades)); }

   virtual bool      GetTrade(const int index, STradeRecord &trade) const
     {
      if(index < 0 || index >= ArraySize(m_trades))
         return(false);
      trade = m_trades[index];
      return(true);
     }
  };

//+------------------------------------------------------------------+
//| NaiveProfitFactor                                                |
//| Naive reference computation used to validate the optimized path  |
//| independently of CRollingWindowCalculator itself                 |
//+------------------------------------------------------------------+
double NaiveProfitFactor(CSyntheticTradeSource &source, const int start_index, const int window_size)
  {
   double gross_profit = 0.0, gross_loss = 0.0;
   STradeRecord trade;

   for(int i = start_index; i < start_index + window_size; i++)
     {
      source.GetTrade(i, trade);
      if(trade.net_profit > 0.0)
         gross_profit += trade.net_profit;
      else
         if(trade.net_profit < 0.0)
            gross_loss += MathAbs(trade.net_profit);
     }

   if(gross_loss <= 0.0000001)
     {
      if(gross_profit <= 0.0000001)
         return(ROLLING_PF_UNDEFINED);
      return(ROLLING_PF_INFINITE);
     }

   return(gross_profit / gross_loss);
  }
TestBasicRollingCalculation() checks every window position across a fixed seven-trade sequence against the naive reference.
//+------------------------------------------------------------------+
//| TestBasicRollingCalculation                                      |
//| Validate the rolling calculation against the naive reference by  |
//| calling the real CRollingWindowCalculator, not by re-deriving    |
//| Profit Factor a second time by hand                              |
//+------------------------------------------------------------------+
void TestBasicRollingCalculation(void)
  {
   CSyntheticTradeSource source;
   source.Add(100.0);
   source.Add(-40.0);
   source.Add(60.0);
   source.Add(-20.0);
   source.Add(30.0);
   source.Add(-50.0);
   source.Add(80.0);

   int window_size = 4;
   int total       = source.TradeCount();

   CRollingWindowCalculator calculator;
   ExpectTrue(calculator.Compute(source, window_size), "Compute succeeds with sufficient history");
   ExpectTrue(calculator.SeriesCount() == total - window_size + 1,
              "Series length matches the expected number of rolling windows");

   for(int start = 0; start <= total - window_size; start++)
     {
      double expected = NaiveProfitFactor(source, start, window_size);

      SRollingPFRecord record;
      calculator.GetRecord(start, record);

      ExpectNear(record.profit_factor, expected, 0.0001,
                 StringFormat("Compute() window at %d matches naive reference", start));
      ExpectTrue(record.end_index == start + window_size - 1,
                 StringFormat("Window at %d reports the correct end_index", start));
     }
  }
TestSlidingWindowCounts() checks that win and loss counts track correctly across a slide, something nothing in the original suite verified — every earlier test checked the resulting ratio, never the counts feeding it.
//+------------------------------------------------------------------+
//| TestSlidingWindowCounts                                          |
//| Validate that win/loss counts track correctly across a slide,    |
//| not only the resulting Profit Factor ratio                       |
//+------------------------------------------------------------------+
void TestSlidingWindowCounts(void)
  {
   CSyntheticTradeSource source;
   source.Add(10.0);
   source.Add(-5.0);
   source.Add(10.0);
   source.Add(10.0);
   source.Add(-5.0);

   CRollingWindowCalculator calculator;
   ExpectTrue(calculator.Compute(source, 3), "Compute succeeds for the sliding window count test");

   SRollingPFRecord first, second, third;
   calculator.GetRecord(0, first);
   calculator.GetRecord(1, second);
   calculator.GetRecord(2, third);

   ExpectTrue(first.win_count == 2 && first.loss_count == 1, "First window win/loss counts are correct");
   ExpectTrue(second.win_count == 2 && second.loss_count == 1, "Second window win/loss counts are correct after a slide");
   ExpectTrue(third.win_count == 2 && third.loss_count == 1, "Third window win/loss counts are correct after a second slide");
  }
TestAllWinningWindow(), TestAllLosingWindow(), and TestFlatWindow() isolate the three edge cases from earlier by building a synthetic source and calling Compute(), confirming the sentinel, the zero result, and the undefined result respectively.
//+------------------------------------------------------------------+
//| TestAllWinningWindow                                             |
//| Validate the all-winning window edge case through Compute()      |
//+------------------------------------------------------------------+
void TestAllWinningWindow(void)
  {
   CSyntheticTradeSource source;
   source.Add(100.0);
   source.Add(50.0);
   source.Add(25.0);

   CRollingWindowCalculator calculator;
   ExpectTrue(calculator.Compute(source, 3), "Compute succeeds for the all-winning window test");

   SRollingPFRecord record;
   calculator.GetRecord(0, record);

   ExpectNear(record.profit_factor, ROLLING_PF_INFINITE, 0.0001,
              "All-winning window returns the sentinel infinite value");
  }

//+------------------------------------------------------------------+
//| TestAllLosingWindow                                              |
//| Validate the all-losing window edge case through Compute()       |
//+------------------------------------------------------------------+
void TestAllLosingWindow(void)
  {
   CSyntheticTradeSource source;
   source.Add(-30.0);
   source.Add(-45.0);

   CRollingWindowCalculator calculator;
   ExpectTrue(calculator.Compute(source, 2), "Compute succeeds for the all-losing window test");

   SRollingPFRecord record;
   calculator.GetRecord(0, record);

   ExpectNear(record.profit_factor, 0.0, 0.0001, "All-losing window returns a Profit Factor of zero");
  }

//+------------------------------------------------------------------+
//| TestFlatWindows                                                  |
//| Validate the flat, all-zero-profit window edge case through      |
//| Compute(). This now returns ROLLING_PF_UNDEFINED rather than a   |
//| neutral 1.0, since a window with no realized result either way   |
//| is mathematically undefined, not a genuine breakeven.            |
//+------------------------------------------------------------------+
void TestFlatWindow(void)
  {
   CSyntheticTradeSource source;
   source.Add(0.0);
   source.Add(0.0);

   CRollingWindowCalculator calculator;
   ExpectTrue(calculator.Compute(source, 2), "Compute succeeds for the flat window test");

   SRollingPFRecord record;
   calculator.GetRecord(0, record);

   ExpectNear(record.profit_factor, ROLLING_PF_UNDEFINED, 0.0001,
              "Window with only zero-profit trades returns the undefined sentinel, not a neutral breakeven");
  }
TestInsufficientHistory() checks a plainer case: what happens when there simply are not enough trades. Here, reader is never given any history to load, so it holds zero trades. Asking Compute() for a window of 30 against that empty reader should fail cleanly, rather than attempt some partial or misleading calculation. The test confirms exactly that.
//+------------------------------------------------------------------+
//| TestInsufficientHistory                                          |
//| Validate graceful failure when history is shorter than the       |
//| requested window size                                            |
//+------------------------------------------------------------------+
void TestInsufficientHistory(void)
  {
   CTradeHistoryReader reader;
   CRollingWindowCalculator calculator;

   bool result = calculator.Compute(reader, 30);

   ExpectTrue(result == false, "Calculator reports failure when trade count is below the window size");
  }
OnStart() runs every test and reports how many assertions passed.
//+------------------------------------------------------------------+
//| Script entry point                                               |
//+------------------------------------------------------------------+
void OnStart()
  {
   Print("Running Rolling Profit Factor verification suite...");

   TestBasicRollingCalculation();
   TestSlidingWindowCounts();
   TestAllWinningWindow();
   TestAllLosingWindow();
   TestFlatWindow();
   TestInsufficientHistory();

   Print("----------------------------------------------------------");
   Print("Verification complete. ", g_assert_count, " assertions executed, ", g_fail_count, " failed.");
   Print("----------------------------------------------------------");
  }
Interpreting the Dashboard
With the implementation complete, it is worth restating how the resulting visualization should be read responsibly. A consistently rising rolling Profit Factor is encouraging but should be checked against the broader trading context rather than accepted at face value. A gradually declining line is a prompt to investigate, not an automatic signal to stop trading a strategy. Repeated oscillation around one may indicate genuine regime dependence rather than random noise, particularly if it recurs across multiple independent stretches of history. An isolated spike should be examined for its underlying trades rather than treated as representative of ongoing behavior, since the retained per-window data makes this inspection straightforward. Long stable plateaus, sudden structural breaks, and sustained deterioration each carry their own analytical weight, described earlier in the statistical interpretation section. A break in the line itself represents a window with no realized result at all, not a measurement gap, and should be read as 'no data,' not as a dip toward zero.
The dashboard is a tool for exploratory quantitative analysis. It is not a predictive trading system, and it does not constitute an automated decision engine. Readers should combine rolling Profit Factor with complementary measures, including expectancy, drawdown, recovery factor, average trade, and risk-adjusted performance metrics, before making trading decisions based on what the chart shows.
Rolling Profit Factor Stability Chart
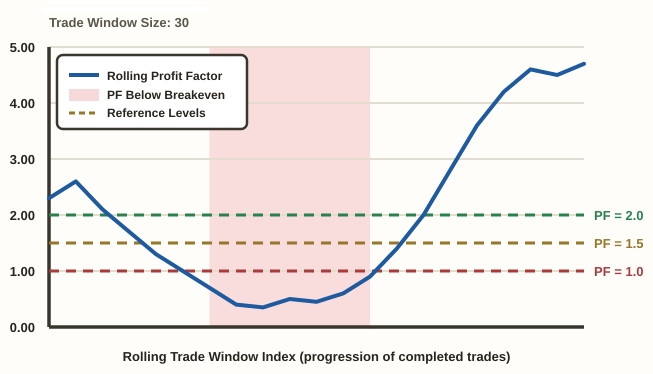
Rolling Profit Factor Dashboard Mock-Up: This is an illustrative sketch of the finished dashboard, not a captured runtime screenshot. It shows the rolling Profit Factor line declining below breakeven, staying weak for a stretch, then recovering toward a strong edge. The three reference lines mark breakeven, a moderate edge, and a strong edge. The shaded band marks the weak stretch, and the legend explains each visual element.
Limitations
Every quantitative analytical tool has limitations, and this one is no exception.
Overlapping windows: Successive rolling windows share most of their trades by construction, which produces the smooth, continuous series that makes the chart readable. However, this also means adjacent observations are not statistically independent, and readers should avoid treating neighboring points on the chart as separate experiments; they are correlated by design.
Profit Factor ignores trade ordering: The ratio considers only cumulative gains and cumulative losses within a window, not the sequence in which trades occurred. Two rolling windows with identical Profit Factor values may have experienced very different equity paths within that window, one steady and one volatile, and the metric alone cannot distinguish between them.
Profit Factor ignores drawdown: The metric measures profitability, not capital risk. Two strategies can report identical Profit Factor values while exhibiting dramatically different maximum drawdowns. Readers should combine rolling Profit Factor with dedicated drawdown analysis rather than relying on it in isolation.
Position sizing: Profit Factor depends on realized trade results, and changes in position sizing over the evaluated history will influence rolling Profit Factor independently of any change in trading logic. Interpretation should therefore consider money management alongside strategy behavior.
Sample size: Very small rolling windows produce highly responsive charts that react quickly to recent results, at the cost of more noise. Very large windows produce smoother, more stable charts that respond more slowly to genuine changes in behavior. There is no single universally optimal window size; the appropriate choice depends on trading frequency and the trader's analytical goals.
Historical bias: Rolling analysis evaluates historical behavior only. It cannot predict future strategy performance, and none of the language in this article or in the implementation should be read as implying forecasting ability.
Trade granularity and scope: Each closing deal is treated as one trade record, so a position closed through several partial closes produces several records rather than one. The reader also does not filter by symbol or magic number, so results reflect the whole account rather than one strategy unless that filtering is added. Commission and swap are read from the closing deal itself. Individual fee, charge, or correction entries some brokers post as separate, non-trading deals are not captured. This can modestly inflate Profit Factor where such entries exist.
Standard deviation on overlapping data: Because windows overlap, the reported standard deviation describes the shape of the series rather than the variance of independent samples, and should not be read as a confidence measure.
Future Extensions
The architecture built in this article is intentionally modular, which makes several natural extensions straightforward to add without disturbing the existing components.
- Multiple rolling window sizes could be plotted simultaneously by running RollingWindowCalculator more than once with different window sizes and rendering each resulting series in RollingPFChart with a distinct color, allowing direct comparison between short-term and long-term behavior.
- Interactive window adjustment could let a trader modify the window size directly from chart controls, re-running RollingWindowCalculator.Compute() and RollingPFChart.Render() in response, without any change to the underlying architecture.
- Symbol filtering could restrict analysis to selected trading symbols by adding a symbol check inside TradeHistoryReader.ReadHistory(), leaving every downstream component unchanged.
- Magic number filtering could support strategy-specific analysis in the same location, reading DEAL_MAGIC alongside the other deal properties already retrieved, enabling portfolio-level analytics broken down by individual Expert Advisors.
- Rolling expectancy could replace or accompany Profit Factor by adding an alternative metric calculation inside RollingWindowCalculator, reusing the existing ChartScaler and RollingPFChart rendering architecture — calling chart.Configure() with expectancy's own title and thresholds rather than Profit Factor's.
- Rolling average trade and rolling win rate could be visualized the same way, each requiring only a new metric calculation while reusing the rest of the pipeline.
- CSV export could serialize every field already retained in SRollingPFRecord for external statistical analysis, requiring no changes to the calculation logic itself.
- Interactive tooltips could display detailed window statistics on mouse hover, reading directly from the retained per-window data already stored in the series.
- Comparative strategy analysis could render multiple rolling Profit Factor series from different strategies simultaneously, distinguished by color, by running the pipeline once per strategy and passing multiple calculators into an extended rendering method.
Conclusion
A single lifetime Profit Factor is a convenient summary. But it discards the temporal structure of a trading history. That missing structure is often exactly what a trader needs to evaluate whether a strategy's edge remains intact. Rolling analysis restores it by recomputing the same statistic across a moving, fixed-size sample of trades. The result is a time series instead of a single point.
This article built that analysis as a reusable MQL5 framework. A trade history reader isolates completed trades. An incremental rolling calculator keeps the computation linear in the number of trades. A coordinate scaler separates numerical transformation from drawing. A CCanvas-based renderer produces a professional analytical dashboard, complete with reference levels and deterioration shading. A summary printer quantifies what the chart shows visually. Each component owns exactly one responsibility. That is what keeps the system easy to extend, whether toward alternative rolling metrics, multiple window sizes, or comparative analysis across strategies.
Used responsibly, alongside complementary measures such as expectancy and drawdown, a rolling Profit Factor dashboard gives a trader a clearer, more honest picture of how a strategy's edge has actually evolved. That is a meaningful improvement over the single flattened number most platforms report by default.
Programs used in the article:
| # | Name | Type | Description |
|---|---|---|---|
| 1 | RollingPFTypes.mqh | Include File | Shared data structures and the zero-loss sentinel constant |
| 2 | ITradeSource.mqh | Include File | Abstract trade source interface the calculator depends on |
| 3 | TradeHistoryReader.mqh | Include File | Reads and filters completed trades from account history |
| 4 | RollingWindowCalculator.mqh | Include File | Computes the rolling Profit Factor time series incrementally |
| 5 | ChartScaler.mqh | Include File | Converts analytical values and window indices into pixel coordinates |
| 6 | ReferenceLineRenderer.mqh | Include File | Draws the dashed analytical threshold reference lines |
| 7 | RollingPFChart.mqh | Include File | Owns the CCanvas instance and renders the complete dashboard |
| 8 | RollingSummaryPrinter.mqh | Include File | Computes and prints numeric summary statistics |
| 9 | RollingProfitFactorDashboard.mq5 | Script | Main script that orchestrates the full pipeline |
| 10 | TestRollingProfitFactor.mq5 | Script | Independent verification suite for the rolling calculation |
| 11 | RollingProfitFactor.zip | Zip Archive | Zip archive containing all the attached files and their paths relative to the terminal's root folder. |
Warning: All rights to these materials are reserved by MetaQuotes Ltd. Copying or reprinting of these materials in whole or in part is prohibited.
This article was written by a user of the site and reflects their personal views. MetaQuotes Ltd is not responsible for the accuracy of the information presented, nor for any consequences resulting from the use of the solutions, strategies or recommendations described.

 Neural Networks in Trading: A Unified View of Space and Time (Conclusion)
 Beyond REST and ZeroMQ: Building a gRPC/Protocol Buffers Bridge for Real-Time MetaTrader 5–Python Inference
 Features of Experts Advisors
 Self-Exciting Markets: Building a Hawkes Process from Scratch

- Free trading apps
- Over 8,000 signals for copying
- Economic news for exploring financial markets
You agree to website policy and terms of use