
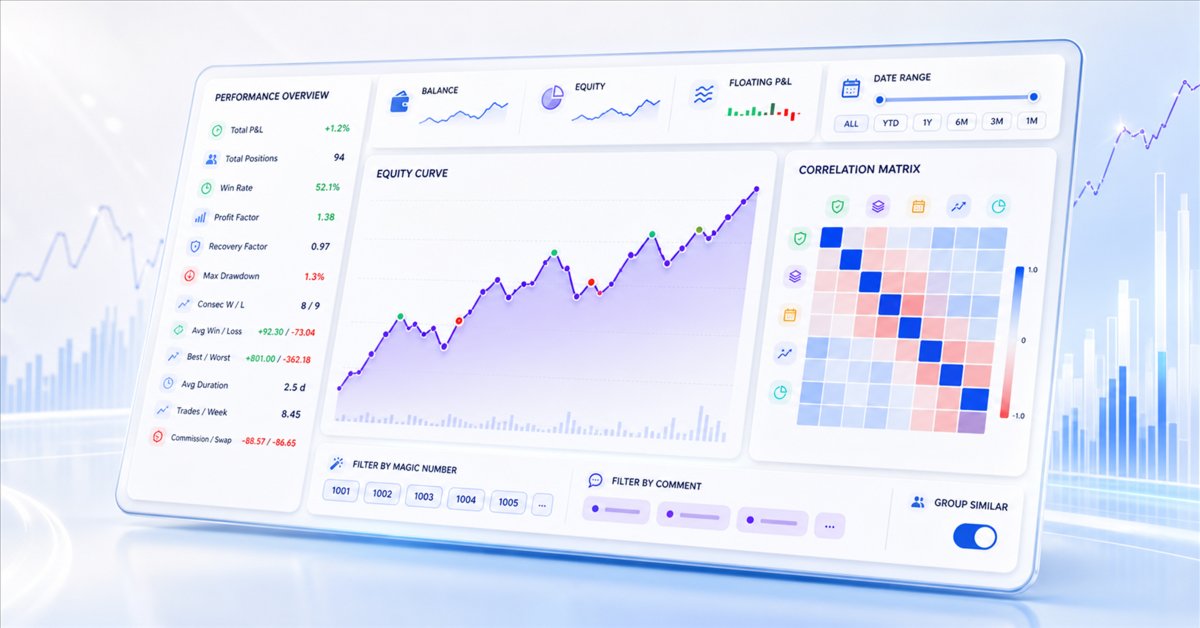
Creating an Interactive Portfolio Analyzer Dashboard with CCanvas in MQL5
 1 830
1 830
 0
0

Introduction
A multi-strategy MetaTrader 5 account can hide strategy-level risk behind aggregate account metrics. Developers often run several independent systems on the same account to distribute exposure and stabilize returns. However, standard account-history reports generated by the terminal present only account-wide portfolio metrics. When multiple strategies run concurrently, these reports do not provide strategy attribution, dynamic date filtering, or cross-strategy correlation analysis.
This article presents the Portfolio Analyzer dashboard. It is a standalone Expert Advisor that reads account deal history, reconstructs closed positions, attributes them by magic number or normalized comment, and displays portfolio metrics without modifying any trading Expert Advisor running on the account.
The reader will obtain a complete Portfolio_Analyzer.mq5 source file that compiles into a self-contained chart overlay. The implementation focuses on Object-Oriented Programming (OOP), custom rendering with the MetaTrader 5 CCanvas library, an equity curve, strategy filters, and a Pearson correlation matrix for comparing daily strategy returns.
Designing the internal architecture
The core software architecture is designed around the CPortfolioAnalyzer class. To ensure maximum reusability and prevent namespace pollution, this class is completely self-contained. It does not access global input variables directly. In Object-Oriented Programming, classes should run independently of external variables. Accessing global inputs directly binds the class to a specific implementation, preventing it from being reused in other systems.
Instead of reading global input variables directly, the CPortfolioAnalyzer class exposes public setter methods (such as SetBgColor(), SetAccentColor(), and SetTickCheckSec()). The Expert Advisor reads the user inputs and passes these values to the class instance during initialization. This separation keeps the dashboard settings explicit while preserving a clean internal class boundary.
The input block contains display, color-theme, and strategy attribution parameters inside one native input group. Display parameters manage chart visibility, font selection, and update intervals. Color-theme parameters define background, panel, border, text, accent, win, and loss color values. Strategy attribution parameters determine normalized-comment behavior. Every variable contains an end-of-line comment detailing its function:
Core operational assumptions and constraints
The system operates under three foundational constraints to maintain high performance on active charts:
- Closed Positions Scope: The dashboard reconstructs closed positions from account deal history, while current balance, equity, and floating profit or loss are read directly from the account state. This implementation uses closed positions as the strategy attribution source.
- Normalized Comment Tokenization: When grouping similar strategies, the algorithm assumes comments are formatted with distinct first-token identifiers, treating characters like hyphens and underscores as token separators.
- Trade-Server History Window Offset: The query range uses a 24-hour forward offset relative to the trade-server time returned by TimeCurrent(). This offset ensures timestamp synchronization discrepancies do not prevent recent account deals from being loaded.
input group "=== GRAPHIC SYSTEM & THEME ==="
input bool     InpHideChart            = true;          // Full Screen Dashboard Mode
input string   InpFontName             = "Segoe UI";    // Interface Font Family
input color    InpBgColor              = C'240,244,248';// Background Color
input color    InpPanelColor           = C'255,255,255';// Panel/Card Color
input color    InpBorderColor          = C'203,213,225';// Border Color
input color    InpAccentColor          = C'67,56,202';  // Accent/Equity Curve Color
input color    InpProfitColor          = C'4,120,87';   // Profit/Win Color
input color    InpLossColor            = C'185,28,28';  // Loss/Deficit Color
input color    InpTextColor            = C'15,23,42';   // Primary Text Color
input color    InpLabelColor           = C'71,85,105';  // Label Text Color
input int      InpTickCheckSeconds     = 2;             // Tick Check Interval (Seconds)
input bool     InpGroupSimilarComments = true;          // Group Similar Comments
The class encapsulates three main responsibilities: reading account deal history, calculating portfolio metrics, and rendering the dashboard. By keeping these tasks inside one class, the standalone Expert Advisor retains a compact global layer while the analytical logic remains concentrated in CPortfolioAnalyzer. The data structures that underpin this design are introduced in the next section.
Developing the analytical and visual engine
MQL5 trade and UI data structures
To manage trade tracking and user interface components, two key structures are defined inside the source file: SPositionTrade and SUiButton.
The first structure, SPositionTrade, represents a closed position reconstructed from account deal history. Standard MetaTrader 5 deal history consists of individual entry and exit deals rather than unified positions. The Portfolio Analyzer dashboard reconstructs the position lifecycle by pairing entry and exit deals, calculating net profit, and storing strategy attribution fields. To keep the structure compact, fields such as position symbol, trade volume, and trade type are excluded because they are not used in the portfolio metrics.
Every member in the structures contains a descriptive end-of-line comment to document its purpose. The SPositionTrade definition is as follows:
struct SPositionTrade
  {
   long              positionId;  // Unique position identifier
   datetime          entryTime;   // Trade entry timestamp
   datetime          exitTime;    // Trade exit timestamp
   double            profit;      // Raw profit amount
   double            commission;  // Commission charges
   double            swap;        // Swap charges
   double            netProfit;   // Net profit after costs
   long              magic;       // Expert Advisor magic number
   string            comment;     // Trade comment string
   bool              isClosed;    // Whether the position is closed
  };
The second structure, SUiButton, represents an interactive user interface element. The dashboard relies on custom vector graphics, which means the standard MetaTrader 5 button objects are not used. Instead, the dashboard renders buttons as vector shapes on a single canvas. For user interactions (hover and click), it registers buttons in a dynamic hit-test array. When the mouse moves or clicks on the chart, the dashboard performs a coordinate check against this array to identify the target button. The SUiButton fields are defined as follows:
struct SUiButton
  {
   int               x1;          // Left boundary in pixels
   int               y1;          // Top boundary in pixels
   int               x2;          // Right boundary in pixels
   int               y2;          // Bottom boundary in pixels
   string            label;       // Display text
   int               id;          // Unique button identifier
   bool              isActive;    // Current toggle state
  };
With the closed-position and button structures defined, the next section describes how the engine queries, pairs, and normalizes account deal history to populate these fields.
Trade loading, sorting, and comment normalization
The core computational engine of the Portfolio Analyzer dashboard relies on trade reconstruction, sorting, and comment normalization.
This process begins with the LoadTrades() method, which queries account deal history using the HistorySelect() function. The selection window uses a 24-hour offset beyond the trade-server time returned by TimeCurrent(): HistorySelect(0, TimeCurrent() + 86400). This offset ensures that the dashboard captures recent deals even when terminal-side and server-side timestamps are not perfectly aligned.
During deal scanning, buy and sell deals are grouped by their position identifier (DEAL_POSITION_ID). The net profit is calculated by summing the profit, commission, and swap.
To group these deals, the logic checks if a record with the same position identifier already exists in the trade list. If it is a new identifier (meaning this is the first deal associated with that position), the dashboard initializes a new trade record, setting the entry and exit times to the deal's timestamp and storing the initial profit, commission, swap, magic number, and comment. If the identifier is already in the list, the existing record is updated by accumulating the financial values, extending the exit time, and updating the magic number and comment if the current deal is identified as the position entry (DEAL_ENTRY_IN).
The dashboard verifies whether a position remains open or has been closed by using the ticket selection function: !PositionSelectByTicket((ulong)m_allTrades[i].positionId). Checking closed status by ticket selection is a reliable approach because it operates account-wide. Querying symbol totals would fail if the account had open positions on the same symbol under different magic numbers or strategies.
//+------------------------------------------------------------------+
//| Loads and reconstructs position trades from deal history         |
//+------------------------------------------------------------------+
void CPortfolioAnalyzer::LoadTrades(void)
  {
   ::ArrayFree(m_allTrades);
   m_totalTrades = 0;

   if(!::HistorySelect(0, ::TimeCurrent() + 86400))
     {
      ::Print("Portfolio Analyzer: Cannot load history.");
      return;
     }

   int total_deals = ::HistoryDealsTotal();
   m_lastDealsCount = total_deals;

   for(int i = 0; i < total_deals; i++)
     {
      ulong ticket = ::HistoryDealGetTicket(i);
      if(ticket <= 0)
         continue;
      long dt = ::HistoryDealGetInteger(ticket, DEAL_TYPE);
      if(dt != DEAL_TYPE_BUY && dt != DEAL_TYPE_SELL)
         continue;

      long     pid = ::HistoryDealGetInteger(ticket, DEAL_POSITION_ID);
      long     ent = ::HistoryDealGetInteger(ticket, DEAL_ENTRY);
      datetime tm  = (datetime)::HistoryDealGetInteger(ticket, DEAL_TIME);
      double   prf = ::HistoryDealGetDouble(ticket, DEAL_PROFIT);
      double   com = ::HistoryDealGetDouble(ticket, DEAL_COMMISSION);
      double   sw  = ::HistoryDealGetDouble(ticket, DEAL_SWAP);
      long     mg  = ::HistoryDealGetInteger(ticket, DEAL_MAGIC);
      string   cmt = ::HistoryDealGetString(ticket, DEAL_COMMENT);

//--- Search for an existing position with matching ID
      int found = -1;
      for(int j = 0; j < m_totalTrades; j++)
         if(m_allTrades[j].positionId == pid)
           {
            found = j;
            break;
           }

      if(found == -1)
        {
         m_totalTrades++;
         ::ArrayResize(m_allTrades, m_totalTrades);
         SPositionTrade t;
         t.positionId = pid;
         t.entryTime  = tm;
         t.exitTime   = tm;
         t.profit     = prf;
         t.commission = com;
         t.swap       = sw;
         t.netProfit  = prf + com + sw;
         t.magic      = mg;
         t.comment    = cmt;
         t.isClosed   = false;
         m_allTrades[m_totalTrades - 1] = t;
        }
      else
        {
         m_allTrades[found].profit     += prf;
         m_allTrades[found].commission += com;
         m_allTrades[found].swap       += sw;
         m_allTrades[found].netProfit  += (prf + com + sw);
         if(tm > m_allTrades[found].exitTime)
            m_allTrades[found].exitTime = tm;
         if(tm < m_allTrades[found].entryTime)
            m_allTrades[found].entryTime = tm;
         if(ent == DEAL_ENTRY_IN)
           {
            m_allTrades[found].magic   = mg;
            m_allTrades[found].comment = cmt;
           }
        }
     }

//--- Mark positions as closed if they no longer exist
   for(int i = 0; i < m_totalTrades; i++)
      m_allTrades[i].isClosed = !::PositionSelectByTicket((ulong)m_allTrades[i].positionId);
  }
To visualize the reconstructed position lifecycle and verify the deal-pairing logic, developers can refer to the structural flowchart shown below.
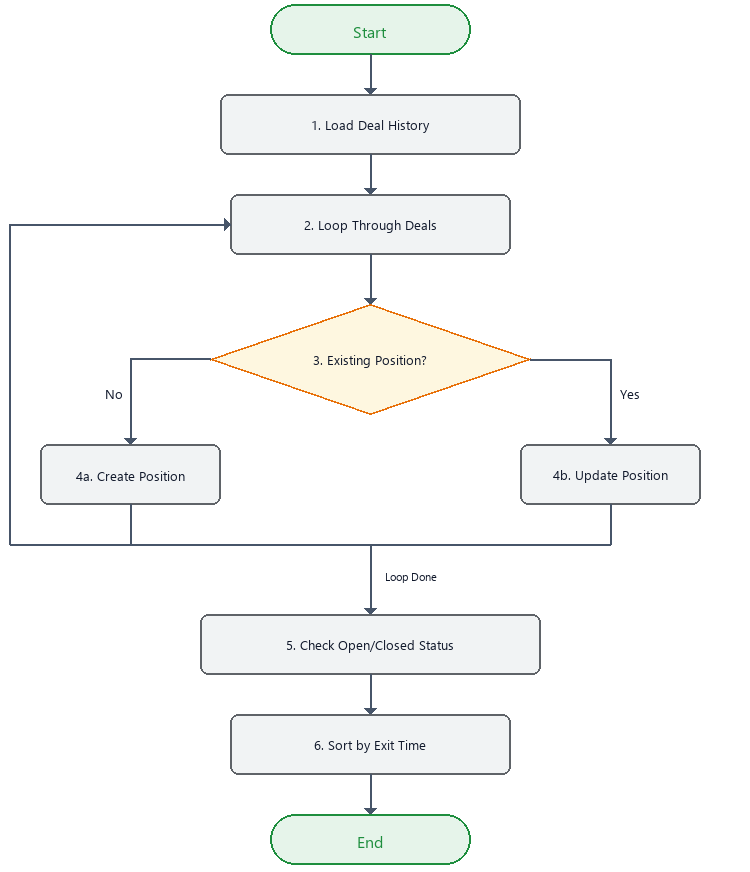
Image 1: Process flowchart showing how entry and exit deals are paired into unified position trades.
Reconstructed positions must be arranged chronologically by exit time. This step is necessary to compute drawdowns and build the equity curve. The chronological sorting is performed by the SortTradesByExitTime() method, which implements a Shell-sort algorithm. This sorting method is highly efficient for account deal history queries, requiring no dynamic heap allocations and running completely in-place. The SortTradesByExitTime() implementation is as follows:
//+------------------------------------------------------------------+
//| Sorts trade array by exit time using Shell sort algorithm        |
//+------------------------------------------------------------------+
void CPortfolioAnalyzer::SortTradesByExitTime(SPositionTrade &arr[])
  {
   int n = ::ArraySize(arr);
   int gap = n / 2;
   while(gap > 0)
     {
      for(int i = gap; i < n; i++)
        {
         SPositionTrade tmp = arr[i];
         int j = i;
         while(j >= gap && arr[j - gap].exitTime > tmp.exitTime)
           {
            arr[j] = arr[j - gap];
            j -= gap;
           }
         arr[j] = tmp;
        }
      gap /= 2;
     }
  }
To support comment filtering, the dashboard normalizes trade comments using the GetNormalizedComment() method. Strategies are often grouped by their comment labels, and similar comment prefixes can represent the same underlying system.
The normalization algorithm replaces separators (underscores and hyphens) with spaces, splits the string into tokens, and takes the first token. The first letter of this token is capitalized, while the subsequent characters are converted to lowercase. The resulting string represents the normalized comment, providing clean categorization on the dashboard. The full tokenization and capitalization logic of GetNormalizedComment() follows:
//+------------------------------------------------------------------+
//| Normalizes a trade comment for grouping similar strategies       |
//+------------------------------------------------------------------+
string CPortfolioAnalyzer::GetNormalizedComment(string comment)
  {
   string s = comment;
   ::StringTrimLeft(s);
   ::StringTrimRight(s);
   if(s == "")
      return "[No Comment]";
   if(!m_groupSimilar)
      return s;

//--- Replace separators with spaces for tokenization
   string clean_s = s;
   for(int i = 0; i < ::StringLen(clean_s); i++)
     {
      ushort c = ::StringGetCharacter(clean_s, i);
      if(c == '_' || c == '-')
         ::StringSetCharacter(clean_s, i, ' ');
     }

   string tokens[];
   int num_tokens = ::StringSplit(clean_s, ' ', tokens);
   if(num_tokens <= 0)
      return "[No Comment]";

//--- Collect non-empty tokens
   string active_tokens[];
   int num_active = 0;
   for(int i = 0; i < num_tokens; i++)
     {
      string t = tokens[i];
      ::StringTrimLeft(t);
      ::StringTrimRight(t);
      if(t != "")
        {
         num_active++;
         ::ArrayResize(active_tokens, num_active);
         active_tokens[num_active - 1] = t;
        }
     }

   if(num_active <= 0)
      return "[No Comment]";

//--- Capitalize first token to create a canonical name
   string first_token = active_tokens[0];
   string result = first_token;
   int t_len = ::StringLen(first_token);
   if(t_len > 0)
     {
      string f_letter = ::StringSubstr(first_token, 0, 1);
      ::StringToUpper(f_letter);
      string r_letters = ::StringSubstr(first_token, 1);
      ::StringToLower(r_letters);
      result = f_letter + r_letters;
     }

   return result;
  }
The normalized comment value is used together with the Expert Advisor magic number to build the dashboard's strategy filters. Magic-number filtering groups trades by the DEAL_MAGIC field captured during LoadTrades(). Comment filtering groups trades by the normalized comment returned by GetNormalizedComment(). This dual mode is important when several Expert Advisors share one magic number, or when one strategy family uses several magic numbers but keeps a consistent comment prefix.
The dashboard exposes FILTER BY MAGIC NUMBER and FILTER BY COMMENT as the primary attribution controls. When comment filtering is active, GROUP SIMILAR applies the token-based comment normalization described above, allowing similar comments to be aggregated under the same strategy family without opening additional dialogs.
Custom canvas visualization and high-DPI scaling
The vector-based visualization engine uses the CCanvas class, which operates within a 32-bit ARGB color space. Because standard transparency blending can introduce significant rendering overhead on the main application chart, the dashboard relies on a custom color-blending method: BlendColors(). This method manually calculates the combined weightings of background and foreground colors using their respective alpha-channel transparency values.
//+------------------------------------------------------------------+
//| Blends two colors using alpha weight while keeping canvas opaque |
//+------------------------------------------------------------------+
uint CPortfolioAnalyzer::BlendColors(uint bg, uint fg, uchar alpha)
  {
   if(alpha == 0)
      return bg;
   if(alpha == 255)
      return fg;

   uint r_bg = (bg >> 16) & 0xFF;
   uint g_bg = (bg >>  8) & 0xFF;
   uint b_bg =  bg         & 0xFF;

   uint r_fg = (fg >> 16) & 0xFF;
   uint g_fg = (fg >>  8) & 0xFF;
   uint b_fg =  fg         & 0xFF;

   uint r = (r_fg * alpha + r_bg * (255 - alpha)) / 255;
   uint g = (g_fg * alpha + g_bg * (255 - alpha)) / 255;
   uint b = (b_fg * alpha + b_bg * (255 - alpha)) / 255;

   return (0xFF000000 | (r << 16) | (g << 8) | b);
  }
This approach computes the final ARGB color value internally, keeping the main drawing canvas completely opaque while rendering smooth anti-aliased elements. The manual blending equation calculates the red, green, and blue components based on the alpha weighting:
Color_channel = (Color_fg * alpha + Color_bg * (255 - alpha)) / 255
Using this pre-blended approach prevents the platform's drawing engine from performing real-time transparency updates on every mouse hover event, keeping chart updates fast.
To ensure consistent rendering on both high-resolution and standard displays, the dashboard uses two scaling functions: SV() and FS(). The pixel scaling function SV() scales line and panel dimensions based on the computed scaling factor m_scale. The font scaling function FS() modifies font sizes, keeping all labels legible regardless of display settings.
The scaling calculations are based on a nominal 1400x800 resolution base. The scaling factor is calculated inside the DrawDashboard() method, dividing current chart dimensions by the nominal dimensions.
To prevent visual clipping and graphic deformations, the scaling factor is clamped to a safe range inside DrawDashboard():
   m_scale = ::MathMin(sx, sy);
   if(m_scale < 0.5)
      m_scale = 0.5;
   if(m_scale > 2.5)
      m_scale = 2.5;
The dashboard interface is divided into four working regions: header bar, performance metrics panel, chart tab area, and filters block. The header bar displays the program name, current balance, equity, floating profit or loss, date range, and preset buttons. The filters block controls strategy attribution by magic number or normalized comment, while the chart tab area switches between the equity curve and the correlation matrix.
Portfolio metrics include total profit or loss, position count, win rate, profit factor, recovery factor, maximum drawdown, consecutive wins and losses, average trade duration, trades per week, commissions, and swap costs.
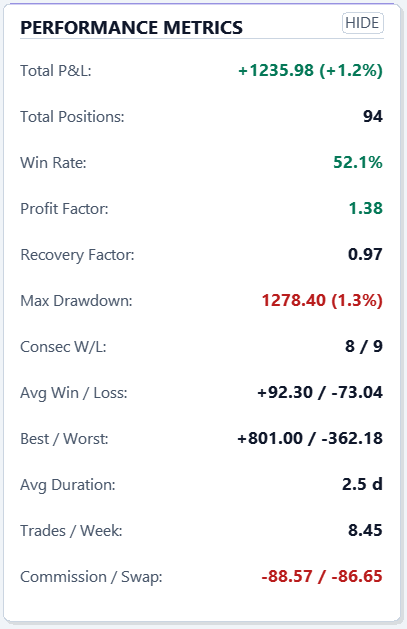
Image 2: Performance metrics panel showing portfolio metrics calculated from reconstructed closed positions.
In the shown snapshot, the selected account deal history contains 94 closed positions, a total net result of +1235.98 (+1.2%), a win rate of 52.1%, a profit factor of 1.38, and a maximum drawdown of 1278.40 (1.3%). These values are included only to show how the dashboard presents portfolio metrics after strategy attribution has been applied.
The equity-curve view converts chronologically sorted closed-position returns into a cumulative curve. The date controls define the period used by both the chart and the portfolio metrics.
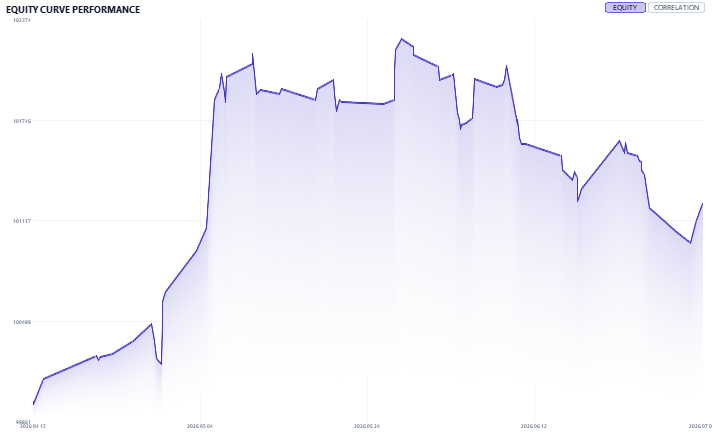
Image 3: Equity-curve panel showing cumulative portfolio behavior over the selected date range.
Several drawing decisions are intentionally fixed to keep the interface stable on standard chart templates. The time axis and value axis render exactly four grid divisions, and the initial balance reference for the closed-position equity curve is reconstructed by subtracting the cumulative net profit from the current balance.
The dashboard does not generate forecasts. It reads account deal history, reconstructs closed positions, groups them by magic number or normalized comment, and displays portfolio metrics together with current account-level balance, equity, and floating profit or loss.
Portfolio metrics and the equity curve summarize the selected portfolio as one combined result. The correlation matrix adds the strategy-dependency layer by comparing daily returns between selected strategies.
Calculating the Pearson correlation matrix
To detect strategy redundancy and prevent risk concentration, the Portfolio Analyzer dashboard calculates a Pearson correlation matrix. It evaluates the daily returns of all active strategies over the selected date range. When multiple systems execute trades based on similar logic, their equity curves tend to fluctuate in tandem. The correlation matrix identifies these dependencies, allowing developers to see whether diversification is genuine or merely nominal.
The daily returns for each active strategy are calculated by mapping closed positions to a daily calendar grid. The Pearson correlation coefficient r between strategy X and strategy Y is calculated using the standard product-moment formula:
r = Sum((X_d - mean_X) * (Y_d - mean_Y)) / Sqrt(Sum((X_d - mean_X)^2) * Sum((Y_d - mean_Y)^2))
Where X_d and Y_d represent the net returns on day d for strategies X and Y, while mean_X and mean_Y represent the mean daily returns over the selected period. The correlation matrix is symmetrically populated. This symmetry is enforced by copying the computed correlation value r to both coordinate (i, j) and coordinate (j, i). Self-correlation on the main diagonal is hardcoded to 1.0.
Note: The following code is an excerpt from DrawCorrelationMatrix(). It focuses on selecting active strategies, mapping daily returns, and calculating the Pearson coefficient. The attached source file continues with the full heatmap layout and canvas drawing logic.
//+------------------------------------------------------------------+
//| Draws the correlation matrix heatmap between strategies          |
//+------------------------------------------------------------------+
void CPortfolioAnalyzer::DrawCorrelationMatrix(int rx1, int ry1, int rx2, int ry2)
  {
//--- Collect active strategies based on current filter mode
   int num_active = 0;
   long active_magics[];
   string active_comments[];

   if(m_filterByMagic)
     {
      for(int i = 0; i < ::ArraySize(m_uniqueMagics); i++)
         if(m_selectedMagics[i])
           {
            num_active++;
            ::ArrayResize(active_magics, num_active);
            active_magics[num_active - 1] = m_uniqueMagics[i];
           }
     }
   else
     {
      for(int i = 0; i < ::ArraySize(m_uniqueComments); i++)
         if(m_selectedComments[i])
           {
            num_active++;
            ::ArrayResize(active_comments, num_active);
            active_comments[num_active - 1] = m_uniqueComments[i];
           }
     }

//--- Require at least 2 strategies for correlation
   if(num_active < 2)
     {
      m_canvas.FontSet(m_fontName, FS(120), FW_BOLD);
      int tw = 0, th = 0;
      m_canvas.TextSize("SELECT AT LEAST 2 STRATEGIES FOR CORRELATION", tw, th);
      m_canvas.TextOut((rx1 + rx2) / 2, (ry1 + ry2) / 2 - th / 2,
                       "SELECT AT LEAST 2 STRATEGIES FOR CORRELATION",
                       ::ColorToARGB(m_labelColor, 255), TA_CENTER);
      return;
     }

//--- Compute time range in days
   datetime t_start = m_dateFrom;
   datetime t_end   = m_dateTo;
   int num_days = (int)((t_end - t_start) / 86400) + 1;

   if(num_days < 2)
     {
      m_canvas.FontSet(m_fontName, FS(120), FW_BOLD);
      int tw = 0, th = 0;
      m_canvas.TextSize("SELECT A LARGER TIME RANGE", tw, th);
      m_canvas.TextOut((rx1 + rx2) / 2, (ry1 + ry2) / 2 - th / 2,
                       "SELECT A LARGER TIME RANGE",
                       ::ColorToARGB(m_labelColor, 255), TA_CENTER);
      return;
     }

//--- Allocate daily returns matrix (num_active * num_days)
   double daily_returns[];
   ::ArrayResize(daily_returns, num_active * num_days);
   ::ArrayInitialize(daily_returns, 0.0);

//--- Fill daily returns from filtered trades
   int fc = ::ArraySize(m_filteredTrades);
   for(int i = 0; i < fc; i++)
     {
      int day_idx = (int)((m_filteredTrades[i].exitTime - t_start) / 86400);
      if(day_idx < 0 || day_idx >= num_days)
         continue;

      int strategy_idx = -1;
      if(m_filterByMagic)
        {
         long mg = m_filteredTrades[i].magic;
         for(int j = 0; j < num_active; j++)
            if(active_magics[j] == mg)
              {
               strategy_idx = j;
               break;
              }
        }
      else
        {
         string dc = GetNormalizedComment(m_filteredTrades[i].comment);
         for(int j = 0; j < num_active; j++)
            if(active_comments[j] == dc)
              {
               strategy_idx = j;
               break;
              }
        }

      if(strategy_idx >= 0)
         daily_returns[strategy_idx * num_days + day_idx] += m_filteredTrades[i].netProfit;
     }

//--- Compute Pearson correlation matrix
   double corr_matrix[];
   ::ArrayResize(corr_matrix, num_active * num_active);
   ::ArrayInitialize(corr_matrix, 0.0);

   for(int i = 0; i < num_active; i++)
     {
      corr_matrix[i * num_active + i] = 1.0; // self-correlation
      for(int j = i + 1; j < num_active; j++)
        {
         double sum_x = 0, sum_y = 0;
         int offset_i = i * num_days;
         int offset_j = j * num_days;

         for(int d = 0; d < num_days; d++)
           {
            sum_x += daily_returns[offset_i + d];
            sum_y += daily_returns[offset_j + d];
           }
         double mean_x = sum_x / num_days;
         double mean_y = sum_y / num_days;

         double var_x = 0, var_y = 0, cov_xy = 0;
         for(int d = 0; d < num_days; d++)
           {
            double dx = daily_returns[offset_i + d] - mean_x;
            double dy = daily_returns[offset_j + d] - mean_y;
            var_x  += dx * dx;
            var_y  += dy * dy;
            cov_xy += dx * dy;
           }

         double corr = 0.0;
         if(var_x > 0.0 && var_y > 0.0)
            corr = cov_xy / ::MathSqrt(var_x * var_y);

         corr_matrix[i * num_active + j] = corr;
         corr_matrix[j * num_active + i] = corr; // symmetric
        }
     }
  }
The resulting correlation matrix is displayed on the chart as a color-coded heatmap.
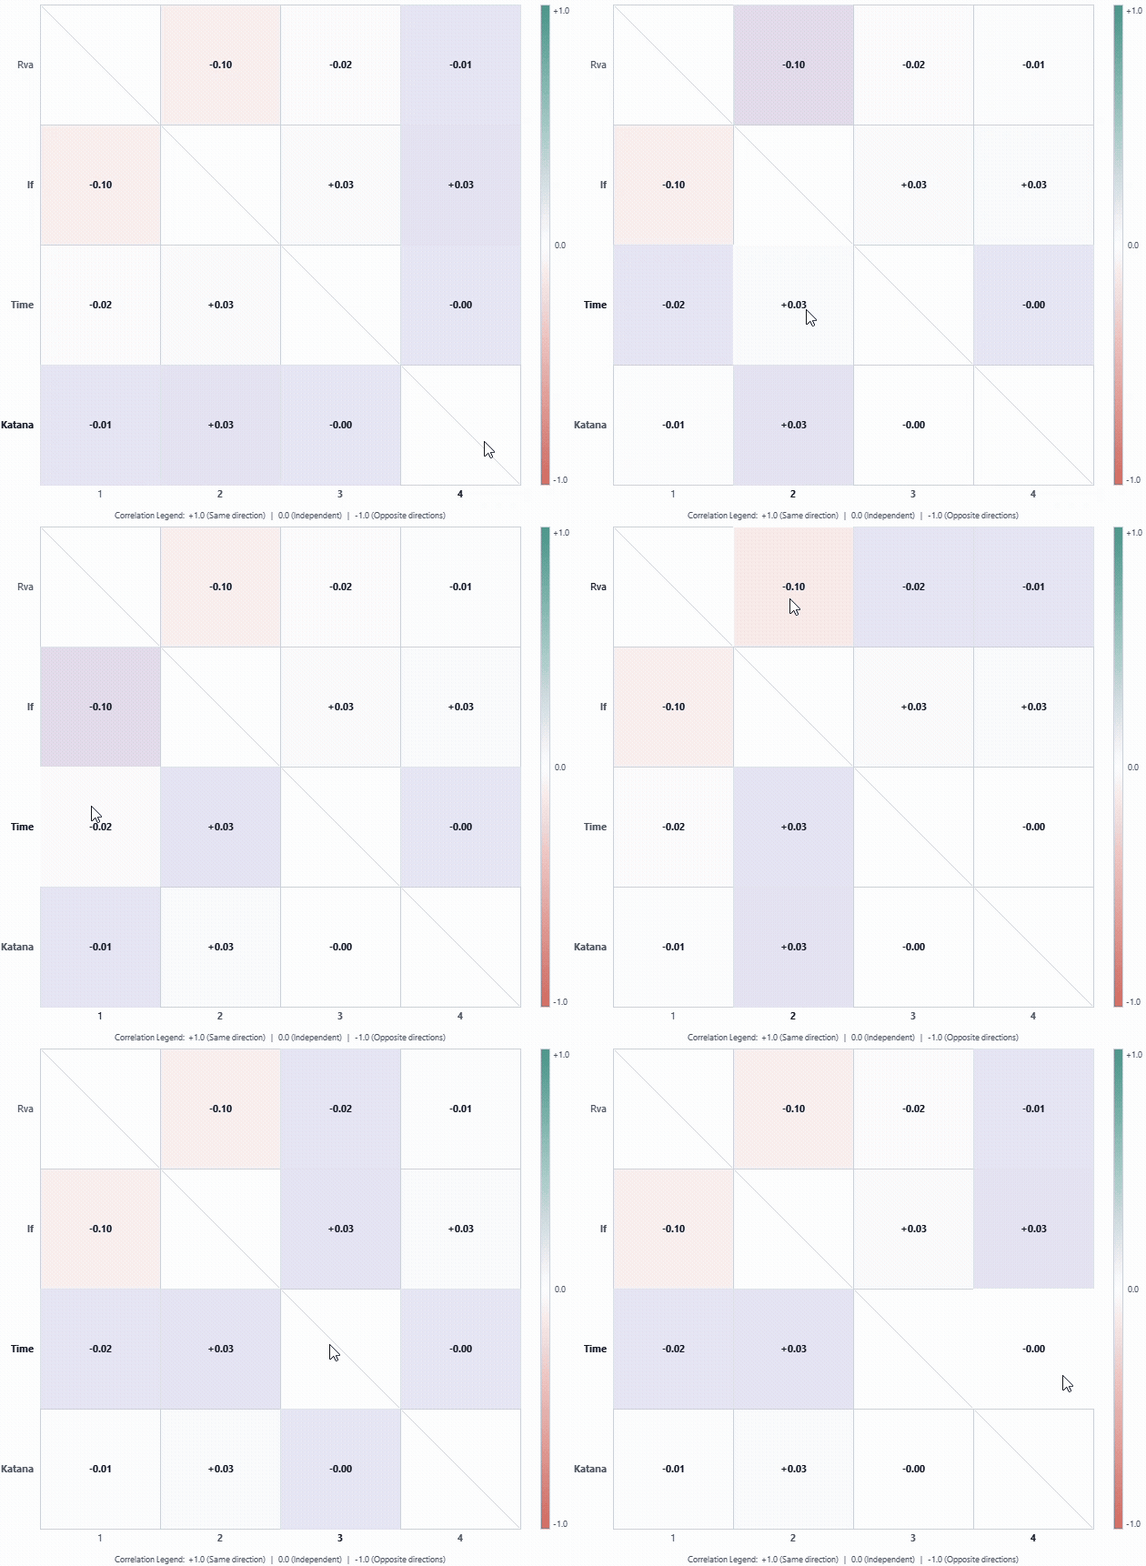
Image 4: Close-up of the interactive correlation matrix displaying strategy dependencies.
With the internal data structures, calculation algorithms, and drawing canvas fully implemented, the remaining step is operational: compile Portfolio_Analyzer.mq5, attach it to a separate chart, and let it read the account deal history without modifying any trading Expert Advisor already running on the account.
Running the standalone dashboard
Portfolio_Analyzer.mq5 is compiled and launched as its own Expert Advisor. It does not need to be copied into existing trading robots, and the trading Expert Advisors do not need source-code changes. The dashboard can be attached to any separate chart because it reads account deal history at the account level rather than relying on the symbol of the chart where it is running.
After launch, the dashboard initializes its canvas, loads the selected account deal history, reconstructs closed positions, and applies strategy attribution through magic number or normalized comment. Portfolio metrics are recalculated from account deal history, while balance, equity, and floating profit or loss are read from the current account state.
The minimal operating sequence is therefore direct:
- Compile Portfolio_Analyzer.mq5 in the MetaEditor.
- Open a separate chart in the MetaTrader 5 terminal.
- Attach the compiled Portfolio_Analyzer Expert Advisor to that chart.
- Configure display settings, update interval, colors, and comment-grouping behavior in the input dialog.
- Use the dashboard filters to inspect strategy attribution by magic number or normalized comment.
Once the standalone dashboard is running, the remaining implementation concerns are mathematical safeguards and rendering limits. These protections prevent division errors, unstable percentages, and interface deformation during active market updates.
Limitations and safeguards
Runtime account-history dashboards require mathematical safety guards. Missing safeguards can produce runtime errors, unstable percentages, or frozen dashboard updates. The Portfolio Analyzer dashboard implements three main safeguards.
The first safeguard addresses division-by-zero errors in performance metric calculations. For instance, the profit factor is calculated by dividing gross profits (gp) by gross losses (gl). If a strategy has no losing trades, gross losses equal zero, which would trigger a division-by-zero error. RecalculateStats() handles that case with a direct conditional expression:
m_statProfitFactor = (::MathAbs(gl) > 0) ? gp / ::MathAbs(gl) : gp;
The second safeguard is applied inside the percentage calculation for net profits. The calculation divides cumulative net profit by the initial account balance. The dashboard reconstructs the initial balance by subtracting net closed profit from the current account balance. In rare situations, this calculation could yield a value that is less than or equal to zero. To prevent division errors, the dashboard implements a safety guard that defaults the initial balance to $10,000.0 if the calculated value does not exceed zero:
double sb = ::AccountInfoDouble(ACCOUNT_BALANCE) - gnet;
if(sb <= 0)
   sb = 10000.0; // safety fallback to prevent division by zero
The third safeguard restricts canvas rendering when display dimensions are too small. If the terminal chart is minimized or resized below a minimum threshold of 700 pixels in width or 450 pixels in height, the drawing engine suspends rendering. Instead of drawing the dashboard components, it clears the canvas and displays a resolution error message, preventing graphic overlaps and layout deformation.
Beyond mathematical safeguards, developers must consider attribution limits in account deal history. The dashboard reconstructs closed positions from account deal history and assigns each position to a strategy by using DEAL_MAGIC and DEAL_COMMENT. If an Expert Advisor does not set a stable magic number, overwrites comments, or uses inconsistent comment prefixes, the dashboard can still calculate account-level portfolio metrics, but strategy attribution becomes less precise.
Conclusion and possible improvements
The Portfolio Analyzer dashboard runs on a separate chart without modifying any trading Expert Advisor. By querying account deal history through HistorySelect(), it reconstructs closed positions, applies strategy attribution, displays twelve portfolio metrics, plots the equity curve, and exposes strategy dependencies through the correlation matrix.
This separation of responsibilities changes the workflow: trading systems keep executing orders, while the standalone dashboard reads current account state and presents portfolio analysis in one interface. This article is the first part of an ongoing series; subsequent parts will extend the architecture with automated risk alerts, CSV export, and per-strategy drawdown overlays.
To plan future enhancements, proposed modifications are structured in the table below, categorizing development goals by system domain:
| Category | Proposed Enhancement | Operational Objective |
|---|---|---|
| Data Export | Automated CSV reports | Export strategy metrics and daily returns directly to the local terminal sandbox. |
| Excel XML generation | Enable direct spreadsheet generation for external mathematical analysis and reporting. | |
| AI Analysis | AI-assisted portfolio review | Analyze exported strategy metrics, drawdown periods, and correlation patterns to generate structured portfolio analysis summaries for the developer. |
| Visual Enhancements | Strategy-specific drawdown lines | Plot individual strategy equity drawdowns on the main dashboard chart for comparison. |
| Automation | Automated email alerts | Dispatch real-time warning notifications when strategy-specific drawdowns exceed safety bounds. |
| Automated risk mitigation rules | Programmatically halt or reduce sizing of specific strategies when drawdown limits are breached. |
Warning: All rights to these materials are reserved by MetaQuotes Ltd. Copying or reprinting of these materials in whole or in part is prohibited.
This article was written by a user of the site and reflects their personal views. MetaQuotes Ltd is not responsible for the accuracy of the information presented, nor for any consequences resulting from the use of the solutions, strategies or recommendations described.

 Custom Indicator Workshop (Part 4) : Automating UT Bot Alerts into a Trading Expert Advisor
 Exponentially Weighted Covariance Matrix in MQL5: Building an Adaptive Correlation Monitor for Multi-Symbol EAs
 Trading Robot Based on a GPT Language Model
 N-BEATS Network-Based Forex EA

- Free trading apps
- Over 8,000 signals for copying
- Economic news for exploring financial markets
You agree to website policy and terms of use