

Mapping Dealer Gamma Exposure (GEX) in MetaTrader 5: Walls, the Zero-Gamma Flip, and a Chart Overlay
 2 403
2 403
 6
6

Introduction
Price near an option expiry does not move freely. It gets pulled. If you trade index options you have felt it: a market that drifts, coils, and pins to a round number into the close, or one that suddenly stops respecting any level and runs. That behaviour is not mystical. It is the mechanical footprint of the dealers who sold you those options and now have to hedge them. Aggregate the gamma of every contract in the chain, weight each by how much of it is actually open, and attach the sign of who is long and who is short. What you get is a map of where that hedging absorbs moves and where it amplifies them. That map is gamma exposure, or GEX, and building it in MetaTrader 5 is what this article is about.
The tool we build reads an option chain, either from a CSV file or from the broker's native MetaTrader 5 option symbols, computes the Black-Scholes gamma of every contract, and sums those gammas into a signed dealer-exposure profile across strikes. It then draws that profile directly on the chart: a bar at every strike, a call wall and a put wall where exposure is most concentrated, and the zero-gamma flip price where the whole book crosses from net long to net short gamma. That flip is the number worth the whole exercise, because it separates a mean-reverting regime from a trending one. It is intended as a daily-use gauge: attach it, and you read the same positioning picture a desk reads.
One honest note up front, because it shapes the design. GEX needs an option chain with open interest, and a retail MetaTrader 5 account usually does not carry one unless the broker offers options. So the tool ships with two data paths: a native provider for accounts that do have option symbols, and a CSV provider that runs on any account at all, fed by a sample chain we generate. Everything the tool computes is only as real as the chain you feed it, and we are explicit about that throughout.
We assume you know options. We will not spend pages defining gamma or open interest; we treat those as shared vocabulary and move quickly to how each piece is implemented in MQL5.
We will cover:
- What Gamma Exposure Tells Us
- The Black-Scholes Core: Pricing, Inversion, and Gamma
- From Chain to Profile: Aggregating Dealer GEX
- Finding the Zero-Gamma Flip
- Two Ways to Feed It: CSV and Native Options
- Drawing the Map on the Chart
- Running the Tool
- Conclusion
What Gamma Exposure Tells Us
Start with the party on the other side of your option trade. When you buy a call, a market maker sells it, and they do not want the directional risk. They hedge it away by holding delta of the underlying, and they keep re-hedging as price moves, because the option's delta changes as price moves. The rate at which delta changes is gamma. Gamma is what forces the dealer to trade the underlying continuously to stay hedged, and the direction of that forced trading is the whole story.
If the dealer is long gamma, their hedge is stabilising: as price rises their delta grows, so they sell the underlying into the rise; as price falls their delta shrinks, so they buy into the fall. They lean against the move. Concentrated across a whole book, long-gamma hedging suppresses volatility and manufactures the mean reversion you see when a market pins to a level. If the dealer is short gamma, everything inverts: they must buy as price rises and sell as it falls, chasing the move, adding fuel. Short-gamma hedging amplifies volatility and turns ordinary moves into trends and squeezes.
The convention this tool follows is the standard one used by every public GEX model. Customers are net long the options they buy, so dealers are net short calls and long puts against them. We treat a call's gamma as a positive contribution to dealer exposure and a put's as a negative one. It is an assumption, not a measured fact, and we say so plainly later. But it is the assumption that makes the numbers line up with observed behaviour, and it is what lets us turn a chain into a single signed profile.
Two things fall out of that profile and they are what a trader actually reads. The first is the pair of walls: the strike with the largest positive exposure (the call wall, which tends to act as a ceiling because dealer selling intensifies there) and the strike with the largest negative exposure (the put wall, a floor for the mirror reason). The second, and more important, level is the zero-gamma flip: the price at which the book's total gamma is exactly zero. Above the flip the aggregate dealer position is typically long gamma, so the regime is mean-reverting and moves get faded; below it the position flips short, so the regime is trending and moves get chased. Where spot sits relative to the flip is a one-glance read on which of those two worlds you are trading in.

Fig. 1. Above the flip dealers are long gamma and hedge against moves (mean reversion); below it they are short gamma and chase them (trend)
That is the entire conceptual payload. The rest of the article is the machinery that turns a list of contracts into that picture: a Greek, an aggregation, a root-find for the flip, two ways to get the data, and a renderer.
The Black-Scholes Core: Pricing, Inversion, and Gamma
Everything numeric in the tool rests on one small, stateless header, BlackScholes.mqh. It holds the pricer, the pieces of the standard normal distribution the pricer needs, an implied-volatility inversion, and the Greek this whole tool is built on: gamma. Nothing in it keeps state, so both data providers can call into it freely.
We start with the option right, defined to line up with MetaTrader 5's own ENUM_SYMBOL_OPTION_RIGHT so the native provider can pass its value straight through without translation:
//+------------------------------------------------------------------+
//| Option right, matching MQL5's ENUM_SYMBOL_OPTION_RIGHT so both   |
//| data providers can pass the value straight through.              |
//+------------------------------------------------------------------+
enum ENUM_OPT_RIGHT
  {
   OPT_CALL = 0,   // right to buy
   OPT_PUT  = 1    // right to sell
  };
The Black-Scholes formula and gamma both need the standard normal distribution. We implement it directly rather than reach for the statistics library, so the header stays a self-contained numeric kernel with no external dependencies. The Abramowitz & Stegun 7.1.26 approximation of the error function is accurate to about 1e-7, far tighter than the noise on any real option quote, and it is a handful of multiplications:
//+------------------------------------------------------------------+
//| Standard normal CDF, via the Abramowitz & Stegun 7.1.26          |
//| approximation of erf. Accurate to about 1e-7, far tighter than   |
//| option-quote noise.                                              |
//+------------------------------------------------------------------+
double NormCDF(const double x)
  {
   double t = 1.0 / (1.0 + 0.2316419 * MathAbs(x));
   double d = 0.3989422804014327 * MathExp(-x * x / 2.0);   // 1/sqrt(2pi) * e^(-x^2/2)
   double p = d * t * (0.319381530 + t * (-0.356563782 + t * (1.781477937 + t * (-1.821255978 + t * 1.330274429))));
   return((x > 0.0) ? 1.0 - p : p);
  }
The probability density function is simpler, and gamma and vega both need it:
//+------------------------------------------------------------------+
//| Standard normal PDF.                                             |
//+------------------------------------------------------------------+
double NormPDF(const double x)
  {
   return(0.3989422804014327 * MathExp(-x * x / 2.0));
  }
The pricer is the textbook Black-Scholes formula for a European option, written to accept a continuous carry yield q alongside the risk-free rate r so it works for dividend-paying underlyings and the general cost-of-carry case. The guard at the top returns pure intrinsic value at or past expiry, or for a non-positive volatility, rather than dividing by zero inside the d1 term:
//+------------------------------------------------------------------+
//| Black-Scholes price of a European option.                        |
//|   S     spot price of the underlying                             |
//|   K     strike price                                             |
//|   r     risk-free rate (annual, continuous)                      |
//|   q     dividend / carry yield (annual, continuous)              |
//|   sigma volatility (annual)                                      |
//|   T     time to expiry in years                                  |
//+------------------------------------------------------------------+
double BSPrice(const ENUM_OPT_RIGHT right, const double S, const double K,
               const double r, const double q, const double sigma, const double T)
  {
   if(T <= 0.0 || sigma <= 0.0)
     {
      //--- at/after expiry, value is pure intrinsic
      double intrinsic = (right == OPT_CALL) ? MathMax(S - K, 0.0) : MathMax(K - S, 0.0);
      return(intrinsic);
     }
   double sqrtT  = MathSqrt(T);
   double d1     = (MathLog(S / K) + (r - q + 0.5 * sigma * sigma) * T) / (sigma * sqrtT);
   double d2     = d1 - sigma * sqrtT;
   double disc_r = MathExp(-r * T);
   double disc_q = MathExp(-q * T);
   if(right == OPT_CALL)
      return(S * disc_q * NormCDF(d1) - K * disc_r * NormCDF(d2));
   else
      return(K * disc_r * NormCDF(-d2) - S * disc_q * NormCDF(-d1));
  }
We need vega to invert the pricer for implied volatility, and it doubles as a filter: when vega is tiny the price barely responds to volatility, so a Newton step there is untrustworthy. Same expiry guard as the pricer:
//+------------------------------------------------------------------+
//| Vega (price sensitivity to a 1.00 change in sigma). Used both as |
//| the Newton step denominator and to reject near-worthless options |
//| whose IV is numerically meaningless.                             |
//+------------------------------------------------------------------+
double BSVega(const double S, const double K, const double r, const double q,
              const double sigma, const double T)
  {
   if(T <= 0.0 || sigma <= 0.0)
      return(0.0);
   double sqrtT = MathSqrt(T);
   double d1    = (MathLog(S / K) + (r - q + 0.5 * sigma * sigma) * T) / (sigma * sqrtT);
   return(S * MathExp(-q * T) * NormPDF(d1) * sqrtT);
  }
Gamma, the Greek This Tool Is Built On
Now the addition that turns a volatility toolkit into a positioning toolkit. Gamma is the second derivative of the option price with respect to spot, or equivalently the rate of change of delta per unit move in the underlying. For a European option under Black-Scholes it has the compact closed form:
Gamma = e^(-q*T) * N'(d1) / (S * sigma * sqrt(T))
Here N'(d1) is the standard normal density at d1, the same d1 the pricer uses. Two facts about this expression drive everything downstream. First, gamma is largest at the money and decays toward zero for deep in- and out-of-the-money strikes, because N'(d1) peaks when d1 is near zero. Second, and crucially, a call and a put on the same strike and expiry have identical gamma. The sign that distinguishes dealer long from dealer short exposure is not in gamma itself; it is applied later, when we aggregate. The function mirrors the pricer's guard exactly and returns zero at or past expiry:
//+------------------------------------------------------------------+
//| Gamma: the rate of change of delta per 1.0 move in the spot, and |
//| the Greek this whole tool is built on. Both a call and a put on  |
//| the same strike/expiry share the same gamma, so the sign that    |
//| turns it into dealer exposure is applied later, not here.        |
//| Same expiry/volatility guard as the pricer: gamma is undefined   |
//| at or past expiry, so we return zero there.                      |
//+------------------------------------------------------------------+
double BSGamma(const double S, const double K, const double r, const double q,
               const double sigma, const double T)
  {
   if(T <= 0.0 || sigma <= 0.0 || S <= 0.0)
      return(0.0);
   double sqrtT = MathSqrt(T);
   double d1    = (MathLog(S / K) + (r - q + 0.5 * sigma * sigma) * T) / (sigma * sqrtT);
   return(MathExp(-q * T) * NormPDF(d1) / (S * sigma * sqrtT));
  }

Fig. 2. Gamma peaks at the money and decays to zero at the wings; a call and a put on the same strike share it exactly
Recovering Volatility from a Price
Gamma is a function of volatility, so before we can compute it for a contract we need that contract's implied volatility. When the server does not hand us one, we recover it by inverting the pricer. Implied volatility is defined implicitly: it is the sigma that makes the model price equal the observed price. There is no closed form for it, so we search. The search is a hybrid of Newton-Raphson and bisection: we keep a bracket that is guaranteed to contain the solution, take the fast Newton step when it lands inside the bracket, and fall back to bisecting the bracket whenever Newton misbehaves, either because vega is too small to trust or because the step would jump outside. Before any of that, a price below intrinsic value has no valid implied volatility, and we flag it with a negative sentinel:
//+------------------------------------------------------------------+
//| Implied volatility by inverting the Black-Scholes price. Uses    |
//| Newton-Raphson (fast) and falls back to bisection whenever a     |
//| Newton step leaves the bracket, which keeps the solver robust for|
//| deep in/out-of-the-money quotes where vega is tiny.              |
//|                                                                  |
//| Returns the implied volatility, or a negative value if no valid  |
//| IV exists for the given inputs (e.g. price below intrinsic).     |
//+------------------------------------------------------------------+
double ImpliedVol(const ENUM_OPT_RIGHT right, const double price, const double S,
                  const double K, const double r, const double q, const double T)
  {
   if(price <= 0.0 || S <= 0.0 || K <= 0.0 || T <= 0.0)
      return(-1.0);

//--- price must sit above intrinsic value or no positive sigma solves it
   double intrinsic = (right == OPT_CALL) ? MathMax(S * MathExp(-q * T) - K * MathExp(-r * T), 0.0)
                      : MathMax(K * MathExp(-r * T) - S * MathExp(-q * T), 0.0);
   if(price < intrinsic - 1e-8)
      return(-1.0);

   double loVol = 1e-4, hiVol = 5.0;   // 0.01% .. 500% brackets the search
   double sigma = 0.2;                 // a sensible starting guess (20%)

   for(int i = 0; i < 100; i++)
     {
      double model = BSPrice(right, S, K, r, q, sigma, T);
      double diff  = model - price;
      if(MathAbs(diff) < 1e-6)
         return(sigma);

      //--- shrink the bracket using the sign of the error (price rises monotonically with sigma)
      if(diff > 0.0)
         hiVol = sigma;
      else
         loVol = sigma;

      double vega = BSVega(S, K, r, q, sigma, T);
      double next;
      if(vega > 1e-8)
         next = sigma - diff / vega;       // Newton step
      else
         next = 0.5 * (loVol + hiVol);     // vega too small: bisect

      //--- if Newton jumped outside the bracket, fall back to bisection
      if(next <= loVol || next >= hiVol)
         next = 0.5 * (loVol + hiVol);

      if(MathAbs(next - sigma) < 1e-8)
         return(next);
      sigma = next;
     }
   return(sigma);
  }
The loop caps at 100 iterations, far more than the hybrid ever needs, but it guarantees termination for pathological inputs. Everything in this header is stateless and pure, which is deliberate: both data providers call ImpliedVol and BSGamma the same way, and neither has to know anything about the solver's internals.
From Chain to Profile: Aggregating Dealer GEX
A raw chain is a flat, unordered list of quotes. A GEX profile is one signed number per strike. The job of GexData.mqh is to turn the first thing into the second, for a single expiry, and to derive from it the headline numbers a trader reads. A single quote is one small struct, carrying everything the gamma math needs, including the field that turns a contract's gamma into a real exposure: its open interest.
//+------------------------------------------------------------------+
//| One raw option quote, before it is aggregated into the profile.  |
//| It carries everything the gamma math needs: the strike, the      |
//| right, the time to expiry, and the open interest that scales a   |
//| contract's gamma into a real dealer exposure. The iv field is    |
//| filled by the provider (inverted from the price, or read from    |
//| the server) because gamma is a function of volatility.           |
//+------------------------------------------------------------------+
struct OptionQuote
  {
   ENUM_OPT_RIGHT    right;
   double            strike;
   datetime          expiry;
   double            price;          // market mid price
   double            spot;           // underlying price
   double            rate;           // risk-free rate
   double            open_interest;  // contracts outstanding at this strike
   double            iv;             // filled in by the provider (-1 if invalid)
  };
The profile itself is a class. It owns the sorted unique strikes for the chosen expiry, the signed dealer GEX aligned to those strikes, and the subset of quotes that survived onto that expiry. From those it derives the net GEX, the min and max per-strike exposure (for scaling the bars), the two walls, and the flip. The renderer reads all of it through the public accessors and never touches the internals:
//+------------------------------------------------------------------+ //| The gamma-exposure profile for a single expiry. It reduces a | //| flat option chain to one number per strike: the net dealer gamma | //| exposure (GEX) at that strike, positive where dealers are long | //| gamma and negative where they are short. From that profile it | //| derives the three levels traders actually read: the call wall | //| (largest positive GEX), the put wall (largest negative GEX), and | //| the zero-gamma "flip" price where total exposure crosses zero. | //+------------------------------------------------------------------+ class CGexProfile { private: double m_strikes[]; // sorted unique strikes for the chosen expiry double m_gex[]; // signed dealer GEX per strike (aligned to m_strikes) OptionQuote m_quotes[]; // the quotes that survived onto the chosen expiry double m_spot; double m_multiplier; // contract size (100 for US equity options) datetime m_expiry; // the single expiry this profile represents double m_netGex; // sum of m_gex, the headline regime number double m_gexMin, m_gexMax; // most-negative / most-positive per-strike GEX double m_callWall; // strike of the largest positive GEX double m_putWall; // strike of the most-negative GEX double m_flip; // zero-gamma price (<0 if none found) public: CGexProfile(void) : m_spot(0), m_multiplier(100.0), m_expiry(0), m_netGex(0), m_gexMin(0), m_gexMax(0), m_callWall(0), m_putWall(0), m_flip(-1.0) {} //--- accessors the renderer reads int NStrikes(void) const { return(ArraySize(m_strikes)); } double Strike(const int i) const { return(m_strikes[i]); } double Gex(const int i) const { return(m_gex[i]); } double Spot(void) const { return(m_spot); } datetime Expiry(void) const { return(m_expiry); } double NetGex(void) const { return(m_netGex); } double GexMin(void) const { return(m_gexMin); } double GexMax(void) const { return(m_gexMax); } double CallWall(void) const { return(m_callWall); } double PutWall(void) const { return(m_putWall); } double Flip(void) const { return(m_flip); } void Multiplier(const double m) { m_multiplier = (m > 0.0) ? m : 100.0; } //--- build the profile; target is the expiry to use, or 0 for "nearest future" bool Build(OptionQuote "es[], const datetime target = 0); private: datetime PickExpiry(OptionQuote "es[], const datetime target) const; double DealerGammaAtSpot(const double S) const; double SolveFlip(void) const; int IndexOf(const double &arr[], const double v) const; };
Choosing One Expiry
A GEX map is always a single expiry. Near-dated positioning is what pins index price, so mixing expiries would blur the very structure we are trying to see. PickExpiry either honours a caller-requested expiry or, given none, takes the nearest one still in the future. An expired contract never wins here:
//+------------------------------------------------------------------+ //| Choose which expiry to profile. A GEX map is always a single | //| expiry (near-dated positioning is what pins index price), so we | //| either honour the caller's requested expiry or, when none is | //| given, take the nearest one still in the future. Expired | //| contracts never win here. | //+------------------------------------------------------------------+ datetime CGexProfile::PickExpiry(OptionQuote "es[], const datetime target) const { datetime now = TimeCurrent(); if(now == 0) now = TimeLocal(); datetime best = 0; double bestDist = 1e18; int n = ArraySize(quotes); for(int i = 0; i < n; i++) { datetime e = quotes[i].expiry; if(e <= now) continue; // never profile an expired contract //--- distance is "closeness to the requested expiry", or "closeness to now" double dist = (target > 0) ? MathAbs((double)(e - target)) : (double)(e - now); if(dist < bestDist) { bestDist = dist; best = e; } } return(best); }
The Aggregation
Now the heart of the header. Build picks the expiry, keeps only the quotes on it that have a valid implied volatility and positive open interest (no gamma or no size means no exposure), collects the sorted unique strikes, and sums the signed dealer GEX at each strike. Per contract the exposure is:
contractGEX = gamma * OI * multiplier * spot^2 * 0.01
This is the standard dollar-gamma figure: the change in the dealer's aggregate delta, in currency terms, per a 1% move in the underlying. The spot^2 term converts a per-unit gamma into a per-percent-move dollar figure, the multiplier is the contract size (100 for US equity options), and the 0.01 scales to one percent. The dealer sign convention is applied right here: a call's exposure adds, a put's subtracts.
//+------------------------------------------------------------------+ //| Build the single-expiry profile. Pick the expiry, keep only the | //| quotes on it, collect the sorted unique strikes, then sum the | //| signed dealer GEX at each strike. The dealer-sign convention is | //| the standard one: dealers are assumed short calls and long puts | //| against the customer, so a call's gamma adds to exposure and a | //| put's subtracts. Per contract the exposure is | //| gamma * OI * multiplier * spot^2 * 0.01 | //| i.e. dollar gamma per 1% move in the underlying. | //+------------------------------------------------------------------+ bool CGexProfile::Build(OptionQuote "es[], const datetime target) { int n = ArraySize(quotes); if(n == 0) return(false); m_spot = quotes[0].spot; m_expiry = PickExpiry(quotes, target); if(m_expiry == 0) { Print("CGexProfile: no future expiry to profile"); return(false); } //--- keep only this expiry's usable quotes (valid IV, positive OI) ArrayResize(m_quotes, 0); ArrayResize(m_strikes, 0); for(int i = 0; i < n; i++) { if(quotes[i].expiry != m_expiry) continue; if(quotes[i].iv <= 0.0 || quotes[i].open_interest <= 0.0) continue; // no gamma or no size means no exposure int s = ArraySize(m_quotes); ArrayResize(m_quotes, s + 1); m_quotes[s] = quotes[i]; if(IndexOf(m_strikes, quotes[i].strike) < 0) { int k = ArraySize(m_strikes); ArrayResize(m_strikes, k + 1); m_strikes[k] = quotes[i].strike; } } ArraySort(m_strikes); int nk = ArraySize(m_strikes); if(nk < 2) { Print("CGexProfile: fewer than 2 usable strikes on the chosen expiry"); return(false); } //--- sum signed dealer GEX per strike, evaluated at the live spot datetime now = TimeCurrent(); if(now == 0) now = TimeLocal(); ArrayResize(m_gex, nk); ArrayInitialize(m_gex, 0.0); int nq = ArraySize(m_quotes); for(int i = 0; i < nq; i++) { double T = (double)(m_quotes[i].expiry - now) / (365.0 * 24 * 3600); if(T <= 0.0) continue; double g = BSGamma(m_spot, m_quotes[i].strike, m_quotes[i].rate, 0.0, m_quotes[i].iv, T); double contractGex = g * m_quotes[i].open_interest * m_multiplier * m_spot * m_spot * 0.01; double signed_ = (m_quotes[i].right == OPT_CALL) ? contractGex : -contractGex; int k = IndexOf(m_strikes, m_quotes[i].strike); if(k >= 0) m_gex[k] += signed_; } //--- derive the headline numbers and the walls from the per-strike profile m_netGex = 0.0; m_gexMin = 1e18; m_gexMax = -1e18; m_callWall = m_strikes[0]; m_putWall = m_strikes[0]; double maxPos = -1e18, maxNeg = 1e18; for(int k = 0; k < nk; k++) { m_netGex += m_gex[k]; if(m_gex[k] < m_gexMin) m_gexMin = m_gex[k]; if(m_gex[k] > m_gexMax) m_gexMax = m_gex[k]; if(m_gex[k] > maxPos) { maxPos = m_gex[k]; m_callWall = m_strikes[k]; } if(m_gex[k] < maxNeg) { maxNeg = m_gex[k]; m_putWall = m_strikes[k]; } } //--- the zero-gamma flip: the spot at which total dealer gamma is zero m_flip = SolveFlip(); PrintFormat("CGexProfile: expiry=%s strikes=%d netGEX=%.3g flip=%.2f callWall=%.2f putWall=%.2f", TimeToString(m_expiry, TIME_DATE), nk, m_netGex, m_flip, m_callWall, m_putWall); return(true); }
After the sum, a single pass over the per-strike array does the rest: it accumulates the net GEX (the headline regime number), tracks the min and max for bar scaling, and records the strikes of the largest positive and most-negative exposure as the call and put walls. The only piece left is the flip, and it earns its own section. The small IndexOf helper both passes use compares strikes with a tolerance rather than for exact equality, so a value that should be the same across two quotes actually matches:
//+------------------------------------------------------------------+
//| Linear search for a strike in the array. Uses a small tolerance  |
//| so float round-trips still match.                                |
//+------------------------------------------------------------------+
int CGexProfile::IndexOf(const double &arr[], const double v) const
  {
   int n = ArraySize(arr);
   for(int i = 0; i < n; i++)
      if(MathAbs(arr[i] - v) < 1e-6)
         return(i);
   return(-1);
  }

Fig. 3. Each contract's gamma is scaled by open interest and the dealer sign, then summed at its strike into the profile
Finding the Zero-Gamma Flip
The walls come straight off the per-strike profile. The flip does not, and it is the more valuable number, so it gets its own treatment. The flip is the price at which the book's total dealer gamma is exactly zero: the boundary between the long-gamma regime above and the short-gamma regime below. To find it we need to know what total dealer gamma would be if the underlying were trading at some hypothetical price, not just at the current spot. That is a different quantity from the per-strike GEX we summed in Build, because every contract's gamma changes as the assumed spot moves.
DealerGammaAtSpot computes it. It is the same signed aggregation as the profile, but with each contract's gamma re-evaluated at the hypothetical spot S, each keeping its own implied volatility. We return raw dealer gamma here, not the spot-squared dollar figure, because for locating a zero crossing only the sign and the crossing matter:
//+------------------------------------------------------------------+
//| Total signed dealer gamma if the underlying were trading at S.   |
//| This is the same aggregation as Build, but with every contract's |
//| gamma re-evaluated at the hypothetical spot S (each keeps its    |
//| own implied volatility). Sweeping S through this function traces |
//| the exposure curve whose zero crossing is the flip level. We     |
//| return raw dealer gamma (not the spot^2-scaled dollar figure),   |
//| because only its sign and zero crossing matter here.             |
//+------------------------------------------------------------------+
double CGexProfile::DealerGammaAtSpot(const double S) const
  {
   datetime now = TimeCurrent();
   if(now == 0)
      now = TimeLocal();

   double total = 0.0;
   int nq = ArraySize(m_quotes);
   for(int i = 0; i < nq; i++)
     {
      double T = (double)(m_quotes[i].expiry - now) / (365.0 * 24 * 3600);
      if(T <= 0.0)
         continue;
      double g = BSGamma(S, m_quotes[i].strike, m_quotes[i].rate, 0.0, m_quotes[i].iv, T);
      double contrib = g * m_quotes[i].open_interest * m_multiplier;
      total += (m_quotes[i].right == OPT_CALL) ? contrib : -contrib;
     }
   return(total);
  }
Sweeping S through that function traces the exposure curve. The flip is its zero crossing. SolveFlip scans a price band around the strikes, widened a little so a flip just outside the quoted range is still caught, and interpolates the first place the sign changes. If dealer gamma never changes sign across the band, the book is wholly long or wholly short gamma and there is no flip; we return a negative sentinel and the renderer simply omits the line:
//+------------------------------------------------------------------+
//| Find the zero-gamma flip by scanning dealer gamma across a price |
//| band around spot and interpolating the first sign change. The    |
//| band spans the strikes we hold, widened a little so a flip just  |
//| outside the quoted strikes is still caught. If dealer gamma      |
//| never changes sign across the band there is no flip (a wholly    |
//| long- or short-gamma book), and we return a negative sentinel.   |
//+------------------------------------------------------------------+
double CGexProfile::SolveFlip(void) const
  {
   int nk = ArraySize(m_strikes);
   if(nk < 2)
      return(-1.0);

   double lo = m_strikes[0];
   double hi = m_strikes[nk - 1];
   double pad = 0.15 * (hi - lo);
   lo -= pad;
   hi += pad;
   if(lo <= 0.0)
      lo = 0.01 * m_strikes[0];

   int    steps = 400;
   double dx    = (hi - lo) / steps;
   double prevS = lo;
   double prevG = DealerGammaAtSpot(lo);
   for(int i = 1; i <= steps; i++)
     {
      double s = lo + i * dx;
      double g = DealerGammaAtSpot(s);
      if((prevG <= 0.0 && g > 0.0) || (prevG >= 0.0 && g < 0.0))
        {
         //--- linear interpolation of the crossing between prevS and s
         double denom = (g - prevG);
         if(MathAbs(denom) < 1e-30)
            return(0.5 * (prevS + s));
         return(prevS - prevG * (s - prevS) / denom);
        }
      prevS = s;
      prevG = g;
     }
   return(-1.0);                          // no sign change: no flip in this band
  }
Four hundred steps across the band is far more resolution than the interpolation needs, but the sweep is cheap and it guarantees we do not step over a narrow crossing. The linear interpolation between the two straddling samples places the flip to well within a fraction of a strike increment, which is all the precision the number carries meaning to.

Fig. 4. Sweeping the assumed spot traces the total-gamma curve; its zero crossing, found by interpolation, is the flip
Two Ways to Feed It: CSV and Native Options
The profile does not care where its quotes come from. That is the point of the OptionQuote struct: anything that can produce an array of them can feed the tool. We ship two producers. The CSV provider reads a chain file and works on any account, including one with no option symbols at all, which makes the tool runnable by everyone. The native provider reads the broker's own MetaTrader 5 option symbols and is the primary path for an options-enabled account.
The CSV Provider
It lives in GexData.mqh and expects a comma-separated file in the terminal's MQL5\Files sandbox with a fixed column order: right, strike, expiry, mid, spot, rate, oi. The right column is C or P, and expiry is a YYYY.MM.DD date. Here is the head of the sample chain shipped with the project, a synthetic index at 5000 with an equity-style skew:
| right | strike | expiry | mid | spot | rate | oi |
|---|---|---|---|---|---|---|
| C | 4500.00 | 2026.09.18 | 626.5680 | 5000.00 | 0.0450 | 106 |
| P | 4500.00 | 2026.09.18 | 86.2497 | 5000.00 | 0.0450 | 545 |
| C | 4550.00 | 2026.09.18 | 581.2828 | 5000.00 | 0.0450 | 138 |
| P | 4550.00 | 2026.09.18 | 90.5165 | 5000.00 | 0.0450 | 631 |
The provider opens the file as an ANSI CSV, reads the seven fields row by row, skips the header line and any blank lines, and for each data row builds an OptionQuote, inverting the mid price to an implied volatility as it reads so the gamma aggregation downstream has a sigma to work with:
//+------------------------------------------------------------------+
//| CSV provider. Reads a chain file from MQL5\Files with columns:   |
//|   right,strike,expiry,mid,spot,rate,oi                           |
//| where right is C/P and expiry is YYYY.MM.DD. Computes the        |
//| implied volatility for each row via Black-Scholes inversion so   |
//| the gamma aggregation downstream has a sigma to work with.       |
//+------------------------------------------------------------------+
class CGexProviderCSV
  {
public:
   bool              Load(const string filename, OptionQuote &out[]);
  };

//+------------------------------------------------------------------+
//| Parse the CSV chain into a flat quote list, inverting each row's |
//| price to an implied volatility as it is read.                    |
//+------------------------------------------------------------------+
bool CGexProviderCSV::Load(const string filename, OptionQuote &out[])
  {
   int h = FileOpen(filename, FILE_READ | FILE_CSV | FILE_ANSI, ',');
   if(h == INVALID_HANDLE)
     {
      PrintFormat("CGexProviderCSV: cannot open %s (err %d)", filename, GetLastError());
      return(false);
     }
   ArrayResize(out, 0);
   bool header = true;
   while(!FileIsEnding(h))
     {
      string sRight  = FileReadString(h);
      if(FileIsLineEnding(h) && StringLen(sRight) == 0)
         continue;
      string sStrike = FileReadString(h);
      string sExpiry = FileReadString(h);
      string sMid    = FileReadString(h);
      string sSpot   = FileReadString(h);
      string sRate   = FileReadString(h);
      string sOi     = FileReadString(h);
      if(header)
        {
         header = false;   // skip the column titles
         continue;
        }
      if(StringLen(sStrike) == 0)
         continue;

      OptionQuote q;
      string rr = sRight;
      StringToUpper(rr);
      q.right         = (StringFind(rr, "P") >= 0) ? OPT_PUT : OPT_CALL;
      q.strike        = StringToDouble(sStrike);
      q.expiry        = StringToTime(sExpiry);
      q.price         = StringToDouble(sMid);
      q.spot          = StringToDouble(sSpot);
      q.rate          = StringToDouble(sRate);
      q.open_interest = StringToDouble(sOi);

      datetime now = TimeCurrent();
      if(now == 0)
         now = TimeLocal();
      double T = (double)(q.expiry - now) / (365.0 * 24 * 3600);
      q.iv = ImpliedVol(q.right, q.price, q.spot, q.strike, q.rate, 0.0, T);

      int s = ArraySize(out);
      ArrayResize(out, s + 1);
      out[s] = q;
     }
   FileClose(h);
   PrintFormat("CGexProviderCSV: loaded %d rows from %s", ArraySize(out), filename);
   return(ArraySize(out) > 0);
  }
The Native Provider
This is the path an options-enabled account uses: point it at an underlying and it builds the chain from the broker's live option symbols. It lives in its own header, GexProviderNative.mqh, and exposes the same Load shape so the indicator can swap providers without caring which it holds. The one field GEX needs beyond an implied-volatility surface is open interest, which the terminal exposes as the SYMBOL_SESSION_INTEREST property. A private helper first decides whether a given symbol is an option at all:
//+------------------------------------------------------------------+
//| A symbol is an option if the server reports an option right for  |
//| it. Brokers that do not support options return an error / zero   |
//| here, so this doubles as the "options available?" test.          |
//+------------------------------------------------------------------+
bool CGexProviderNative::IsOption(const string sym) const
  {
   long right = 0;
   if(!SymbolInfoInteger(sym, SYMBOL_OPTION_RIGHT, right))
      return(false);
//--- options carry a valid strike; use it as a second confirmation
   double strike = SymbolInfoDouble(sym, SYMBOL_OPTION_STRIKE);
   return(strike > 0.0);
  }
The Load method enumerates every symbol the terminal knows about (passing false to SymbolsTotal so it sees the full list, not just Market Watch), keeps the ones that are options on the requested underlying, matched by SYMBOL_BASIS, and turns each into a quote. For each contract it reads the strike, expiry and right, reads the open interest, takes a mid price from the current bid and ask (falling back to last), and sets the implied volatility from the server's SYMBOL_PRICE_VOLATILITY when present or an inversion otherwise. It counts what it found and prints a clear diagnostic. That diagnostic includes the specific case where options matched but none carry open interest, so the reason a profile came out empty is easy to spot:
//+------------------------------------------------------------------+
//| Enumerate all symbols, collect the options on the requested      |
//| underlying, and build one OptionQuote per contract, reading the  |
//| open interest that turns a contract's gamma into a real dealer   |
//| exposure. Contracts whose open interest is zero contribute       |
//| nothing to the profile and are dropped by the aggregation later, |
//| so we keep them here only for completeness of the diagnostic.    |
//+------------------------------------------------------------------+
bool CGexProviderNative::Load(const string underlying, const double rate, OptionQuote &out[])
  {
   ArrayResize(out, 0);
   int total = SymbolsTotal(false);      // false = all symbols, not just Market Watch
   if(total <= 0)
     {
      Print("CGexProviderNative: no symbols available");
      return(false);
     }

   double spot = SymbolInfoDouble(underlying, SYMBOL_BID);
   if(spot <= 0.0)
      spot = SymbolInfoDouble(underlying, SYMBOL_LAST);

   datetime now = TimeCurrent();
   if(now == 0)
      now = TimeLocal();
   int found = 0, withServerIV = 0, withOI = 0;

   for(int i = 0; i < total; i++)
     {
      string sym = SymbolName(i, false);
      if(!IsOption(sym))
         continue;

      //--- match the underlying via SYMBOL_BASIS (the derivative's base asset)
      string basis = SymbolInfoString(sym, SYMBOL_BASIS);
      if(basis != underlying)
         continue;

      //--- make sure the symbol's quotes are available
      SymbolSelect(sym, true);

      OptionQuote q;
      long right = (long)SymbolInfoInteger(sym, SYMBOL_OPTION_RIGHT);
      q.right  = (right == SYMBOL_OPTION_RIGHT_PUT) ? OPT_PUT : OPT_CALL;
      q.strike = SymbolInfoDouble(sym, SYMBOL_OPTION_STRIKE);
      q.expiry = (datetime)SymbolInfoInteger(sym, SYMBOL_EXPIRATION_TIME);
      q.spot   = spot;
      q.rate   = rate;

      //--- open interest: the number of outstanding contracts at this strike
      //--- (SYMBOL_SESSION_INTEREST is a double property, not an integer one)
      q.open_interest = SymbolInfoDouble(sym, SYMBOL_SESSION_INTEREST);
      if(q.open_interest > 0.0)
         withOI++;

      //--- option mid price from the current bid/ask
      double bid = SymbolInfoDouble(sym, SYMBOL_BID);
      double ask = SymbolInfoDouble(sym, SYMBOL_ASK);
      q.price = (bid > 0.0 && ask > 0.0) ? 0.5 * (bid + ask) : SymbolInfoDouble(sym, SYMBOL_LAST);

      //--- prefer the server-computed implied volatility if present
      double serverVol = SymbolInfoDouble(sym, SYMBOL_PRICE_VOLATILITY);
      double T = (double)(q.expiry - now) / (365.0 * 24 * 3600);
      if(serverVol > 0.0)
        { q.iv = serverVol / 100.0; withServerIV++; }    // property is a percentage
      else
         q.iv = ImpliedVol(q.right, q.price, q.spot, q.strike, q.rate, 0.0, T);

      int s = ArraySize(out);
      ArrayResize(out, s + 1);
      out[s] = q;
      found++;
     }

   PrintFormat("CGexProviderNative: underlying=%s spot=%.4f  options found=%d  server IV on %d  with OI %d",
               underlying, spot, found, withServerIV, withOI);
   if(found == 0)
      Print("CGexProviderNative: no option symbols matched. This account/broker may not offer options, or the underlying name differs from SYMBOL_BASIS.");
   else
      if(withOI == 0)
         Print("CGexProviderNative: options matched but none carry open interest; GEX needs OI, so the profile will be empty. Use the CSV source to demonstrate the tool.");
   return(found > 0);
  }
Both providers end at the same place: an array of OptionQuote with implied volatilities and open interest filled in. Hand either one to CGexProfile::Build and you get the same profile. That interchangeability is what keeps the renderer, the largest piece, completely ignorant of where the numbers came from.
Drawing the Map on the Chart
Everything so far produces a profile of numbers. The indicator, GexMap.mq5, turns that profile into a map on the chart using MetaTrader's 2D CCanvas. It draws nothing on the price series itself, so it declares zero plots and buffers and runs in the chart window as a full-chart bitmap overlay:
#property indicator_chart_window
#property indicator_plots   0
#property indicator_buffers 0

#include <Canvas/Canvas.mqh>
#include <GEX/GexData.mqh>
#include <GEX/GexProviderNative.mqh>
The inputs let the user pick the data source, configure the native path, set the contract multiplier, and choose how the profile is scaled vertically, which is the one design decision worth dwelling on:
input ENUM_GEX_SOURCE InpSource     = GEX_SOURCE_CSV;              // data source
input string          InpCsvFile    = "GEX\\gex_chain_sample.csv"; // CSV chain (in MQL5\Files)
input string          InpUnderlying = "";                         // native: base symbol (empty = chart symbol)
input double          InpRiskFree   = 0.045;                      // risk-free rate for the inversion
input double          InpMultiplier = 100.0;                      // contract multiplier (100 = US equity options)
input int             InpRefreshSec = 0;                          // native re-poll seconds (0 = manual, press R)
input int             InpProfileW   = 260;                        // profile width in pixels (right margin)
input ENUM_GEX_SCALE  InpScaleMode  = GEX_SCALE_OWN;              // vertical scale: own band, or snap to price axis
input double          InpFillPct    = 0.80;                       // own scale: fraction of chart height to fill
input ENUM_GEX_THEME  InpTheme      = GEX_THEME_DARK;             // label/bar theme
Two Ways to Place the Bars Vertically
A GEX map ideally sits on the price axis, so the call wall at a given strike lines up with that price on the chart, exactly the way a volume profile does. That alignment only works when the chart's instrument is the chain's underlying. With a synthetic index chain on, say, a EURUSD chart, the strikes near 5000 are nowhere near the chart's price range, and axis-aligned bars would all fall off-screen. So the tool offers two modes through InpScaleMode, and everything downstream, bars, walls, spot, flip, routes through one function, PriceY, which is the single place the mode is decided:
//+------------------------------------------------------------------+
//| Map a price to a y pixel, either by snapping to the chart's real |
//| price axis (SNAP mode, for a same-underlying chart) or across    |
//| the tool's own centred band (OWN mode, which is always visible   |
//| regardless of the chart symbol). Returns false when the price    |
//| falls off-screen so callers simply skip that level.              |
//+------------------------------------------------------------------+
bool PriceY(const double price, int &y)
  {
   if(InpScaleMode == GEX_SCALE_SNAP)
     {
      int x = 0, sub = 0;
      datetime t = TimeCurrent();        // any visible time works; only y is used
      if(!ChartTimePriceToXY(0, sub, t, price, x, y))
         return(false);
      int h = (int)ChartGetInteger(0, CHART_HEIGHT_IN_PIXELS, 0);
      if(y < -50 || y > h + 50)
         return(false);                  // well off-screen: don't draw it
      return(true);
     }

//--- own scale: linear map of the strike band onto [g_bandTop, g_bandBot]
   if(g_bandHi <= g_bandLo)
      return(false);
   double f = (price - g_bandLo) / (g_bandHi - g_bandLo);   // 0 at bandLo, 1 at bandHi
   if(f < -0.02 || f > 1.02)
      return(false);                     // outside the padded band
   y = (int)MathRound(g_bandBot - f * (g_bandBot - g_bandTop));
   return(true);
  }
SNAP mode asks the chart for the real pixel of a price through ChartTimePriceToXY, so the bars land on the chart's own axis, correct for a same-underlying chart. OWN mode maps the strike range onto a centred band covering a fraction of the chart height, so the profile is a self-contained gauge that is always visible on any chart, which is the right default for the synthetic data most readers will run. SetupBand establishes that band once per draw, padded slightly beyond the outermost strikes so spot and flip lines just outside the quoted range still land inside it:
//+------------------------------------------------------------------+
//| Set up the own-scale band: map the strike range onto a centred   |
//| vertical span covering InpFillPct of the chart height. Padded a  |
//| little beyond the strikes so spot/flip lines that sit just       |
//| outside the outermost strikes still land inside the band. Called |
//| once per draw before any PriceY() query in own-scale mode.       |
//+------------------------------------------------------------------+
void SetupBand(void)
  {
   int    H  = g_canvas.Height();
   int    nk = g_profile.NStrikes();
   double lo = g_profile.Strike(0);
   double hi = g_profile.Strike(nk - 1);
   double pad = 0.06 * (hi - lo);
   g_bandLo = lo - pad;
   g_bandHi = hi + pad;

   double fill = MathMax(0.3, MathMin(0.95, InpFillPct));
   int span = (int)(H * fill);
   g_bandTop = (H - span) / 2;            // centred vertically
   g_bandBot = g_bandTop + span;
  }
Drawing the Profile
With the price-to-pixel mapping settled, the draw itself is straightforward. DrawMap clears the canvas to fully transparent so the chart shows through, sets up the band in own-scale mode, and lays out the right-margin geometry: bars anchor at the right edge and grow leftward, with the strike labels to their left. In own-scale mode it backs the band with a faint panel so the profile reads as a self-contained gauge rather than bars floating over the candles, and draws the vertical zero line the bars grow from. Then it walks the strikes, drawing each bar with a length proportional to its share of the largest absolute exposure and coloured green for positive dealer gamma or red for negative. The excerpt below is the core of that loop:
//--- per-strike bars at real price levels
   g_canvas.FontSet("Segoe UI", 14);
   for(int i = 0; i < nk; i++)
     {
      int y;
      if(!PriceY(g_profile.Strike(i), y))
         continue;
      double gex = g_profile.Gex(i);
      int    len = (int)MathRound(maxLen * (MathAbs(gex) / maxAbs));
      uint   clr = (gex >= 0.0) ? g_pos : g_neg;
      g_canvas.FillRectangle(baseX - len, y - barH, baseX, y + barH, clr);
      //--- strike label just left of the profile
      g_canvas.TextOut(labelX, y - 10, StringFormat("%.0f", g_profile.Strike(i)), g_textDim, TA_RIGHT);
     }
The reference lines follow. Spot, flip, and the two walls each draw as a plain horizontal line across the profile band at their price level, with no caption on the line itself, kept clean deliberately; a small colour key in the title card names them instead. The lines route through the same PriceY, so a level off the band is simply skipped:
//--- reference lines drawn across the profile band at their true prices
//--- (unlabelled: the colour key in the title card identifies them)
   int lineX0 = labelX - 40;
   DrawLevel(g_profile.Spot(), lineX0, baseX, g_spot);
   if(g_profile.Flip() > 0.0)
      DrawLevel(g_profile.Flip(), lineX0, baseX, g_flip);
   DrawLevel(g_profile.CallWall(), lineX0, baseX, g_wall);
   DrawLevel(g_profile.PutWall(),  lineX0, baseX, g_wall);
The title card, top-left on an opaque panel, carries the heading, the net-GEX regime verdict coloured green or red, and the colour key. The verdict line is where the profile's single most useful reading is stated in words:
//--- title / regime card, top-left
   double net = g_profile.NetGex();
   string underName = (InpSource == GEX_SOURCE_NATIVE && InpUnderlying != "") ? InpUnderlying : _Symbol;
   string line1 = StringFormat("Gamma Exposure  -  %s  -  exp %s",
                               underName, TimeToString(g_profile.Expiry(), TIME_DATE));
   string regime = (net >= 0.0) ? "NET LONG GAMMA (mean-reverting)" : "NET SHORT GAMMA (trending)";
   string line2 = StringFormat("%s    net GEX %.3g    flip %s",
                               regime, net,
                               (g_profile.Flip() > 0.0 ? StringFormat("%.2f", g_profile.Flip()) : "none"));
   DrawTitleTwo(line1, line2, (net >= 0.0) ? g_pos : g_neg);
Keeping It Steady
A full-chart bitmap has one trap: rebuilt on every chart event, it flickers when you scroll. The fix splits two concerns. The bitmap is only rebuilt when the chart's pixel size actually changes, which RebuildIfResized detects by caching the last size; a plain scroll keeps the same bitmap. The redraw, on the other hand, does run on every chart change, because in snap mode the price-to-pixel mapping shifts when you scroll or scale and the bars must follow. The chart-event handler ties the two together:
void OnChartEvent(const int id, const long &lparam, const double &dparam, const string &sparam)
  {
   if(id == CHARTEVENT_KEYDOWN)
     {
      if((int)lparam == 'R' || (int)lparam == 'r')
        {
         Reload();
         DrawMap();
        }
     }
   else
      if(id == CHARTEVENT_CHART_CHANGE)
        {
         RebuildIfResized();   // only rebuilds the bitmap on a real size change
         DrawMap();            // always redraw: the price axis may have moved
        }
  }
The R key reloads the data source and redraws, so a refreshed CSV or a re-polled native chain is one keypress away. For the native source, a timer re-polls on the configured interval and redraws only when fresh data actually arrived, since the profile is static between reloads and there is nothing to gain from redrawing on every tick.
Running the Tool
Compile GexMap.mq5 and it appears under the project's GEX folder in the Navigator. Drop the sample gex_chain_sample.csv into the terminal's MQL5\Files\GEX folder (the path InpCsvFile defaults to), attach the indicator to any chart, and with the default inputs (InpSource = GEX_SOURCE_CSV, InpScaleMode = GEX_SCALE_OWN) it reads that chain and draws immediately. There is no dependency on having an options account: the CSV path in own-scale mode is the "works on any chart" path, and it is the fastest way to see the whole pipeline end to end.
For live data, set InpSource to GEX_SOURCE_NATIVE and put your underlying's base symbol in InpUnderlying (leave it empty to use the chart symbol), then set InpRiskFree and InpMultiplier to sensible values for the instrument. On an options-enabled account the provider enumerates the option symbols, matches them to the underlying by SYMBOL_BASIS, reads their open interest, and builds the profile from live data. If the chart symbol is the underlying, switch InpScaleMode to GEX_SCALE_SNAP to pin the bars to the real price axis. Press R at any time to reload.
The animation below shows the finished tool on the sample chain.
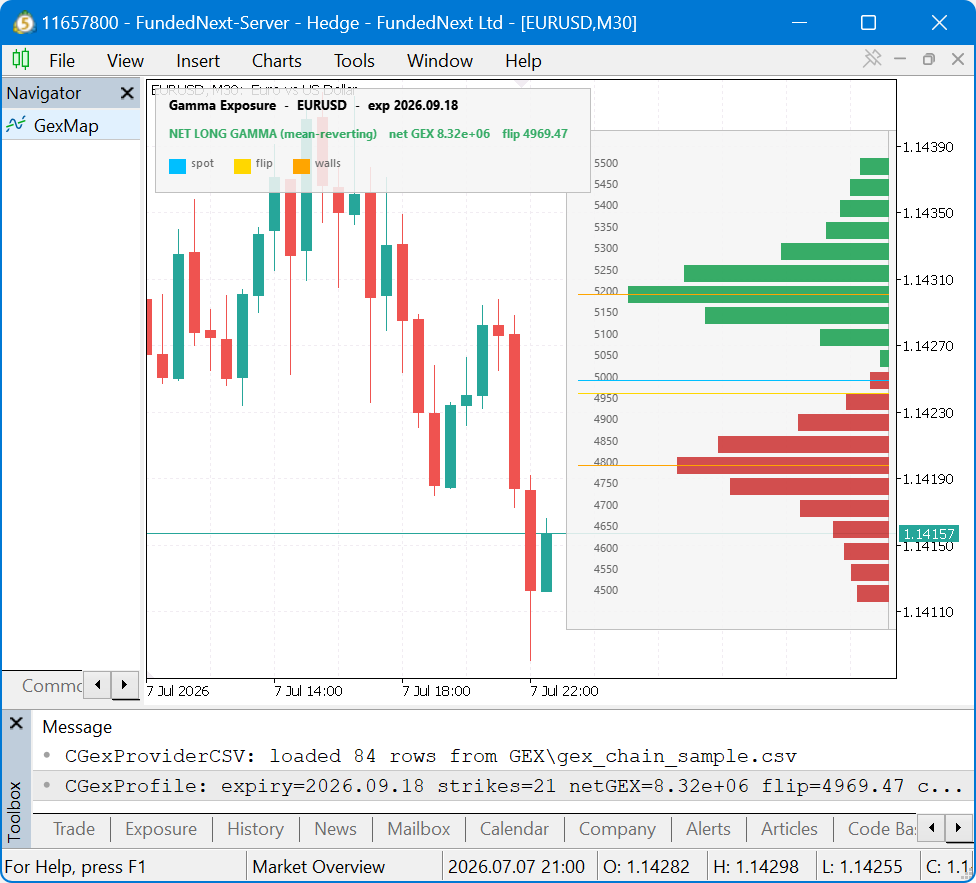
Fig. 5. The finished tool: the GEX profile in the right margin with the call/put walls, spot and flip lines, and the regime card
Reading the result is the exercise the whole tool exists for. On the sample chain, spot is 5000, and the profile shows a clean structure: a red, dealer-short-gamma block below spot deepening to a put wall at 4800, and a green, dealer-long-gamma block above spot peaking at a call wall at 5200. The sign of the per-strike exposure flips right around spot, and the solver places the zero-gamma flip just below 5000. The card reads NET LONG GAMMA (mean-reverting) because the aggregate net GEX is positive. Put together, that is a specific, actionable picture: with spot sitting above the flip in positive-gamma territory, the regime is the mean-reverting one, and the walls at 4800 and 5200 are the levels dealer hedging will tend to defend. Feed the same tool a chain where spot sits below the flip and the card turns red and reads trending, the opposite regime, at a glance.
Conclusion
We set out to build a dealer-positioning map for MetaTrader 5, and we built it end to end, walking every part.
- The numerics. A compact, stateless Black-Scholes core with an Abramowitz & Stegun normal CDF, a robust Newton-with-bisection implied-volatility inversion, and the gamma function the whole tool rests on.
- The aggregation. A single-expiry profile that sums each contract's dollar gamma, weighted by open interest and signed by the dealer convention, into one number per strike, then reads off the net-GEX regime and the call and put walls.
- The flip. A sweep of the assumed spot through the total-gamma curve, with the zero crossing located by interpolation, giving the single most useful number the map carries: the boundary between the mean-reverting and trending regimes.
- The data and the renderer. Two interchangeable providers, a CSV reader that runs on any account and a native reader that pulls open interest from the broker's option symbols, feeding a 2D canvas overlay that draws the profile on the chart in either its own scale or snapped to the real price axis.
The tool is deliberately a positioning map, not a pricing model, and it states its assumptions explicitly. The dealer sign convention (short calls, long puts) is the standard one but it is an assumption, not measured order flow. The profile is a single expiry, not the whole chain. Open interest on many feeds is a prior-day figure, and the sample chain's open interest is synthetic, so the sample's levels illustrate the mechanic rather than a live market. And the map covers gamma only, not the vanna and charm flows that also move dealer hedging. Each of those is a natural next step: aggregating across expiries, adding a vanna or charm overlay, or wiring the flip level into an Expert Advisor as a regime filter. The architecture is built to absorb them, because the renderer only ever talks to the profile through its public accessors, so a richer model slots in without touching the graphics.
Getting the Source Code via MQL5 Algo Forge
All source files are attached to this article below, but the full repository is also available on MQL5 Algo Forge, the community's Git-based platform for sharing and collaborating on trading projects.
| File name | Description |
|---|---|
| MQL5\Include\GEX\BlackScholes.mqh | Black-Scholes pricing (call/put with carry), normal CDF/PDF, vega, gamma, and the Newton-Raphson-with-bisection implied-volatility inversion |
| MQL5\Include\GEX\GexData.mqh | The OptionQuote struct, the CGexProfile aggregator (per-strike GEX, walls, and the zero-gamma flip solver), and the CSV chain provider |
| MQL5\Include\GEX\GexProviderNative.mqh | Native MetaTrader 5 option-symbol provider: enumerates symbols, matches the underlying by SYMBOL_BASIS, and reads open interest via SYMBOL_SESSION_INTEREST |
| MQL5\Indicators\GEX\GexMap.mq5 | The 2D canvas indicator: per-strike bars, call/put walls, spot and flip lines, the regime card, and the own-scale / snap-to-axis vertical modes |
| MQL5\Files\GEX\gex_chain_sample.csv | Sample option chain (spot 5000, strikes 4500-5500, two expiries) that renders a clean call wall, put wall, and flip with no options account required |
Warning: All rights to these materials are reserved by MetaQuotes Ltd. Copying or reprinting of these materials in whole or in part is prohibited.
This article was written by a user of the site and reflects their personal views. MetaQuotes Ltd is not responsible for the accuracy of the information presented, nor for any consequences resulting from the use of the solutions, strategies or recommendations described.

 The MQL5 Standard Library Explorer (Part 14): Building a Dynamic Hedge EA with the ALGLIB Port (ap.mqh)
 Constructing a Trade Replay Engine in MQL5: Stepping Through Historical Trades Bar by Bar for Manual Review
 Broker Reality Check (Part 1): Why Your EA Works on a Demo and Breaks on a Client's Broker
 Dingo Optimization Algorithm (DOA)

- Free trading apps
- Over 8,000 signals for copying
- Economic news for exploring financial markets
You agree to website policy and terms of use
Hello, friend. Thanks for the great work. I’d like to ask for some help, as I haven't been able to use it with Brazilian assets (B3). I'm not using a CSV file; instead, I'm using the broker's native data. Even though the options are there, it says it can't find them!
I also thought it might be happening because the market was closed, but I tested it today while the market was active, and it still couldn't read directly from the broker!
Yes, I made those changes.
I also thought it might be happening because the market was closed, but I tested it today while the market was active, and it still couldn't read directly from the broker!
To confirm, run the attached GexOIProbe script on a PETR4 chart during the session. It only reads data and ends with a one-line verdict. Please paste the output here.
If there's no OI in the feed, use the CSV source. B3 publishes open positions for equity options every day, so you can build the chain file (`right,strike,expiry,mid,spot,rate,oi`) from that and put it in `MQL5\Files`.
Para confirmar, execute o script GexOIProbe em anexo em um gráfico PETR4 durante a sessão. Ele apenas lê os dados e termina com um veredito de uma linha. Cole a saída aqui.
Se não houver OI no feed, use uma fonte CSV. A B3 publica posições em aberto para opções de ações todos os dias, então você pode construir o arquivo de cadeia (`right,strike,expiry,mid,spot,rate,oi`) a partir disso e colocá-lo em `MQL5\Files`.
Script return: 2026.10.05 13:12:37.372 GexOIProbe (PETR4,D1) GexOIProbe: session volume/deals arrive but open interest is 0 on every option: the broker's feed does not carry OI. Use the CSV source.
Really.
Script return: 2026.10.05 13:12:37.372 GexOIProbe (PETR4,D1) GexOIProbe: session volume/deals arrive but open interest is 0 on every option: the broker's feed does not carry OI. Use the CSV source.