Discussing the article: "Mapping Dealer Gamma Exposure (GEX) in MetaTrader 5: Walls, the Zero-Gamma Flip, and a Chart Overlay"
Hello, friend. Thanks for the great work. I’d like to ask for some help, as I haven't been able to use it with Brazilian assets (B3). I'm not using a CSV file; instead, I'm using the broker's native data. Even though the options are there, it says it can't find them!
2026.09.26 15:58:25.136 GexMap (PETR4,D1) CGexProviderNative: underlying=PETR4 spot=47.9300 options found=3556 server IV on 0 with OI 0
Can you help me with this? Hello, friend. Thanks for the great work. I’d like to ask for some help, as I haven't been able to use it with Brazilian assets (B3). I'm not using a CSV file; instead, I'm using the broker's native data. Even though the options are there, it says it can't find them!
- Run it during B3 trading hours (your log is from a Saturday, when session data like OI may read as zero).
- After attaching, wait a few seconds and press R to reload, or set InpRefreshSec to e.g. 30. The first read can happen before the terminal has received data for option symbols that weren't in Market Watch yet.
- If OI is still 0, open the Specification of one liquid PETR4 option and see whether your broker shows open interest at all. Some brokers don't publish it for stock options, and then only the CSV source will work.
- Run it during B3 trading hours (your log is from a Saturday, when session data like OI may read as zero).
- After attaching, wait a few seconds and press R to reload, or set InpRefreshSec to e.g. 30. The first read can happen before the terminal has received data for option symbols that weren't in Market Watch yet.
- If OI is still 0, open the Specification of one liquid PETR4 option and see whether your broker shows open interest at all. Some brokers don't publish it for stock options, and then only the CSV source will work.
I also thought it might be happening because the market was closed, but I tested it today while the market was active, and it still couldn't read directly from the broker!
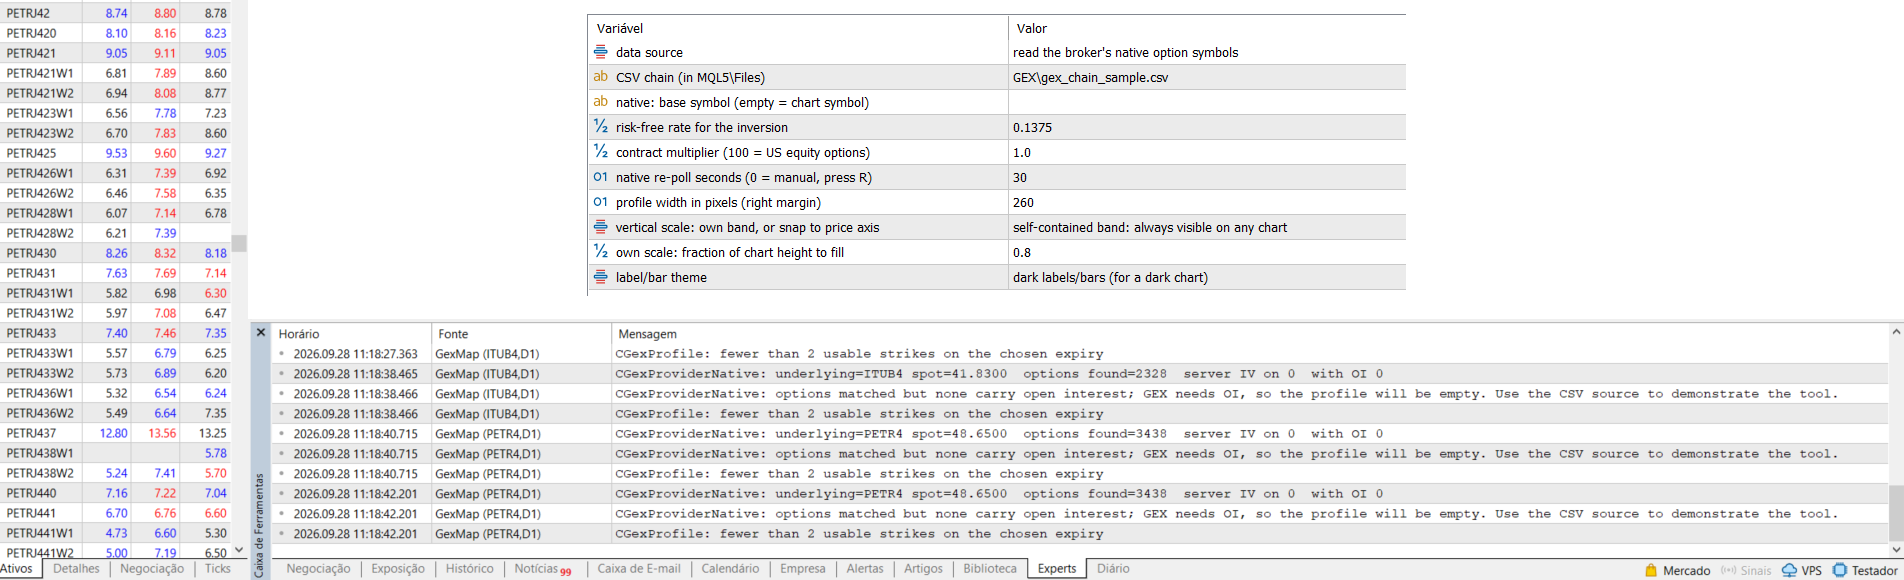
Yes, I made those changes.
I also thought it might be happening because the market was closed, but I tested it today while the market was active, and it still couldn't read directly from the broker!
To confirm, run the attached GexOIProbe script on a PETR4 chart during the session. It only reads data and ends with a one-line verdict. Please paste the output here.
If there's no OI in the feed, use the CSV source. B3 publishes open positions for equity options every day, so you can build the chain file (`right,strike,expiry,mid,spot,rate,oi`) from that and put it in `MQL5\Files`.
Para confirmar, execute o script GexOIProbe em anexo em um gráfico PETR4 durante a sessão. Ele apenas lê os dados e termina com um veredito de uma linha. Cole a saída aqui.
Se não houver OI no feed, use uma fonte CSV. A B3 publica posições em aberto para opções de ações todos os dias, então você pode construir o arquivo de cadeia (`right,strike,expiry,mid,spot,rate,oi`) a partir disso e colocá-lo em `MQL5\Files`.
Script return: 2026.10.05 13:12:37.372 GexOIProbe (PETR4,D1) GexOIProbe: session volume/deals arrive but open interest is 0 on every option: the broker's feed does not carry OI. Use the CSV source.

- Free trading apps
- Over 8,000 signals for copying
- Economic news for exploring financial markets
You agree to website policy and terms of use
Check out the new article: Mapping Dealer Gamma Exposure (GEX) in MetaTrader 5: Walls, the Zero-Gamma Flip, and a Chart Overlay.
In this article we build a dealer gamma-exposure map in MQL5. From an option chain, the tool computes per-strike GEX, finds the call and put walls, and solves for the zero-gamma flip that separates a mean-reverting regime from a trending one, then draws it all on the chart. CSV and native-symbol data paths included.
Start with the party on the other side of your option trade. When you buy a call, a market maker sells it, and they do not want the directional risk. They hedge it away by holding delta of the underlying, and they keep re-hedging as price moves, because the option's delta changes as price moves. The rate at which delta changes is gamma. Gamma is what forces the dealer to trade the underlying continuously to stay hedged, and the direction of that forced trading is the whole story.
If the dealer is long gamma, their hedge is stabilising: as price rises their delta grows, so they sell the underlying into the rise; as price falls their delta shrinks, so they buy into the fall. They lean against the move. Concentrated across a whole book, long-gamma hedging suppresses volatility and manufactures the mean reversion you see when a market pins to a level. If the dealer is short gamma, everything inverts: they must buy as price rises and sell as it falls, chasing the move, adding fuel. Short-gamma hedging amplifies volatility and turns ordinary moves into trends and squeezes.
The convention this tool follows is the standard one used by every public GEX model. Customers are net long the options they buy, so dealers are net short calls and long puts against them. We treat a call's gamma as a positive contribution to dealer exposure and a put's as a negative one. It is an assumption, not a measured fact, and we say so plainly later. But it is the assumption that makes the numbers line up with observed behaviour, and it is what lets us turn a chain into a single signed profile.
Two things fall out of that profile and they are what a trader actually reads. The first is the pair of walls: the strike with the largest positive exposure (the call wall, which tends to act as a ceiling because dealer selling intensifies there) and the strike with the largest negative exposure (the put wall, a floor for the mirror reason). The second, and more important, level is the zero-gamma flip: the price at which the book's total gamma is exactly zero. Above the flip the aggregate dealer position is typically long gamma, so the regime is mean-reverting and moves get faded; below it the position flips short, so the regime is trending and moves get chased. Where spot sits relative to the flip is a one-glance read on which of those two worlds you are trading in.
Author: Muhammad Minhas Qamar