
Price Action Analysis Toolkit Development (Part 62): Building an Adaptive Parallel Channel Detection and Breakout System in MQL5

Contents
- Introduction
- Parallel Channels and Structural Breakouts
- System Architecture in MQL5
- Testing and Outcomes
- Conclusion
Introduction
In the previous part of this series, we explored a trendline breakout framework validated through three swing points. Testing showed that the approach effectively flagged clear breakout opportunities. However, one limitation became apparent: the system only captured breakouts in the direction of the trendlines being constructed. This meant that if price movement occurred in the opposite direction or on the unmonitored side, those breakout structures would go unnoticed.
This article extends that approach by introducing an adaptive parallel channel detection and breakout system. The system constructs channels based on swing points, monitors price action within these channels, and confirms breakouts dynamically. By tracking both sides of the channel, the framework ensures no significant movement is missed.
The focus is on combining trendline geometry, adaptive recalculation, and real-time validation to provide a robust price action toolkit for MQL5 users. This system also lays the groundwork for future enhancements, such as integrating volatility filters, ATR-based adjustments, and advanced breakout confirmation methods.
Parallel Channels and Structural Breakouts
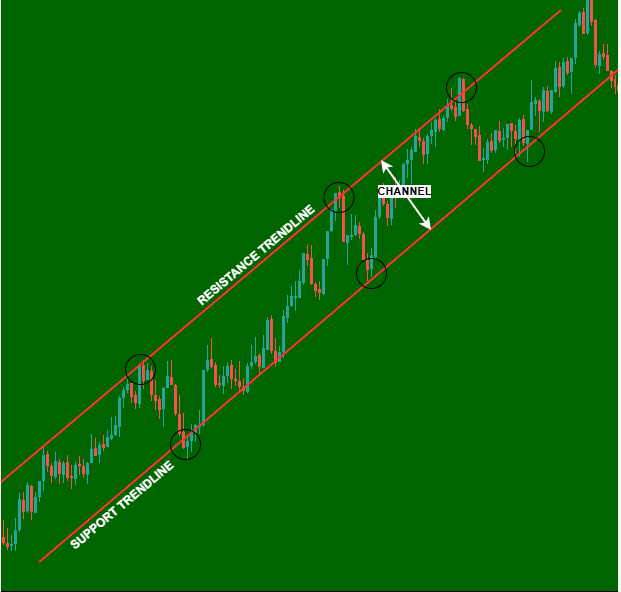
A parallel channel is a chart pattern formed by two equidistant trendlines—one connecting swing highs and the other connecting swing lows—that encapsulate price action within a structured range. Parallel channels are foundational in technical analysis because they illustrate the market's short- and medium-term bias while allowing traders to anticipate potential breakout zones.
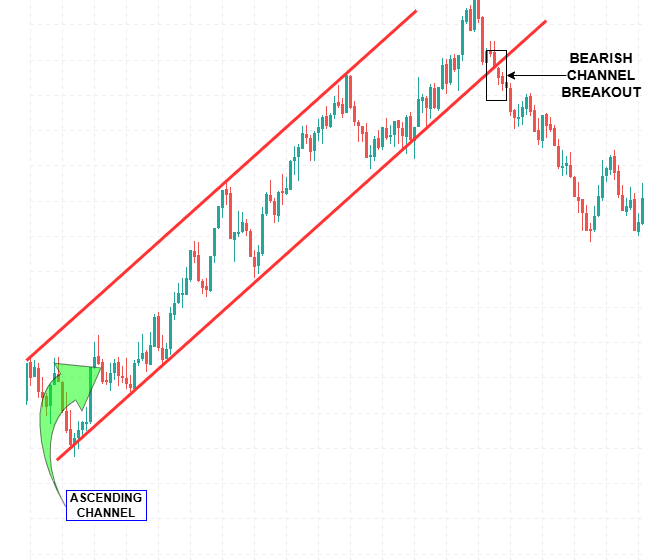
Breakouts occur when price moves decisively beyond the channel boundaries, either upward or downward. Structural breakouts are particularly significant because they often signal the continuation or reversal of a prevailing trend. Capturing these breakouts reliably requires both accurate channel construction and real-time confirmation mechanisms.
Trendline-Based Channel Construction
The foundation of the system lies in the accurate identification of structurally meaningful swing highs and swing lows. Rather than relying on every minor fluctuation, the detection process incorporates ATR-based filtering to eliminate insignificant price movements. This ensures that only swings with sufficient displacement are considered, reducing noise and preserving structural integrity.
Once validated swing points are identified, the upper boundary of the channel is constructed by connecting consecutive swing highs. This line establishes the directional geometry of the structure. A corresponding lower boundary is then projected in parallel, using an equidistant offset derived from the swing relationships. The result is a geometrically consistent parallel channel that reflects actual market structure rather than arbitrary drawing.
The use of true parallel projection is critical. Instead of independently fitting two unrelated lines, the system enforces slope consistency between boundaries. This preserves symmetry and ensures that the channel represents a coherent containment structure. As new swing points form, the channel is recalculated. This continuous structural alignment allows the framework to remain synchronized with live price behavior while maintaining geometric validity.
Structural Breakout Identification
A breakout is recognized when price closes beyond one of the channel boundaries. However, not every boundary violation qualifies as a valid signal. To avoid false triggers caused by minor spikes or liquidity sweeps, breakout confirmation incorporates minimum threshold requirements.
The primary confirmation rule requires a decisive candle close outside the boundary. Optional filters can be applied to strengthen validation, including volatility-based thresholds that ensure sufficient expansion relative to recent price behavior. Retest validation provides an additional layer of confirmation. After an initial boundary break, price may temporarily return to test the breached level. If price respects this level and resumes movement in the breakout direction, the signal gains structural credibility. This mechanism reduces premature entries and filters weak momentum moves.
Once confirmed, breakout events are marked with non-repainting arrows. These markers are permanently stored on the chart, ensuring that historical signals remain visible for analysis and review. This separation between adaptive channel recalculation and persistent signal storage is essential for maintaining analytical reliability.
Adaptive Behavior and Live Recalculation
Financial markets are dynamic, and any structural tool must adapt accordingly. For this reason, channel construction is recalculated as new price data becomes available. The system operates on completed bars to maintain consistency and prevent instability in live conditions.
Each recalculation reassesses swing validity, reconstructs channel geometry if necessary, and re-evaluates breakout conditions against the updated structure. If the previous channel remains structurally valid, it is maintained. If emerging price behavior invalidates it, a new structure is derived. Breakout conditions are also continuously validated against the evolving channel. This prevents premature signals while ensuring that meaningful structural shifts are not missed. By monitoring both upper and lower boundaries simultaneously, the system avoids directional bias. Upward and downward movements are treated with equal scrutiny, providing a complete structural view of price action rather than a single-sided interpretation.
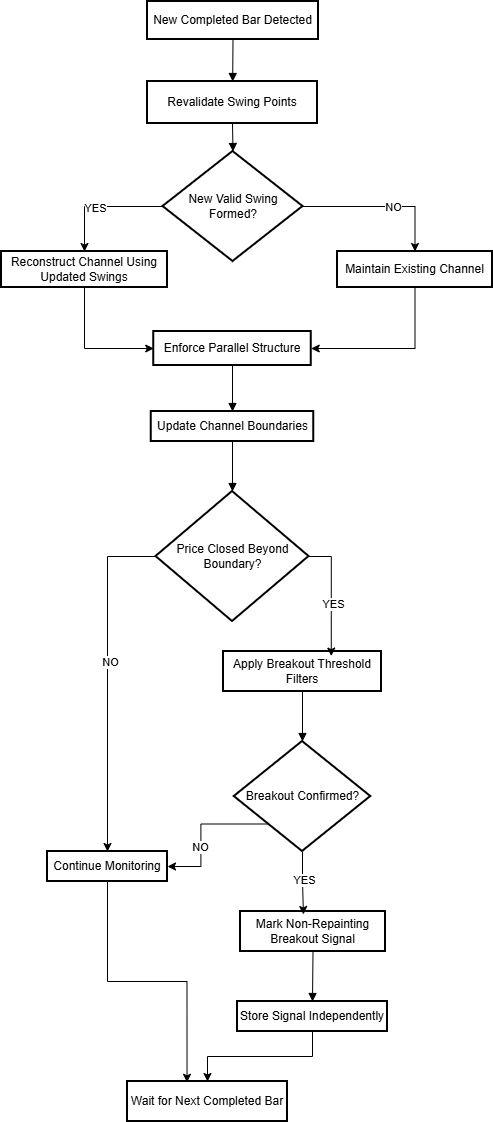
This adaptive framework allows the system to function as a live structural scanner—responsive to market changes while preserving signal integrity.
System Architecture in MQL5
System Overview
This section describes the internal organization of the Expert Advisor (EA), illustrating how its components are modularly structured, how they interact, and the data flow that transforms raw market data into validated breakout signals. The architecture emphasizes clarity, maintainability, and robustness, enabling precise analysis and flexible customization. The EA follows a highly modular, event-driven design optimized for MetaTrader 5, where each component operates independently with a specific responsibility, yet communicates seamlessly with others, ensuring a cohesive system.
The system operates on every new bar, reconstructing a parallel channel based on recent swing points—significant market turning points—then validating whether this structure meets all predefined criteria. The validation process involves multiple filters, including slope consistency, touch frequency, recency, and volatility conditions, all normalized through a 14-period ATR. This normalization ensures that the system remains consistent across different symbols and timeframes, adapting automatically to market volatility. Once a reliable channel is identified, it is visualized on the chart with clear, extendable trendlines and labels, providing traders with immediate visual context. Subsequently, the system evaluates whether recent price action signals a breakout—an event that might trigger a trade—by projecting the channel lines into real-time data, applying multiple authenticity filters to confirm the breakout's legitimacy, and managing signals in a way that reduces false positives.
Modular Components and Responsibilities
Swing Point Detection Module
Responsible for analyzing raw price data to locate significant local highs and lows, which form the structural foundation for the entire analysis. It scans recent price bars within a configurable range—typically the last 150 bars—and applies fractal logic to identify peaks and troughs that stand out from neighboring points. This involves checking whether a bar’s high or low exceeds or falls below the surrounding bars within a lookback period (SwingLookback). To avoid reacting to minor fluctuations, an optional ATR filter can be enabled to only consider swings exceeding a volatility-dependent minimum size (SwingSizeATRFactor). Detected swing points are stored in dedicated arrays, sorted chronologically, and assigned order numbers, which facilitate their referencing in subsequent modules. These swing points can be visually marked with arrows and labels, which helps traders interpret the current market structure at a glance.
//+------------------------------------------------------------------+
//| Detect significant swing highs and lows                          |
//+------------------------------------------------------------------+
void FindSignificantSwings(const MqlRates &rates[],int totalBars,
                           SwingPoint &highs[],int &highCount,
                           SwingPoint &lows[],int &lowCount)
  {
   highCount = 0;
   lowCount = 0;
   double minSize = UseATRFiltering ? currentATR * SwingSizeATRFactor : MinSwingSize;

   for(int i = SwingLookback; i < totalBars - SwingLookback; i++)
     {
      //--- Detect Swing High
      bool isHigh = true;
      double currentHigh = rates[i].high;
      for(int j=1; j<=SwingLookback; j++)
        {
         if(rates[i-j].high >= currentHigh || rates[i+j].high >= currentHigh)
           {
            isHigh = false;
            break;
           }
        }
      if(isHigh)
        {
         double leftLow  = MathMin(rates[i-1].low,rates[i-2].low);
         double rightLow = MathMin(rates[i+1].low,rates[i+2].low);
         double swingSize = currentHigh - MathMax(leftLow,rightLow);
         if(swingSize >= minSize && highCount < 50)
           {
            highs[highCount].time = rates[i].time;
            highs[highCount].price = currentHigh;
            highs[highCount].barIndex = i;
            highs[highCount].size = swingSize;
            highs[highCount].isHigh = true;
            highCount++;
           }
        }

      //--- Detect Swing Low
      bool isLow = true;
      double currentLow = rates[i].low;
      for(int j=1; j<=SwingLookback; j++)
        {
         if(rates[i-j].low <= currentLow || rates[i+j].low <= currentLow)
           {
            isLow = false;
            break;
           }
        }
      if(isLow)
        {
         double leftHigh  = MathMax(rates[i-1].high,rates[i-2].high);
         double rightHigh = MathMax(rates[i+1].high,rates[i+2].high);
         double swingSize = MathMin(leftHigh,rightHigh) - currentLow;
         if(swingSize >= minSize && lowCount < 50)
           {
            lows[lowCount].time = rates[i].time;
            lows[lowCount].price = currentLow;
            lows[lowCount].barIndex = i;
            lows[lowCount].size = swingSize;
            lows[lowCount].isHigh = false;
            lowCount++;
           }
        }
     }
   if(DebugMode)
      Print("Swings found: Highs=",highCount," Lows=",lowCount);
  }
//+------------------------------------------------------------------+
Channel Construction & Scoring Engine
This core module performs an exhaustive search over all combinations of high and low swing points to find the most reliable, structurally sound parallel channel. It evaluates each candidate based on multiple criteria, including slope similarity and width, applying early rejection filters such as MaxSlopeDifference and MinChannelWidthATR. For each candidate, it counts touches on the upper and lower trendlines using the enhanced CountTouchesOnLine() function, which considers only swings on or near the lines within a tolerance and relevant to the line’s position.
Touch counts are a critical measure of how well the candidate fits the recent market structure. The scoring combines total touch counts, recency bonuses, and strength indicators based on how many recent swings interact with the lines. The candidate with the highest score that meets all minimum criteria is selected as the best-fit channel, representing the most significant support or resistance area in recent market behavior.
//+------------------------------------------------------------------+
//| Find the best parallel channel from swing points                 |
//+------------------------------------------------------------------+
bool FindBestChannel(const SwingPoint &highs[],int highCount,
                     const SwingPoint &lows[],int lowCount,
                     const MqlRates &rates[],int totalBars,
                     Channel &bestChannel)
  {
   bestChannel.score = 0.0;
   if(highCount < 2 || lowCount < 2)
     {
      if(DebugMode)
         Print("Not enough swings: highs=",highCount," lows=",lowCount);
      return false;
     }

   double tolerance = TouchToleranceATR * currentATR;

   for(int hi1=0; hi1<highCount-1; hi1++)
     {
      for(int hi2=hi1+1; hi2<highCount; hi2++)
        {
         double dt_high = (double)(highs[hi2].time - highs[hi1].time);
         if(dt_high <= 0)
            continue;
         double slope_high = (highs[hi2].price - highs[hi1].price) / dt_high;

         for(int lo1=0; lo1<lowCount-1; lo1++)
           {
            for(int lo2=lo1+1; lo2<lowCount; lo2++)
              {
               double dt_low = (double)(lows[lo2].time - lows[lo1].time);
               if(dt_low <= 0)
                  continue;
               double slope_low = (lows[lo2].price - lows[lo1].price) / dt_low;

               double avgSlope = (MathAbs(slope_high) + MathAbs(slope_low)) / 2.0;
               double diff = MathAbs(slope_high - slope_low);
               double maxDiff = MaxSlopeDifference * MathMax(avgSlope,0.000001);
               if(diff > maxDiff)
                  continue;

               double upper_at_l1 = highs[hi1].price + slope_high * (lows[lo1].time - highs[hi1].time);
               double upper_at_l2 = highs[hi1].price + slope_high * (lows[lo2].time - highs[hi1].time);

               if(upper_at_l1 <= lows[lo1].price || upper_at_l2 <= lows[lo2].price)
                  continue;

               double dist1 = upper_at_l1 - lows[lo1].price;
               double dist2 = upper_at_l2 - lows[lo2].price;
               double width = (dist1 + dist2) / 2.0;

               if(width < MinChannelWidthATR * currentATR)
                  continue;

               double lower_at_l1 = upper_at_l1 - width;
               double lower_at_l2 = upper_at_l2 - width;
               if(lower_at_l1 > lows[lo1].price + tolerance || lower_at_l2 > lows[lo2].price + tolerance)
                  continue;

               int recentHigh = 0;
               int touchesHigh = CountTouchesOnLine(highs[hi1],highs[hi2],highs,highCount,true,tolerance,RecentTouchBars,recentHigh);

               SwingPoint lowerAnchor1, lowerAnchor2;
               lowerAnchor1.time = highs[hi1].time;
               lowerAnchor1.price = highs[hi1].price - width;
               lowerAnchor2.time = highs[hi2].time;
               lowerAnchor2.price = highs[hi2].price - width;
               int recentLow = 0;
               int touchesLow = CountTouchesOnLine(lowerAnchor1,lowerAnchor2,lows,lowCount,false,tolerance,RecentTouchBars,recentLow);

               if(touchesHigh < MinTouchPointsRequired || touchesLow < MinTouchPointsRequired)
                  continue;
               if(MinRecentTouches > 0 && (recentHigh < MinRecentTouches || recentLow < MinRecentTouches))
                  continue;

               double score = (touchesHigh + touchesLow) * 25.0;
               double recencyBonus = (1.0 - (double)MathMin(highs[hi2].barIndex,lows[lo2].barIndex) / totalBars) * 30.0;
               score += recencyBonus;

               if(score > bestChannel.score)
                 {
                  bestChannel.high1 = highs[hi1];
                  bestChannel.high2 = highs[hi2];
                  bestChannel.low1  = lows[lo1];
                  bestChannel.low2  = lows[lo2];
                  bestChannel.slope = slope_high;
                  bestChannel.width = width;
                  bestChannel.highTouches = touchesHigh;
                  bestChannel.lowTouches  = touchesLow;
                  bestChannel.score = score;
                  bestChannel.type = ClassifyChannel(slope_high);
                  bestChannel.strength = GradeStrength(touchesHigh + touchesLow);

                  if(DebugMode)
                     Print(StringFormat("Candidate accepted: H-touches=%d, L-touches=%d, width=%g, score=%g",
                                        touchesHigh,touchesLow,width,score));
                 }
              }
           }
        }
     }
   return (bestChannel.score > 0.0);
  }
//+------------------------------------------------------------------+
The channel search process evaluates combinations of swing highs and lows using nested iteration. Although this introduces theoretical quadratic complexity, practical performance remains controlled due to aggressive early rejection filters. Conditions such as maximum slope deviation and minimum ATR-normalized channel width eliminate weak candidates before deeper evaluation occurs. Additionally, limiting swing detection to a bounded lookback window prevents uncontrolled growth in candidate combinations. This structured pruning ensures that the engine remains performant even during volatile market phases.
Visualization Module
Once the best channel is identified, this component visualizes it clearly on the chart. It draws two parallel trendlines: an upper line connecting the initial high swing point to a projected future point, and a lower line offset by the channel width, maintaining parallelism. These lines are extended into the future by a configurable number of bars (LineExtensionBars), providing a forward-looking support/resistance zone. The trendlines are dynamically recreated each tick to ensure synchronization with real-time data, preventing visual clutter. Additional visual cues, such as crosses at swing points and labels indicating touch counts, channel strength, and bias signals (buy-only, sell-only, or neutral), are added to improve clarity. All graphical objects are named with a prefix (TL_PREFIX) and are actively managed—deleted and recreated each tick—to keep the chart visually clean and accurate.
//+------------------------------------------------------------------+
//| Draw the parallel channel with extension                         |
//+------------------------------------------------------------------+
void DrawChannel(const Channel &ch)
  {
   string upName  = TL_PREFIX + "UPPER";
   string dnName  = TL_PREFIX + "LOWER";
   string lblName = TL_PREFIX + "LABEL";

   color upperColor = UpperLineColor;
   color lowerColor = LowerLineColor;

//--- Compute future extension point
   datetime lastSwingTime = MathMax(ch.high2.time,ch.low2.time);
   datetime futureTime = lastSwingTime + LineExtensionBars * PeriodSeconds(_Period);
   double futureUpper = LinePriceAtTime(ch.high1,ch.high2,futureTime);
   double futureLower = futureUpper - ch.width;

//--- Upper line (from first high to future point)
   if(ObjectFind(0,upName) < 0)
      ObjectCreate(0,upName,OBJ_TREND,0,ch.high1.time,ch.high1.price,futureTime,futureUpper);
   else
     {
      ObjectMove(0,upName,0,ch.high1.time,ch.high1.price);
      ObjectMove(0,upName,1,futureTime,futureUpper);
     }
   ObjectSetInteger(0,upName,OBJPROP_COLOR,upperColor);
   ObjectSetInteger(0,upName,OBJPROP_WIDTH,LineWidth);
   ObjectSetInteger(0,upName,OBJPROP_STYLE,LineStyle);
   ObjectSetInteger(0,upName,OBJPROP_RAY_RIGHT,false);
   ObjectSetInteger(0,upName,OBJPROP_BACK,false);

//--- Lower line (parallel, starting at same time as upper)
   double lower1 = ch.high1.price - ch.width;
   if(ObjectFind(0,dnName) < 0)
      ObjectCreate(0,dnName,OBJ_TREND,0,ch.high1.time,lower1,futureTime,futureLower);
   else
     {
      ObjectMove(0,dnName,0,ch.high1.time,lower1);
      ObjectMove(0,dnName,1,futureTime,futureLower);
     }
   ObjectSetInteger(0,dnName,OBJPROP_COLOR,lowerColor);
   ObjectSetInteger(0,dnName,OBJPROP_WIDTH,LineWidth);
   ObjectSetInteger(0,dnName,OBJPROP_STYLE,LineStyle);
   ObjectSetInteger(0,dnName,OBJPROP_RAY_RIGHT,false);
   ObjectSetInteger(0,dnName,OBJPROP_BACK,false);

//--- Optional low reference crosses
   if(ShowLowReferenceCrosses)
     {
      string cross1 = TL_PREFIX + "LOWREF1", cross2 = TL_PREFIX + "LOWREF2";
      if(ObjectFind(0,cross1) < 0)
         ObjectCreate(0,cross1,OBJ_ARROW,0,ch.low1.time,ch.low1.price);
      else
         ObjectMove(0,cross1,0,ch.low1.time,ch.low1.price);
      ObjectSetInteger(0,cross1,OBJPROP_ARROWCODE,159);
      ObjectSetInteger(0,cross1,OBJPROP_COLOR,clrGray);
      ObjectSetInteger(0,cross1,OBJPROP_WIDTH,1);
      ObjectSetInteger(0,cross1,OBJPROP_BACK,false);

      if(ObjectFind(0,cross2) < 0)
         ObjectCreate(0,cross2,OBJ_ARROW,0,ch.low2.time,ch.low2.price);
      else
         ObjectMove(0,cross2,0,ch.low2.time,ch.low2.price);
      ObjectSetInteger(0,cross2,OBJPROP_ARROWCODE,159);
      ObjectSetInteger(0,cross2,OBJPROP_COLOR,clrGray);
      ObjectSetInteger(0,cross2,OBJPROP_WIDTH,1);
      ObjectSetInteger(0,cross2,OBJPROP_BACK,false);
     }

//--- Label
   datetime labelTime = MathMax(ch.high2.time,ch.low2.time);
   double labelPrice = (ch.high1.price + ch.high2.price)/2.0 - ch.width/2.0;
   string strengthText = (ch.strength == HIGH ? "HIGH" : (ch.strength == MEDIUM ? "MEDIUM" : "LOW"));
   string biasText = "NEUTRAL";
   if(UseChannelTypeFilter)
     {
      if(ch.type == ASCENDING)
         biasText = "BUY ONLY";
      else
         if(ch.type == DESCENDING)
            biasText = "SELL ONLY";
     }
   string labelText = "Touches: " + IntegerToString(ch.highTouches + ch.lowTouches) +
                      "\nStrength: " + strengthText + "\nBias: " + biasText;

   if(ObjectFind(0,lblName) < 0)
      ObjectCreate(0,lblName,OBJ_TEXT,0,labelTime,labelPrice);
   else
      ObjectMove(0,lblName,0,labelTime,labelPrice);

   ObjectSetString(0,lblName,OBJPROP_TEXT,labelText);
   ObjectSetInteger(0,lblName,OBJPROP_COLOR,clrWhite);
   ObjectSetInteger(0,lblName,OBJPROP_FONTSIZE,10);
   ObjectSetInteger(0,lblName,OBJPROP_BACK,false);
  }
//+------------------------------------------------------------------+
Breakout validation is governed by a structured state model to prevent duplicate or premature signal generation. Each detected event transitions through defined stages:
- Neutral—No breakout activity.
- Pending Breakout—Initial crossing detected but awaiting retest confirmation (if retest mode is enabled).
- Confirmed Breakout—All filters satisfied; signal issued.
- Expired/Invalidated—Conditions no longer valid before confirmation.
//+------------------------------------------------------------------+
//| Checks for breakout crossing and applies filters                 |
//+------------------------------------------------------------------+
void CheckChannelBreakouts(const MqlRates &rates[],const Channel &ch,
                           const SwingPoint &highs[],int highCount,
                           const SwingPoint &lows[],int lowCount)
  {
   if(ArraySize(rates) < 3)
      return;

   datetime t1 = rates[1].time;
   datetime t2 = rates[2].time;
   double buf = BreakoutBufferPrice();
   double minStrength = BreakoutMinStrengthATR * currentATR;
   double strongThreshold = BreakoutStrongThreshold * currentATR;
   int totalTouches = ch.highTouches + ch.lowTouches;

   double upper1 = LinePriceAtTime(ch.high1,ch.high2,t1);
   double upper2 = LinePriceAtTime(ch.high1,ch.high2,t2);
   double pUp1 = BreakoutUseClose ? rates[1].close : rates[1].high;
   double pUp2 = BreakoutUseClose ? rates[2].close : rates[2].high;

   bool crossedUp = false;
   if(BreakoutStrictMode)
      crossedUp = (pUp2 <= upper2 + buf) && (pUp1 > upper1 + buf);
   else
      crossedUp = (pUp1 > upper1 + buf);

   double upStrength = pUp1 - (upper1 + buf);
   bool strongUp = (minStrength == 0) || (upStrength >= minStrength);
   bool superStrongUp = (strongThreshold > 0) && (upStrength >= strongThreshold);

   double lower1 = upper1 - ch.width;
   double lower2 = upper2 - ch.width;
   double pLow1 = BreakoutUseClose ? rates[1].close : rates[1].low;
   double pLow2 = BreakoutUseClose ? rates[2].close : rates[2].low;

   bool crossedDown = false;
   if(BreakoutStrictMode)
      crossedDown = (pLow2 >= lower2 - buf) && (pLow1 < lower1 - buf);
   else
      crossedDown = (pLow1 < lower1 - buf);

   double downStrength = (lower1 - buf) - pLow1;
   bool strongDown = (minStrength == 0) || (downStrength >= minStrength);
   bool superStrongDown = (strongThreshold > 0) && (downStrength >= strongThreshold);

   bool isSweepUp = false, isSweepDown = false;
   if(UseLiquiditySweepFilter)
     {
      double high = rates[1].high, low = rates[1].low, close = rates[1].close;
      isSweepUp   = (high > upper1 + buf) && (close <= upper1 + buf);
      isSweepDown = (low < lower1 - buf) && (close >= lower1 - buf);
     }

   bool volExpanded = true;
   if(UseVolatilityExpansion && atrBuffer[0] > 0)
     {
      double atrNow = atrBuffer[0];
      double atr10  = atrBuffer[10];
      if(atr10 > 0)
         volExpanded = (atrNow / atr10) >= MinVolatilityExpansion;
     }

   bool structBullish = true, structBearish = true;
   if(UseStructuralBreak)
     {
      SwingPoint lastHigh, lastLow;
      GetLastSwing(highs,highCount,lows,lowCount,lastHigh,lastLow);
      if(crossedUp && lastHigh.time > 0)
         structBullish = (pUp1 > lastHigh.price);
      if(crossedDown && lastLow.time > 0)
         structBearish = (pLow1 < lastLow.price);
     }

   bool allowBullish = true, allowBearish = true;
   if(UseChannelTypeFilter)
     {
      if(ch.type == ASCENDING)
         allowBearish = false;
      else if(ch.type == DESCENDING)
         allowBullish = false;
     }

   //--- Bullish breakout handling
   if(crossedUp && strongUp && allowBullish && !isSweepUp && volExpanded && structBullish)
     {
      bool trigger = superStrongUp;
      if(!trigger)
        {
         trigger = true;
         for(int i=1; i<=BreakoutConfirmationBars; i++)
           {
            if(i >= ArraySize(rates))
              {
               trigger = false;
               break;
              }
            datetime ti = rates[i].time;
            double ui = LinePriceAtTime(ch.high1,ch.high2,ti);
            double pi = BreakoutUseClose ? rates[i].close : rates[i].high;
            if(!(pi > ui + buf && (pi - (ui + buf)) >= minStrength))
              {
               trigger = false;
               break;
              }
           }
        }
      if(trigger)
        {
         if(UseRetestMode)
           {
            // Store pending breakout
            if(pendingCount >= ArraySize(pendingBreakouts))
               ArrayResize(pendingBreakouts,pendingCount+10);
            PendingBreakout pb;
            pb.breakoutTime = t1;
            pb.price = pUp1;
            pb.isBullish = true;
            pb.linePrice = upper1;
            pb.totalTouches = totalTouches;
            pb.channelSlope = ch.slope;
            pb.channelWidth = ch.width;
            pb.high1 = ch.high1;
            pb.high2 = ch.high2;
            pendingBreakouts[pendingCount++] = pb;
            if(DebugMode)
               Print("Bullish pending retest at ",TimeToString(t1));
           }
         else
           {
            double arrowPrice = rates[1].low - currentATR*0.15;
            DrawPermanentArrow(t1,arrowPrice,true,totalTouches,rates[1].low,rates[1].high);
           }
         if(AlertOnBreakout)
            Alert(_Symbol," ",EnumToString(_Period),": BUY breakout");
        }
     }

   //--- Bearish breakout handling (symmetrical)
   if(crossedDown && strongDown && allowBearish && !isSweepDown && volExpanded && structBearish)
     {
      bool trigger = superStrongDown;
      if(!trigger)
        {
         trigger = true;
         for(int i=1; i<=BreakoutConfirmationBars; i++)
           {
            if(i >= ArraySize(rates))
              {
               trigger = false;
               break;
              }
            datetime ti = rates[i].time;
            double ui = LinePriceAtTime(ch.high1,ch.high2,ti);
            double li = ui - ch.width;
            double pi = BreakoutUseClose ? rates[i].close : rates[i].low;
            if(!(pi < li - buf && ((li - buf) - pi) >= minStrength))
              {
               trigger = false;
               break;
              }
           }
        }
      if(trigger)
        {
         if(UseRetestMode)
           {
            if(pendingCount >= ArraySize(pendingBreakouts))
               ArrayResize(pendingBreakouts,pendingCount+10);
            PendingBreakout pb;
            pb.breakoutTime = t1;
            pb.price = pLow1;
            pb.isBullish = false;
            pb.linePrice = lower1;
            pb.totalTouches = totalTouches;
            pb.channelSlope = ch.slope;
            pb.channelWidth = ch.width;
            pb.high1 = ch.high1;
            pb.high2 = ch.high2;
            pendingBreakouts[pendingCount++] = pb;
            if(DebugMode)
               Print("Bearish pending retest at ",TimeToString(t1));
           }
         else
           {
            double arrowPrice = rates[1].high + currentATR*0.15;
            DrawPermanentArrow(t1,arrowPrice,false,totalTouches,rates[1].low,rates[1].high);
           }
         if(AlertOnBreakout)
            Alert(_Symbol," ",EnumToString(_Period),": SELL breakout");
        }
     }
  }
//+------------------------------------------------------------------+
This state-driven design ensures that each breakout is processed deterministically and only once, preventing signal duplication and maintaining logical transparency in both immediate and retest modes.
Signal Management & Persistence Layer
This component ensures that signals and visual cues persist reliably across chart refreshes, reinitializations, or code recompilations. It maintains arrays such as breakoutsArray, which store confirmed breakouts, including details like time, price, and strength. It handles drawing permanent arrows and zones that mark breakout levels, extending into the future if configured (UseBreakoutZones). During retest mode, it continuously monitors whether the price re-enters the breakout zone, confirming the signal only after a successful retest. It manages the lifecycle of graphical objects, deleting temporary objects each tick while keeping persistent signals visible. This approach provides traders with a consistent visual and decision-making framework, reducing confusion caused by chart reloading or code changes.
//+------------------------------------------------------------------+
//| Store and draw confirmed signals                                 |
//+------------------------------------------------------------------+
void DrawPermanentArrow(datetime time,double price,bool isBullish,int totalTouches,double low=0,double high=0)
  {
   string arrowName = SIG_PREFIX + (isBullish ? "BUY_" : "SELL_") +
                      IntegerToString((int)time) + "_" + IntegerToString(totalTouches);

//--- Avoid duplicate arrows
   if(ObjectFind(0,arrowName) >= 0)
      return;

   if(!ObjectCreate(0,arrowName,OBJ_ARROW,0,time,price))
     {
      if(DebugMode)
         Print("Failed to create arrow: ",GetLastError());
      return;
     }

   ObjectSetInteger(0,arrowName,OBJPROP_ARROWCODE,isBullish ? 233 : 234);
   ObjectSetInteger(0,arrowName,OBJPROP_COLOR,isBullish ? BullArrowColor : BearArrowColor);
   ObjectSetInteger(0,arrowName,OBJPROP_WIDTH,ArrowSize);
   ObjectSetInteger(0,arrowName,OBJPROP_BACK,false);
   ObjectSetInteger(0,arrowName,OBJPROP_SELECTABLE,false);
   ObjectSetInteger(0,arrowName,OBJPROP_HIDDEN,true);

   string desc = "Channel Breakout " + (isBullish ? "BULLISH" : "BEARISH") +
                 " (" + IntegerToString(totalTouches) + " touches)";
   ObjectSetString(0,arrowName,OBJPROP_TEXT,desc);

   if(UseBreakoutZones && high > low)
      DrawBreakoutZone(time,low,high,isBullish,totalTouches);

//--- Store in persistent array
   if(breakoutsCount >= ArraySize(breakoutsArray))
      ArrayResize(breakoutsArray,breakoutsCount+10);
   breakoutsArray[breakoutsCount].time = time;
   breakoutsArray[breakoutsCount].price = price;
   breakoutsArray[breakoutsCount].isBullish = isBullish;
   breakoutsArray[breakoutsCount].totalTouches = totalTouches;
   breakoutsCount++;
  }
//+------------------------------------------------------------------+
Before storing or drawing a new breakout signal, the system verifies that an equivalent signal has not already been recorded within the same structural context. This prevents repetitive arrows from being plotted during prolonged volatility or during multiple ticks within the same bar. Each stored breakout includes its timestamp and structural reference, allowing the system to enforce one-signal-per-event governance. This guarantees clarity in visual output and preserves analytical credibility.
Supporting & Utility Systems
Supporting systems underpin all modules by providing essential utilities such as ATR calculation, object management, and mathematical helpers. ATR is handled through a dedicated handle (iATR), updated each bar, providing normalized volatility measures used throughout the system for filtering and zone plotting. Functions like LinePriceAtTime() compute the projected price of trendlines at specific times, while CountTouchesOnLine() evaluates how many swings are relevant to each rail, considering only those on or near the line within a specific tolerance and relevant to the line’s position.
Classification functions analyze the slope of candidate channels, categorizing them as ascending, descending, or horizontal, which supports filtering and bias signals. Touch strength grading functions evaluate the number of touches, classifying channels as high, medium, or low strength, assisting in filtering less reliable structures. The entire system includes an extensive debug infrastructure that logs decision points, calculations, and filter results, making it easier for developers and traders to fine-tune parameters, troubleshoot issues, and understand the decision process.
//+------------------------------------------------------------------+
//| Calculate the slope between two swing points                     |
//+------------------------------------------------------------------+
double CalculateSlope(const SwingPoint &a,const SwingPoint &b)
  {
   double deltaTime = (b.time - a.time);
   if(deltaTime == 0)
      return(0);
   return (b.price - a.price)/deltaTime;
  }
//+------------------------------------------------------------------+

//+------------------------------------------------------------------+
//| Count touches on a trendline considering only swings on relevant side |
//+------------------------------------------------------------------+
int CountTouchesOnLine(const SwingPoint &a,const SwingPoint &b,
                       const SwingPoint &swings[],int swingCount,
                       bool isUpperLine,double tolerance,
                       int recentBars,int &recentCount)
  {
   int touches = 2;               // the two anchor swings
   recentCount = 0;
   double timeDiff = (double)(b.time - a.time);
   if(timeDiff <= 0)
      return touches;
   double slope = (b.price - a.price) / timeDiff;

   for(int i=0; i<swingCount; i++)
     {
      if(swings[i].time == a.time || swings[i].time == b.time)
         continue;
      if(swings[i].time < a.time || swings[i].time > b.time)
         continue;

      double linePrice = a.price + slope * (swings[i].time - a.time);
      double distance = isUpperLine ? linePrice - swings[i].price
                        : swings[i].price - linePrice;

      bool correctSide = (isUpperLine && distance >= -tolerance) ||
                         (!isUpperLine && distance >= -tolerance);

      if(correctSide && MathAbs(distance) <= tolerance)
        {
         touches++;
         if(swings[i].barIndex <= recentBars)
            recentCount++;
        }
     }
   return touches;
  }
//+------------------------------------------------------------------+
All analytical stages operate on strongly defined data structures such as SwingPoint, Channel, and BreakoutInfo. This structured approach enforces clear data ownership and separation of responsibilities between modules. Rather than passing raw price values across functions, encapsulated objects are transmitted, ensuring data integrity and reducing the risk of logical inconsistencies. This design improves maintainability and allows future system expansion—such as multi-channel tracking or multi-symbol adaptation—without architectural restructuring.
Data Flow and Interaction
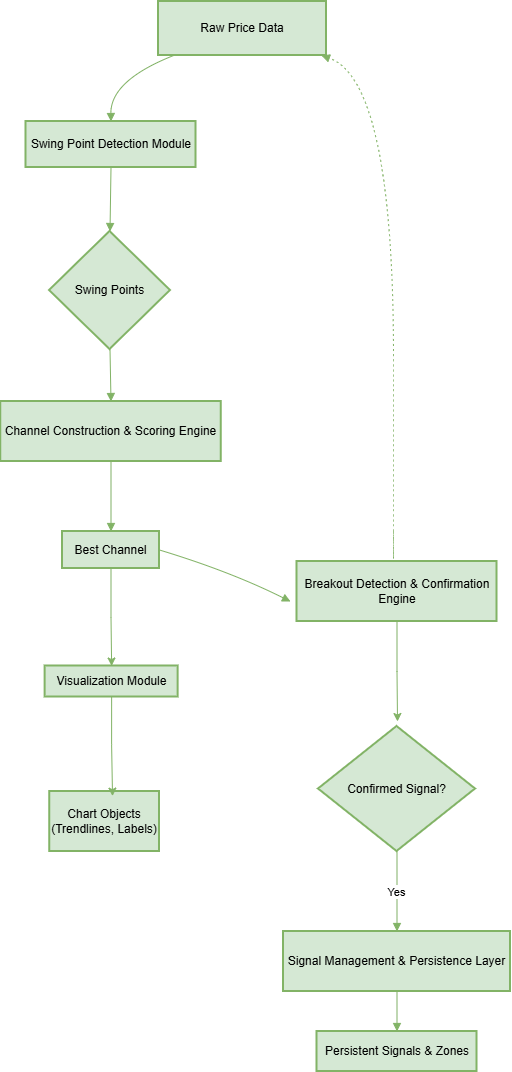
The data flow begins with the Swing Point Detection Module, which analyzes recent price data to find significant swings—local highs and lows that define the market’s structure. These swing points serve as input for the Channel Construction & Scoring Engine, which exhaustively searches for the most statistically significant parallel channel that fits these swings. It evaluates each candidate with touch counts, recency, and strength, scoring them accordingly. The highest-scoring channel is then passed to the Visualization Module, which renders the trendlines with clear extension into the future, along with informative labels and markers.
Concurrently, the Breakout Detection & Confirmation Engine projects these trendlines into real-time data, constantly monitoring for crossings that could signal breakouts. When a potential breakout occurs, multiple filters—based on volatility, structural breaks, liquidity, and volatility expansion—are applied to validate the event. Only after passing all filters does the system generate a confirmed trading signal, either immediately or after a retest confirmation.
The Signal Management & Persistence Layer ensures that these signals, along with their visual representations, are stored persistently and displayed reliably, even after chart reloads. It handles the lifecycle of all graphical objects—deleting temporary objects each tick and maintaining permanent signals and zones. This guarantees traders always have a clear, up-to-date visual cue and a reliable record of confirmed signals.
Throughout this process, data is organized via structured data types, passing from raw swing points, through candidate channels, to confirmed signals, with each module focusing on a specific aspect of the analysis. This organized data flow ensures the system remains transparent, adaptable, and capable of delivering high-quality, validated breakout signals.
Execution Lifecycle and Event Handling
The Expert Advisor adheres strictly to MetaTrader 5’s event‑driven execution model. Initialization occurs in `OnInit()`, where indicator handles (such as ATR), configuration parameters, and graphical naming prefixes are prepared. All persistent arrays are allocated at this stage to ensure structural readiness before market processing begins.
The core analytical workflow is executed inside `OnTick()`. However, to preserve computational efficiency, structural recalculations—such as swing detection and channel reconstruction—are performed only when a new bar is detected. This is achieved by storing the timestamp of the last processed bar and comparing it against the current bar’s opening time (see the `static datetime lastBarTime` variable in the `OnTick()` snippet from the *Breakout Detection & Confirmation Engine* subsection). By gating heavy logic behind new‑bar detection, the system avoids redundant processing on every tick while still reacting immediately to breakout conditions.
When the EA is removed or recompiled, `OnDeinit()` performs controlled cleanup of graphical objects and indicator handles, ensuring no orphaned objects remain on the chart. This disciplined lifecycle management enhances stability, efficiency, and predictable behavior across reinitializations.
Testing and Outcomes
This section outlines the testing process undertaken to evaluate the tool’s performance and reliability. Testing was approached from two complementary perspectives:
1) Live Testing on Real-Time Demo Charts
The tool was deployed on a demo chart under real-time conditions to monitor its responsiveness, accuracy, and stability amidst live market movements. This phase verified the system’s ability to detect genuine breakouts, filter false signals, and generate clear visual alerts in a dynamic environment.
- Live Testing: EURUSD (H1)
The diagram below illustrates a classic bearish parallel channel breakout captured by the system on the EURUSD H1 chart in mid-February 2026, demonstrating the modular architecture’s effectiveness under live-like conditions.
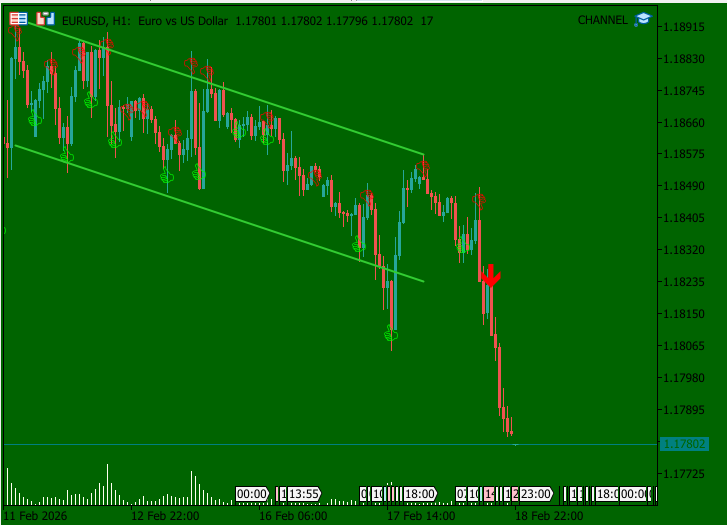
The chart shows a well-defined descending (bearish) parallel channel formed over several days (approximately 11–17 February 2026). The upper boundary (green line) connects recent swing highs, while the lower boundary runs parallel, respecting multiple swing lows. Key visual elements generated by the indicator include:
- Swing points—marked with red circles (highs) and green circles (lows), filtered using ATR-based minimum swing size to exclude insignificant fluctuations.
- Channel lines—extended forward (via LineExtensionBars), clearly illustrating the downward slope, classified as DESCENDING by ClassifyChannel().
- Touch indicators—multiple touches are visible on both boundaries, contributing to a high channel score and a MEDIUM/HIGH strength grade.
- Breakout signal—a prominent red downward arrow is placed near the candle close on 18 February around the 1.1832–1.1820 zone, triggered only after the price decisively closed below the lower channel boundary.
This example highlights how the system integrates swing detection, channel construction, breakout confirmation, and persistent visual signaling to provide precise, actionable information in real-time trading scenarios.
2) Historical Backtesting
A comprehensive backtest was performed across historical datasets to evaluate the tool under diverse market conditions. The process focused on measuring the tool’s accuracy in identifying valid breakouts, its false signal rate, and performance metrics such as win rate and risk-reward ratio.
- Backtesting: EURUSD (H1)
The diagram below highlights the EA’s backtesting performance. The system consistently identifies significant swing points and constructs robust parallel channels while filtering out minor fluctuations. Both bullish and bearish breakouts are reliably captured, with arrows clearly marking confirmed signals.
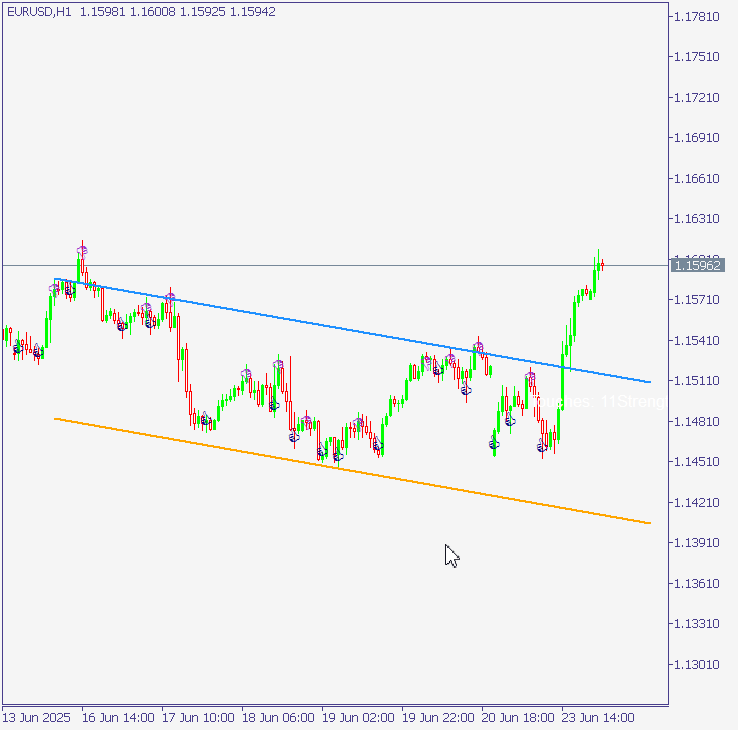
Overall, the backtesting results confirm the EA’s ability to maintain structural accuracy, validate breakouts, and provide clear visual cues across various historical market scenarios, highlighting the tool’s robustness and reliability.
Conclusion
The modular architecture of this system demonstrates a comprehensive approach to detecting, validating, and visualizing parallel channel breakouts in MQL5. Through carefully structured components—swing detection, channel construction, breakout confirmation, visual signaling, and adaptive recalculation—the tool maintains both accuracy and responsiveness in real-time market conditions.
Live testing on demo charts confirmed the system’s ability to capture meaningful breakouts while filtering noise, providing clear and actionable visual cues. Complementary historical backtesting across multiple datasets validated the EA’s robustness, showing consistent performance in identifying significant swing points, forming high-quality channels, and reliably signaling both bullish and bearish breakouts.
By integrating these results, the system offers a reliable foundation for traders seeking precise, structurally sound breakout analysis. Its combination of real-time adaptability, historical reliability, and persistent visual feedback ensures that users can confidently interpret market behavior and act on validated signals, making it a versatile and practical tool for professional MQL5 chart analysis.
Warning: All rights to these materials are reserved by MetaQuotes Ltd. Copying or reprinting of these materials in whole or in part is prohibited.
This article was written by a user of the site and reflects their personal views. MetaQuotes Ltd is not responsible for the accuracy of the information presented, nor for any consequences resulting from the use of the solutions, strategies or recommendations described.

- Free trading apps
- Over 8,000 signals for copying
- Economic news for exploring financial markets
You agree to website policy and terms of use