
Price Action Analysis Toolkit Development (Part 63): Automating Rising and Falling Wedge Detection in MQL5

Contents
- Introduction
- Structural Characteristics of Rising and Falling Wedges
- MQL5 Implementation
- Validation and Behavioral Analysis
- Conclusion
Introduction
When a chart is opened, the first instinct is to scan for structure. Familiar patterns help frame expectations, manage risk, and prepare for high-probability entries. Among the most traded price structures are rising and falling wedges—compression formations that often precede expansion.
The challenge, however, is not in knowing that wedges exist. The challenge lies in identifying them consistently and objectively. Many traders, especially those still developing chart-reading skills, struggle to recognize proper wedge structure. Even experienced analysts can spend considerable time drawing, adjusting, and validating trendlines—and sometimes miss a valid formation altogether. Subjective pattern recognition introduces delay, inconsistency, and bias.
To address this, we introduce an MQL5 indicator engineered to automatically detect and construct rising and falling wedge formations directly on the chart. The system identifies pivot points, validates slope convergence, prevents structural overlap, and monitors breakout or failure conditions—turning geometric theory into structured algorithmic logic.
In this article, we move step by step:
- First, we examine the structural characteristics of rising and falling wedges.
- Then we translate that theory into practical MQL5 implementation.
- Next, we validate the behavior of the system through testing.
- Finally, we conclude with insights and practical considerations.
Let’s begin by understanding how wedge formations develop and why they matter in price action analysis.
Structural Characteristics of Rising and Falling Wedges
A wedge is a price formation defined by two converging trendlines that contain market movement within a progressively narrowing range. Unlike horizontal consolidation, a wedge reflects directional compression—price continues to make higher highs and higher lows (rising wedge) or lower highs and lower lows (falling wedge), but the rate of movement between the two boundaries contracts over time. The defining feature is not simply the presence of two lines. It is the measurable convergence of structure. That convergence signals diminishing momentum and increasing pressure, often preceding a decisive breakout or structural failure.
To understand how this formation can be translated into algorithmic logic, we examine its structural components step by step.
1. Price Compression and Converging Trendlines
Wedges form during phases of controlled contraction. Each successive swing remains bounded between two lines that gradually approach one another.
- The upper boundary represents resistance pressure.
- The lower boundary represents support pressure.
As price oscillates between these boundaries, the vertical distance between them decreases. This compression reflects a reduction in volatility and a tightening of market structure. The narrowing range is not random; it follows directional movement that progressively loses expansion strength. The convergence itself is what differentiates a wedge from a parallel channel. In a channel, boundaries remain equidistant. In a wedge, they do not.
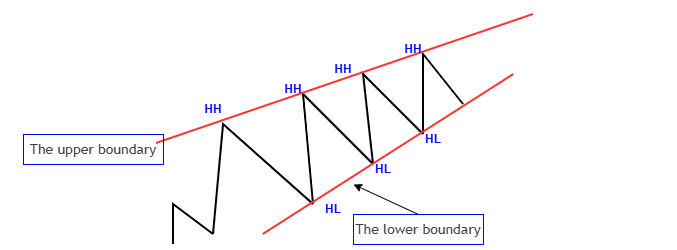
The figure above is a rising wedge showing converging upper and lower boundaries with directional compression (higher highs and higher lows).
2. Pivot Structure and Touch Validation
The integrity of a wedge depends on validated structural anchors. These anchors are swing highs and swing lows—pivot points that define the upper and lower boundaries. A valid wedge requires multiple confirmed touches on each boundary. Without sufficient interaction, the structure remains speculative. Each additional pivot strengthens structural legitimacy because it confirms that price is respecting the converging constraints.
This requirement prevents arbitrary trendline drawing and enforces objective formation rules. A wedge is not assumed from two points; it is confirmed through repeated structural interaction.
3. Slope Direction and Wedge Classification
Wedges are classified by the directional slope of their boundaries.
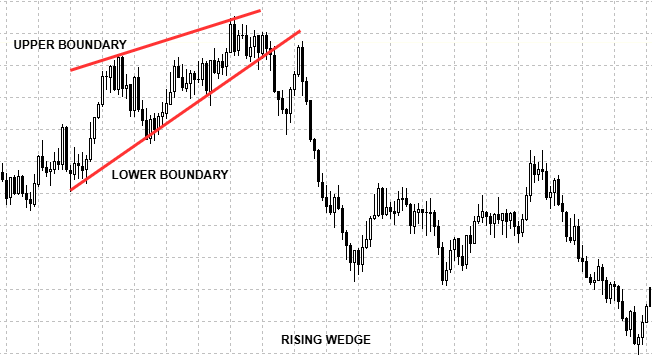
In a rising wedge:
- Both trendlines slope upward.
- The lower boundary rises at a faster rate than the upper boundary.
- Convergence occurs from below.
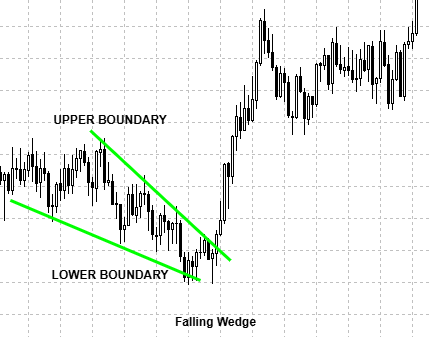
In a falling wedge:
- Both trendlines slope downward.
- The upper boundary declines at a faster rate than the lower boundary.
- Convergence occurs from above.
The classification is determined by comparing the relative slopes of the two boundaries. Convergence is mathematically evident when the slope differential causes the projected lines to intersect at a future point—commonly referred to as the apex. This slope relationship is what transforms a visual pattern into measurable geometry.
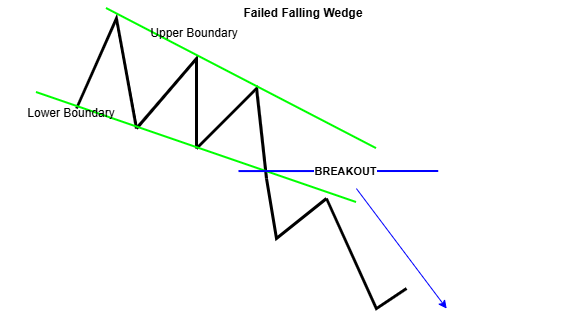
4. Breakout vs. Failure Behavior
Once compression reaches a critical stage, price resolves the structure.
- A rising wedge typically resolves downward.
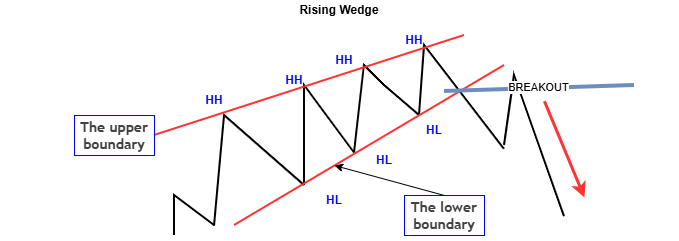
- A falling wedge typically resolves upward.
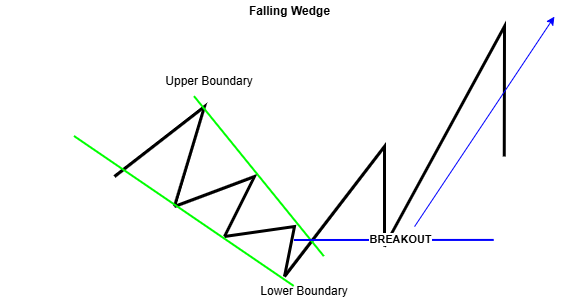
However, markets are not obligated to follow expectations. When price breaks in the opposite direction, the wedge is structurally invalidated. This outcome is not noise; it reflects a shift in order flow dynamics. Monitoring post-formation behavior is therefore essential. A wedge is incomplete at identification. Its validity is determined by how price reacts to its boundaries.
MQL5 Implementation
Having established the structural theory behind wedge formations, the next step is translating that logic into a robust, production-grade MQL5 implementation. The objective is not simply to draw converging trendlines, but to construct a disciplined, non-repainting detection engine that identifies significant swing points, mathematically validates boundary convergence, prevents structural conflicts through intelligent overlap detection, and continuously monitors breakout and failure conditions as price evolves in real time. The implementation is organized into interconnected layers: configuration inputs, pivot detection, wedge recognition, encapsulated pattern management, visualization, and event-driven execution flow.
The system is designed so that key pivot points, wedge slopes, and breakouts are clearly reflected on the chart, providing intuitive cues for trading decisions, while the underlying modular structure and non-repainting logic ensure the code remains robust, efficient, and maintainable.
Inputs and Configuration
The implementation begins with a clearly structured input section divided into logical groups that govern both detection sensitivity and visual presentation. These parameters determine how strictly the algorithm interprets market structure and how the resulting formations are rendered on the chart.
//+------------------------------------------------------------------+
//| Input parameters for Wedge Pattern indicator                     |
//+------------------------------------------------------------------+
input group "Pattern Detection Rules"
input int    PivotLeft           = 5;             // Pivot Left
input int    PivotRight          = 5;             // Pivot Right
input int    MinTouches          = 3;             // Min. Touches per Line

input group "Visual Design"
input color  RisingColor         = clrRed;        // Rising Wedge (Bearish)
input color  FallingColor        = clrLime;       // Falling Wedge (Bullish)
input int    MaxWedges           = 20;            // Max wedges displayed (oldest removed)
input bool   ExtendLines         = true;          // Extend wedge lines
input int    LineExtensionBars   = 30;            // Bars to extend (if ExtendLines=true)
input ENUM_LINE_STYLE LineStyle  = STYLE_SOLID;   // Line style for wedge lines
input int    LineWidth           = 1;             // Line width (1-5)
input bool   ShowLabels          = true;          // Show pattern labels
input int    LabelFontSize       = 8;             // Label font size
input bool   LabelWithBackground = false;         // Add background rectangle to labels
input color  LabelBgColor        = clrBlack;      // Label background color
input double LabelBgOpacity      = 0.7;           // Background opacity (0.0-1.0)
The first group, Pattern Detection Rules, contains PivotLeft, PivotRight, and MinTouches. The pivot parameters define how many bars on either side of a candidate candle must be evaluated when determining whether it qualifies as a swing high or swing low. Increasing these values produces stronger, more conservative pivots by requiring more pronounced swings, while reducing them increases responsiveness at the cost of potential noise. The MinTouches parameter enforces structural validation by requiring a minimum number of pivot points on both boundaries before a wedge can be considered valid, preventing weak or premature formations from being accepted.
The second group, Visual Design, controls chart rendering and object behavior. RisingColor and FallingColor differentiate bearish rising wedges from bullish falling wedges. MaxWedges limits how many historical formations remain visible, automatically removing the oldest structures to prevent clutter. ExtendLines and LineExtensionBars define whether and how far boundary lines are projected into future bars. Additional styling inputs refine readability and chart aesthetics, including line width, style, label visibility, font size, and optional background rectangles with adjustable opacity. These configuration options ensure the system remains fully adaptable without modifying any core detection logic.
Pivot Point Detection and Structural Confirmation
With configuration established, the detection process begins by isolating structurally meaningful swing points. Wedge construction depends on clean pivot data rather than raw price fluctuations. To support this, the implementation introduces a dedicated Pivot class that encapsulates each pivot’s bar index, timestamp, and price.
//+------------------------------------------------------------------+
//| Pivot point class                                                |
//+------------------------------------------------------------------+
class Pivot : public CObject
  {
public:
   int      index;
   datetime time;
   double   price;

   Pivot(int idx,datetime t,double p) : index(idx),time(t),price(p) {}
  };
This object-oriented approach simplifies storage, memory handling, and later structural referencing. The helper functions IsPivotHigh() and IsPivotLow() evaluate each candidate bar by comparing its high or low against neighboring bars within the range defined by PivotLeft and PivotRight. By confirming pivots only after sufficient surrounding bars have formed, the indicator ensures that only meaningful swing highs and lows define wedge boundaries. This approach highlights price areas where support and resistance hold, producing reliable signals while preventing historical instability in the detection logic.
//+------------------------------------------------------------------+
//| Check if bar at idx is a pivot high                              |
//+------------------------------------------------------------------+
bool IsPivotHigh(int idx,const double &high[],int left,int right)
  {
   if(idx-left<0) return(false);
   double val=high[idx];
   for(int i=idx-left; i<=idx+right; i++)
     {
      if(i==idx) continue;
      if(i>=ArraySize(high)) return(false);
      if(high[i]>=val) return(false);
     }
   return(true);
  }

//+------------------------------------------------------------------+
//| Check if bar at idx is a pivot low                               |
//+------------------------------------------------------------------+
bool IsPivotLow(int idx,const double &low[],int left,int right)
  {
   if(idx-left<0) return(false);
   double val=low[idx];
   for(int i=idx-left; i<=idx+right; i++)
     {
      if(i==idx) continue;
      if(i>=ArraySize(low)) return(false);
      if(low[i]<=val) return(false);
     }
   return(true);
  }
A pivot high is confirmed only if the bar’s high exceeds all surrounding highs in its evaluation window, while a pivot low must be lower than all surrounding lows. Importantly, pivots are not confirmed immediately. The algorithm delays validation by evaluating a candidate index only after the required number of right-side bars have formed. This progressive confirmation mechanism ensures that pivots do not repaint, preserving structural integrity and preventing historical instability in detected patterns. During both the initial historical scan and subsequent updates inside OnCalculate(), confirmed pivots are stored in dynamic CArrayObj containers with automatic memory management. This filtering stage transforms raw price data into a stable representation of market structure, forming reliable anchor points for boundary construction.
Wedge Pattern Recognition and Geometric Validation
Once sufficient pivot points have been confirmed, the next step is to determine whether their configuration forms a converging structure characteristic of a wedge. Detection is triggered immediately whenever a new pivot is added through the TryDetectWedge() function. The slope and convergence of the boundaries determine whether the structure represents a rising or falling wedge. By projecting the theoretical apex and rejecting overlapping or already-intersected formations, the system only presents clean, actionable patterns on the chart while maintaining precise geometric validation in the code.
//+------------------------------------------------------------------+
//| Try to detect a new wedge pattern from recent pivots             |
//+------------------------------------------------------------------+
void TryDetectWedge(int currentBar,const datetime &time[],const double &close[])
  {
   int nHighs=pivotHighs.Total();
   int nLows=pivotLows.Total();
   if(nHighs<MinTouches || nLows<MinTouches) return;

   Pivot *p1h=dynamic_cast<Pivot*>(pivotHighs.At(nHighs-MinTouches));
   Pivot *pNh=dynamic_cast<Pivot*>(pivotHighs.At(nHighs-1));
   Pivot *p1l=dynamic_cast<Pivot*>(pivotLows.At(nLows-MinTouches));
   Pivot *pNl=dynamic_cast<Pivot*>(pivotLows.At(nLows-1));

   if(!p1h || !pNh || !p1l || !pNl) return;

   double upperSlope=(pNh.price-p1h.price)/(pNh.index-p1h.index+1e-10);
   double lowerSlope=(pNl.price-p1l.price)/(pNl.index-p1l.index+1e-10);

   int wedgeType=0;
   if(upperSlope>0 && lowerSlope>0 && lowerSlope>upperSlope) wedgeType=1;
   if(upperSlope<0 && lowerSlope<0 && upperSlope<lowerSlope) wedgeType=2;
   if(wedgeType==0) return;

   double apexX=(p1l.price-p1h.price+upperSlope*p1h.index-lowerSlope*p1l.index)/(upperSlope-lowerSlope+1e-10);
   if((int)MathRound(apexX)<=currentBar) return;

   bool isRising=(wedgeType==1);
   Wedge *w=new Wedge(isRising,p1h.index,p1h.time,p1h.price,pNh.index,pNh.time,pNh.price,
                      p1l.index,p1l.time,p1l.price,pNl.index,pNl.time,pNl.price,
                      upperSlope,lowerSlope,currentBar);

   if(OverlapsExistingWedge(w))
     {
      delete w;
      return;
     }

   w.Draw();
   wedges.Add(w);
   PruneOldWedges();
  }
This core logic retrieves the earliest and most recent pivot points within the required touch range. These points define the potential upper and lower boundaries of the wedge. The slopes of these boundaries are calculated directly between the relevant pivot pairs, providing a numerical measure of the angle and direction of each trendline. This step ensures that the algorithm can mathematically evaluate convergence rather than relying on visual approximation. Classification is strictly slope-driven: a rising wedge is identified when both boundary slopes are positive and the lower boundary rises more steeply than the upper boundary, while a falling wedge has both slopes negative with the upper boundary declining more sharply than the lower boundary.
The geometric validation also projects the theoretical apex (intersection point of the two trendlines) and accepts the formation only if this apex lies ahead of the current bar. Parallel lines and already-intersected structures are automatically rejected. Before accepting any new wedge, TryDetectWedge() calls OverlapsExistingWedge() which in turn uses the OverlapsWith() method to perform a precise bar-by-bar overlap check against every existing active wedge. By performing this check before creating a new wedge object, the system ensures structural consistency on the chart and avoids multiple conflicting patterns.
Wedge Structure and Detection Engine
Once a formation passes every geometric and overlap test inside TryDetectWedge(), the system proceeds to instantiate it as a formal Wedge object. The Wedge class encapsulates all necessary information, including start and end pivots for both boundaries, pre-computed slopes, wedge type (rising or falling), formation bar, and runtime state flags. Unique object names are generated based on pivot indices and formation time, guaranteeing that each wedge has a distinct identifier and preventing object name collisions on the chart even when multiple formations appear in rapid succession. Newly instantiated wedges are added to a managed CArrayObj container for lifecycle control.
//+------------------------------------------------------------------+
//| Main Wedge pattern class                                         |
//+------------------------------------------------------------------+
class Wedge : public CObject
  {
public:
   bool      isRising;
   int       upperStartIdx,upperEndIdx;
   double    upperStartPrice,upperEndPrice;
   int       lowerStartIdx,lowerEndIdx;
   double    lowerStartPrice,lowerEndPrice;
   double    upperSlope,lowerSlope;
   int       formationBar;
   bool      isBroken,isFailed;

   string    upperLineName,lowerLineName;
   string    labelName,labelBgName;

   double UpperPriceAt(int barIdx) const;
   double LowerPriceAt(int barIdx) const;

   void Draw(void);
   void Update(int currentBar,datetime currentTime,double currentClose);
   void Delete(void);
  };
This ensures that each formation is tracked, can be drawn on the chart, and is updated as price action unfolds, maintaining a real-time link between detection logic and visualization.
Visualization, Object Identity, and Dynamic Status Monitoring
Once a wedge has been validated and instantiated, the system focuses on visual representation and ongoing monitoring. Each Wedge object encapsulates not only its geometric data but also its visual identifiers and state. The Draw() method handles chart rendering for each wedge by creating styled upper and lower boundary trendlines using the configured colors, width, style, and optional forward extension. Upper and lower boundaries are styled and optionally extended to provide a clear visual guide, ensuring that the wedge’s structure is immediately readable while the code dynamically manages object creation and styling.
//+------------------------------------------------------------------+
//| Draw wedge trendlines and optional label                         |
//+------------------------------------------------------------------+
void Wedge::Draw(void)
  {
   color clr=isRising?RisingColor:FallingColor;

   //--- Upper trend line
   if(ExtendLines)
     {
      int upperExtIdx=upperEndIdx+LineExtensionBars;
      datetime upperExtTime=upperEndTime+PeriodSeconds(PERIOD_CURRENT)*LineExtensionBars;
      double upperExtPrice=UpperPriceAt(upperExtIdx);
      ObjectCreate(0,upperLineName,OBJ_TREND,0,upperStartTime,upperStartPrice,upperExtTime,upperExtPrice);
     }
   else
      ObjectCreate(0,upperLineName,OBJ_TREND,0,upperStartTime,upperStartPrice,upperEndTime,upperEndPrice);

   ObjectSetInteger(0,upperLineName,OBJPROP_COLOR,clr);
   ObjectSetInteger(0,upperLineName,OBJPROP_WIDTH,LineWidth);
   ObjectSetInteger(0,upperLineName,OBJPROP_STYLE,LineStyle);
   ObjectSetInteger(0,upperLineName,OBJPROP_RAY_RIGHT,false);

   //--- Lower trend line (identical logic) + label with formation date and optional background rectangle
  }
Formation labels display the wedge type and date, with the option to add a semi-transparent background rectangle for improved readability on dense charts. Dynamic status monitoring is performed by the Update() method, which evaluates boundary interactions on every new bar using the UpperPriceAt() and LowerPriceAt() projection helpers. Breakout detection incorporates a small volatility buffer to filter noise and spread. Breakouts and failures are marked only after decisive closes outside the boundaries, making the signals meaningful on the chart while the update mechanism efficiently evaluates only active wedges.
//+------------------------------------------------------------------+
//| Update wedge status - check for breakout or failure              |
//+------------------------------------------------------------------+
void Wedge::Update(int currentBar,datetime currentTime,double currentClose)
  {
   if(isBroken || isFailed) return;

   double upperNow=UpperPriceAt(currentBar);
   double lowerNow=LowerPriceAt(currentBar);

   bool upperBreak=currentClose>upperNow+Point()*3;
   bool lowerBreak=currentClose<lowerNow-Point()*3;

   if((isRising && lowerBreak) || (!isRising && upperBreak))
     {
      isBroken=true;
      //--- Update label to BREAKOUT
     }
   else if((isRising && upperBreak) || (!isRising && lowerBreak) || upperNow<=lowerNow)
     {
      isFailed=true;
      //--- Update label to FAILED
     }
  }
Together, the Draw(), Update(), and PruneOldWedges() mechanisms create a robust visual and monitoring layer that links structural detection with intuitive, real-time chart interpretation. When a wedge is no longer needed, its Delete() method cleanly removes all associated chart objects.
//+------------------------------------------------------------------+
//| Remove oldest wedges when limit is exceeded                      |
//+------------------------------------------------------------------+
void PruneOldWedges(void)
  {
   while(wedges.Total()>MaxWedges)
     {
      Wedge *oldest=dynamic_cast<Wedge*>(wedges.At(0));
      if(oldest) oldest.Delete();
      wedges.Delete(0);
     }
  }
Event-Driven Execution Flow
The wedge detection system is built to operate entirely within the MQL5 event-driven framework, leveraging the platform’s lifecycle functions for efficiency and reliability. Initialization occurs in the OnInit() function, where the CArrayObj containers for pivots and wedges are created with automatic memory management enabled. This setup ensures objects are created and deleted safely without memory leaks. When the indicator is removed from a chart, the OnDeinit() function is triggered to clean up all wedge-related chart objects and free allocated memory, leaving the chart in a clean state.
The main processing occurs in OnCalculate(). On the first execution cycle, a full historical scan of the price series is performed to detect initial pivot points using IsPivotHigh() and IsPivotLow() and identify any qualifying wedges via TryDetectWedge(). The incremental evaluation ensures that new bars trigger immediate detection and status updates, preserving performance while giving a live, reliable view of wedge developments on the chart.
//+------------------------------------------------------------------+
//| Main indicator calculation function                              |
//+------------------------------------------------------------------+
int OnCalculate(const int rates_total,
                const int prev_calculated,
                const datetime &time[],
                const double &open[],
                const double &high[],
                const double &low[],
                const double &close[])
  {
   ArraySetAsSeries(time,false);
   ArraySetAsSeries(high,false);
   ArraySetAsSeries(low,false);
   ArraySetAsSeries(close,false);

   if(prev_calculated==0)
     {
      ObjectsDeleteAll(0,"WEDGE_");
      pivotHighs.Clear();
      pivotLows.Clear();
      wedges.Clear();

      int startBar=PivotRight;
      int endBar=rates_total-PivotRight-1;

      for(int i=startBar; i<=endBar; i++)
        {
         bool newPivot=false;
         if(IsPivotHigh(i,high,PivotLeft,PivotRight))
           {
            pivotHighs.Add(new Pivot(i,time[i],high[i]));
            newPivot=true;
           }
         if(IsPivotLow(i,low,PivotLeft,PivotRight))
           {
            pivotLows.Add(new Pivot(i,time[i],low[i]));
            newPivot=true;
           }
         if(newPivot) TryDetectWedge(i,time,close);
        }
     }

   int start=(prev_calculated>0)?prev_calculated-1:0;
   for(int i=start; i<rates_total; i++)
     {
      int possibleIdx=i-PivotRight;
      if(possibleIdx<0) continue;

      bool newPivot=false;
      if(IsPivotHigh(possibleIdx,high,PivotLeft,PivotRight))
        {
         pivotHighs.Add(new Pivot(possibleIdx,time[possibleIdx],high[possibleIdx]));
         newPivot=true;
        }
      if(IsPivotLow(possibleIdx,low,PivotLeft,PivotRight))
        {
         pivotLows.Add(new Pivot(possibleIdx,time[possibleIdx],low[possibleIdx]));
         newPivot=true;
        }
      if(newPivot) TryDetectWedge(possibleIdx,time,close);
     }

   if(rates_total>0)
     {
      int currentBar=rates_total-1;
      for(int j=0; j<wedges.Total(); j++)
        {
         Wedge *w=dynamic_cast<Wedge*>(wedges.At(j));
         if(w) w.Update(currentBar,time[currentBar],close[currentBar]);
        }
     }

   PruneOldWedges();
   return(rates_total);
  }
For subsequent updates, the system evaluates only newly completed bars, significantly improving computational efficiency. Newly confirmed pivots immediately trigger wedge detection logic. Simultaneously, all existing wedges are updated with the latest closing price through their Update() methods, allowing real-time assessment of breakout or invalidation conditions. The incremental approach avoids redundant recalculations while ensuring timely visual feedback on evolving patterns. PruneOldWedges() is applied after each update to maintain optimal performance and chart clarity.
Summary
This MQL5 implementation converts theoretical wedge structure into a disciplined, non-repainting detection engine built on mathematically validated convergence. By isolating significant pivot points through IsPivotHigh() and IsPivotLow(), computing boundary slopes inside TryDetectWedge(), projecting apex intersections, preventing geometric overlap conflicts via OverlapsWith(), and dynamically managing directional breakout status through Update(), the system maintains structural integrity under real-time market conditions. The object-oriented design with Draw(), PruneOldWedges(), and controlled lifecycle management in OnInit()/OnDeinit() plus configurable parameters make the indicator both analytically robust and extensible for integration into broader trading frameworks.
Validation and Behavioral Analysis
This section presents the testing and validation process used to evaluate the real-world performance and robustness of the wedge pattern indicator. It is here that we fine-tune the input parameters to best suit different trading conditions, timeframes, and market regimes.
The indicator was thoroughly validated during the development and optimization phase in early 2026. Testing combined selected historical periods with extensive real-time forward testing on live charts. Major instruments, including EURUSD, GBPUSD, USDJPY, AUDUSD, and Gold (XAUUSD) were used across timeframes from M15 to H4 to assess behavior in both volatile and trending market conditions.
The following configuration served as the primary baseline:
//+------------------------------------------------------------------+
//| Default parameters used during validation                        |
//+------------------------------------------------------------------+
input group "Pattern Detection Rules"
input int PivotLeft   = 5;   // Pivot Left
input int PivotRight  = 5;   // Pivot Right
input int MinTouches  = 3;   // Min. Touches per Line

input group "Visual Design"
input color RisingColor  = clrRed;     // Rising Wedge (Bearish)
input color FallingColor = clrLime;    // Falling Wedge (Bullish)
input int   MaxWedges    = 20;         // Max wedges displayed (oldest removed)
input bool  ExtendLines  = true;       // Extend wedge lines
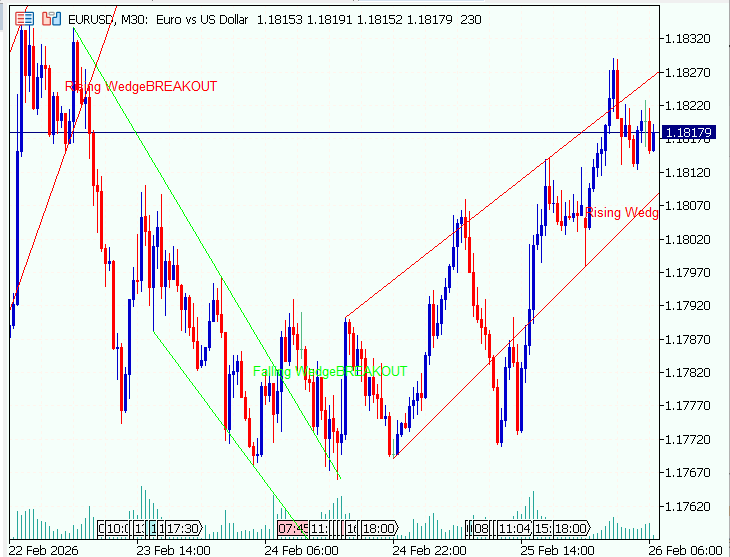
Real-time chart examples clearly demonstrate the indicator’s behavior:
- Reliable Detection & Classification: The system consistently identifies valid rising and falling wedges while correctly distinguishing bullish vs. bearish structures based on slope comparison.
- Timely Breakout Feedback: The direction-aware Update() method accurately marks breakouts and failures with clear labels (“BREAKOUT” or “FAILED”), helping traders react quickly.
- Chart Cleanliness: The overlap prevention logic (OverlapsWith() and OverlapsExistingWedge()) effectively keeps the chart uncluttered even when multiple potential patterns appear.
The image below shows a typical live example on EURUSD M30, highlighting multiple wedge detections and their subsequent breakout outcomes.
The animation below captures the wedge engine operating in real time on EURUSD M30. This example focuses on observable behavior rather than internal mechanics.
Several key characteristics become evident:
- Wedge formations appear only after structural maturity.
- Detected patterns remain stable once confirmed.
- Breakout outcomes are marked immediately at resolution.
Throughout the sequence, multiple wedge formations develop and resolve independently. Some complete with directional expansion, while others invalidate before follow-through. Each outcome is clearly labeled at the moment of structural resolution, allowing immediate interpretation without manual reanalysis. The recording also demonstrates pattern lifecycle control. As price transitions into new structural phases, earlier wedges conclude cleanly without leaving residual artifacts, preserving chart clarity during sustained volatility. Importantly, the example highlights that the system does not anticipate breakouts—it reacts only once boundary conditions are decisively met. This ensures that visual signals correspond to actual structural events rather than projected assumptions.
The animation therefore serves as practical confirmation that the engine behaves deterministically under live conditions, maintaining stability, clarity, and responsiveness as price evolves.
The live demonstration reinforces that the implementation is not merely theoretical—it performs consistently under dynamic conditions, maintaining structural integrity while delivering actionable feedback as price evolves.
Conclusion
We have designed and implemented a structurally disciplined, non-repainting wedge detection engine in MQL5 that extends far beyond simple visual pattern plotting. The system identifies confirmed pivot structures, validates boundary convergence mathematically, prevents structural overlap through intelligent filtering, and monitors breakout and failure conditions within a clean, object-oriented lifecycle framework.
Through deliberate architectural decisions—including encapsulated Pivot and Wedge classes, dynamic CArrayObj management, and strict confirmation rules—the indicator maintains deterministic behavior under live market conditions. Testing across multiple instruments and timeframes has demonstrated stable detection, timely structural resolution, and consistent chart clarity without projection bias. Rather than serving as a standalone decision engine, this implementation is best applied as a structural analysis component within a broader trading framework. Traders are encouraged to validate its behavior under their own market conditions and integrate it alongside existing strategies, risk models, and confirmation tools to enhance contextual price action analysis.
In doing so, wedge formations evolve from subjective visual patterns into objectively defined, state-aware structures that can complement disciplined trading methodologies.
Warning: All rights to these materials are reserved by MetaQuotes Ltd. Copying or reprinting of these materials in whole or in part is prohibited.
This article was written by a user of the site and reflects their personal views. MetaQuotes Ltd is not responsible for the accuracy of the information presented, nor for any consequences resulting from the use of the solutions, strategies or recommendations described.

- Free trading apps
- Over 8,000 signals for copying
- Economic news for exploring financial markets
You agree to website policy and terms of use