Discussing the article: "Price Action Analysis Toolkit Development (Part 56): Reading Session Acceptance and Rejection with CPI"
You are missing trading opportunities:
- Free trading apps
- Over 8,000 signals for copying
- Economic news for exploring financial markets
Registration
Log in
You agree to website policy and terms of use
If you do not have an account, please register
Check out the new article: Price Action Analysis Toolkit Development (Part 56): Reading Session Acceptance and Rejection with CPI.
This article presents a session-based analytical framework that combines time-defined market sessions with the Candle Pressure Index (CPI) to classify acceptance and rejection behavior at session boundaries using closed-candle data and clearly defined rules.
If you have ever watched a football match, you will notice that the team that wins is not always the one that played better. A team can dominate possession, create more chances, and apply constant pressure, yet still lose the game. What most people remember is the final score, but the full story of how the match was played often remains hidden. Candlesticks work in the same way. Many people look only at candle color and stop there. CPI acts like the hidden match statistics, revealing the pressure inside the candle that price color alone does not show.
It is calculated from the candle’s high, low, and close, as shown in the formula below.
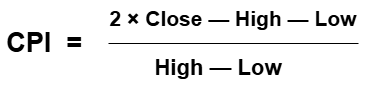
The CPI values are normalized within a fixed range of −1 to +1, allowing pressure strength to be compared consistently across candles.Test Outcomes
After successfully developing the indicator, we tested it and obtained the following results.
Author: Christian Benjamin