
Developing Advanced ICT Trading Systems: Implementing Order Blocks in an Indicator

- 1.1: Fundamentals of Order Block Creation
- 1.1.1: Price Action-Based Logic (Basic Level)
- 1.1.2: Price Action-Based Logic and Indicators (Intermediate Level)
- 2.0: Developing the Order Blocks indicator
- 2.1: Configuring Inputs and Indicator Parameters
- 2.2: Creating Key Structures and Functions
- 2.3: Order Block Detection Logic
- 2.4: Visualization: Colors and Verifying Order Block Mitigation
- 2.5: Implementing Alerts for Order Block Mitigation and Object Removal
1.0: Introduction
Welcome and thank you for reading this article. Today you will learn how to develop an indicator based on the order block theory of Smart Money Concepts and Inner Circle Trader.
1.1: Fundamentals of Order Block Creation
Order Blocks are zones on the chart where pending orders are likely waiting to be filled.
This typically occurs when a large market participant, such as a financial institution, wants to enter a significant position but lacks sufficient liquidity to execute the entire order at once without impacting the market. According to the basic laws of supply and demand, executing a portion of the order drives the price higher (in the case of a buy) in an aggressive search for sellers who can provide the liquidity needed to complete the trade.
Because the institutional participant cannot execute the full order in one go without causing a substantial price shift, they break the order into smaller parts. This allows them to complete the trade without the price moving significantly before they've fully entered their position.
From this concept, we can identify these zones on a price chart as areas of strong imbalance between supply and demand (whether for buying or selling). Below, we'll explore three ways to identify these zones and how to implement them in code.
1.1.1: Price Action-Based Logic (Basic Level)
Before diving into the logic behind order blocks, let's briefly review the components of a candlestick, which is essential for understanding the mechanics.
A candlestick consists of four price points:
| Price | Description |
|---|---|
| High | The maximum price reached during the candlestick's time frame |
| Low | The minimum price reached during the candlestick's time frame |
| Open | The price at which the candlestick opens |
| Close | The price at which the candlestick closes |
Let's look at an example on the chart to better understand this:

To start, according to order block theory, the first important element is identifying a market imbalance. This imbalance is often visible on the chart as a sequence of multiple consecutive candlesticks in the same direction, indicating a clear trend.
Example: Upward trend with 4 consecutive candlesticks
In this case, we'll focus on an uptrend formed by four consecutive bullish candlesticks, following these rules:
| Candlestick | Description |
|---|---|
| Previous candlestick | This candlestick precedes the upward movement of 4 consecutive candlesticks. It typically closes below the starting level of the upward movement. |
| First candlestick | Marks the beginning of the upward movement. Its close is above the open of the previous candlestick. |
| Second, Third, and Fourth candlesticks | These candlestick continue the upward momentum, each closing above the previous candlestick's close. |
Rules:
- Upwrad Movement Condition: To qualify as a valid movement, the four candlesticks must be consecutively bullish. The first candlestick starts the imbalance, and the following ones confirm it.
- Order Block Identification: The order block is identified in the zone encompassing the previous candle and the first bullish candle, representing the area where buyers took control.
Below, we can see a graphical example showing four consecutive bullish candles, clearly indicating a price imbalance.

Rules for identifying Order Blocks based on consecutive candlesticks:
| Aspect | Bullish Order Block | Bearish Order Block |
|---|---|---|
| Candlestick Condition | Candlesticks 1, 2, 3, and 4 must all be bullish. Each closes above its open. | Candlesticks 1, 2, 3, and 4 must all be bearish. Each closes below its open. |
| Extremum Validation of Candlestick 2 | The low of candlestick 2 must be above the midpoint of candlestick 1's body. (Exception: Hammer) | The high of candlestick 2 must be below the midpoint of candlestick 1's body. (Exception: Inverted hammer) |
| Candlestick 2 Body Condition | At least 40% of body of candlestick 2 must exceed the high of candlestick 1. | At least 40% of body of candlestick 2 must be below the low of candlestick 1. |
| Extremum Validation of Candlestick 3 | The low of candlestick 3 must be above 25% of 2nd candlestick's body. | The high of candlestick 3 must be below 25% of 2nd candlestick's body. |
| Candlestick 3 Body Condition | Half of 3rd candlestick's body must exceed the high of candlestick 2. | Half of 3rd candlestick's body must be below the low of candlestick 2. |
Purpose of the rules:
These criteria are designed to ensure that the 4-candlestick pattern is strong enough to validate an Order Block and to confirm that the pending orders within the zone have not yet been filled.
1.1.2: Price Action-Based Logic and Indicators (Intermediate Level)
In this more advanced approach, we not only rely on price action but also apply indicators to validate the strength of the movement, specifically, the indicator of volume.
Principles of the Strategy
As previously discussed, significant market movements often begin with relatively low volume, followed by a sharp increase in volume once major orders are executed. This volume surge typically spans 2 or 3 candlesticks, signaling the formation of an Order Block.
We can break down this logic into two main scenarios:
Case 1: Order Block with Increasing Volume
In this scenario, the Order Block is formed when volume begins to rise significantly. The conditions are as follows:
- Start of movement: It begins by a low-volume candlestick that marks the beginning of accumulation.
- Volume increase: On the next candlestick, volume increases significantly, signaling order execution. This increase may persist over 2 to 3 consecutive candlesticks.
- Order Block confirmation: The Orde Block is identified in the zone where volume begins to increase and pending orders are presumed to have been filled.
Bullish Example:

Bearish example:

Case 2: Order Block with a single volume spike
In this case, the Order Block is identified when a significant volume spike is observed in a key candlestick, referred to as the first candlestick. The order block pattern is validated through both price action and volume analysis and consists of 3 consecutive candlesticks - either bullish or bearish.
Rules:
| Aspect | Bullish Order Block | Bearish Order block |
|---|---|---|
| Volume spike on candlestick 1 | Candlestick 1 must have the highest volume among the three and its volume must exceed both the prior candlestick and candlestick 2. | Candlestick 1 must have the highest volume among the three and its volume must exceed both the prior candlestick and candlestick 2. |
| Checking the Extremum of Candlestick 2 | The low of candlestick 2 must be above the midpoint of body candlestick 1, indicating the Order Block accumulation zone remains untouched. (Exception: if candlestick 1 is a hammer) | The high of candlestick 2 must be below the midpoint of body candlestick 1, indicating the Order Block accumulation zone remains untouched. (Exception: if candlestick 1 is an inverted hammer) |
| Condition 60% candlestick body 2 | 60% of 2nd candlestick's body must extend above the high of candlestick 1, indicating continuation of bullish momentum. | 60% of 2nd candlestick's body must be below the low of candlestick 1, indicating continuation of bearish momentum. |
| Checking the Extremum of Candlestick 3 | The high of candlestick 3 must be higher than the open price of candlestick 2, confirming continued bearish momentum. | The low of candlestick 3 must be lower than the open price of candlestick 2, confirming continued bullish momentum. |
Bullish Example:

Bearish example:

2.0: Developing the Order Blocks indicator
2.1: Configuring Inputs and Indicator Parameters
Finally, after covering a substantial amount of theory, we're moving on to the part many of you have likely been waiting for - coding everything we've learned so far.
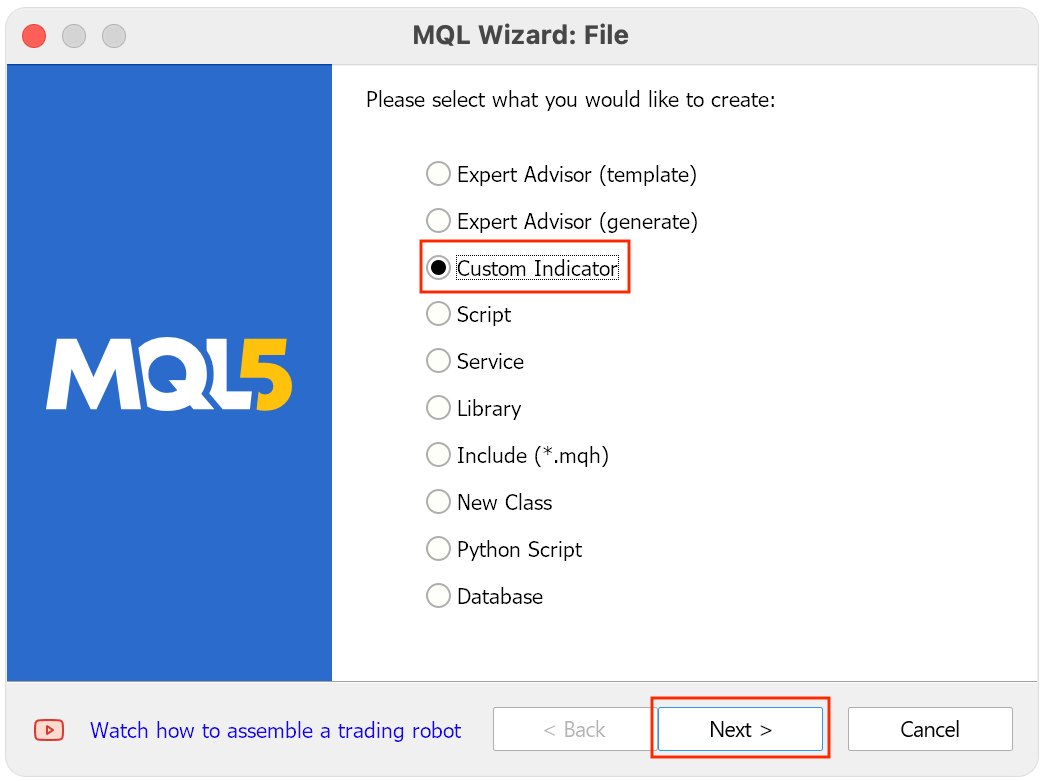
1. We start by crating a new program of type "Custom Indicator":
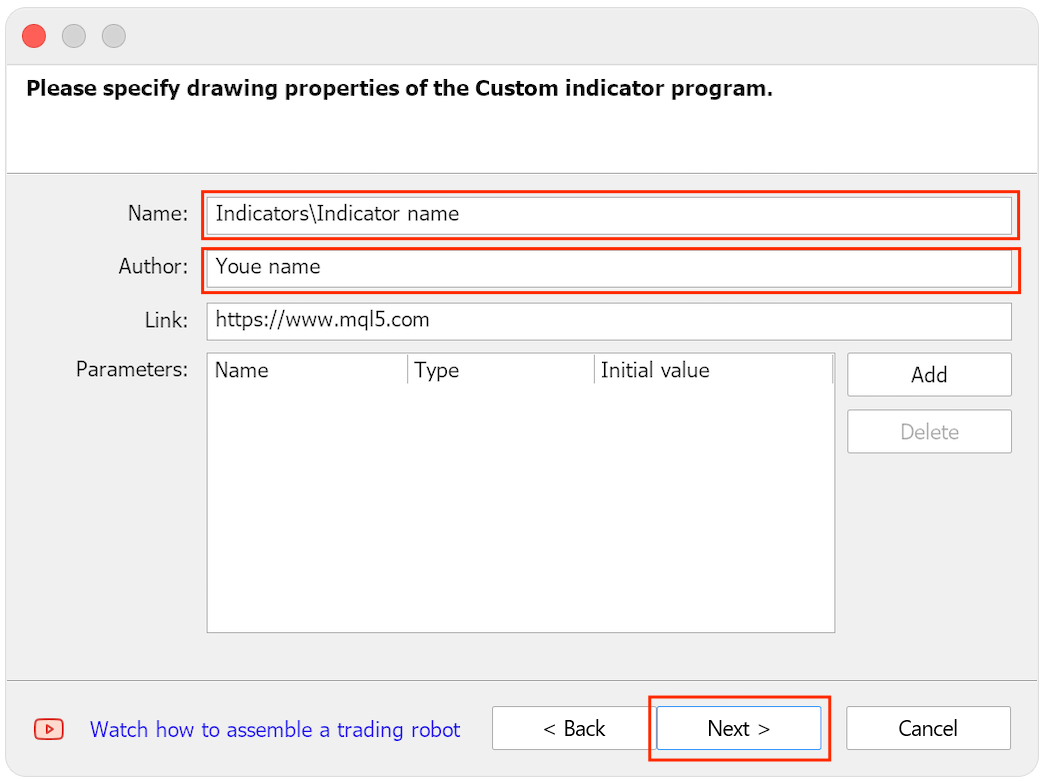
2. Next we write the name of the indicator and the name of the author.
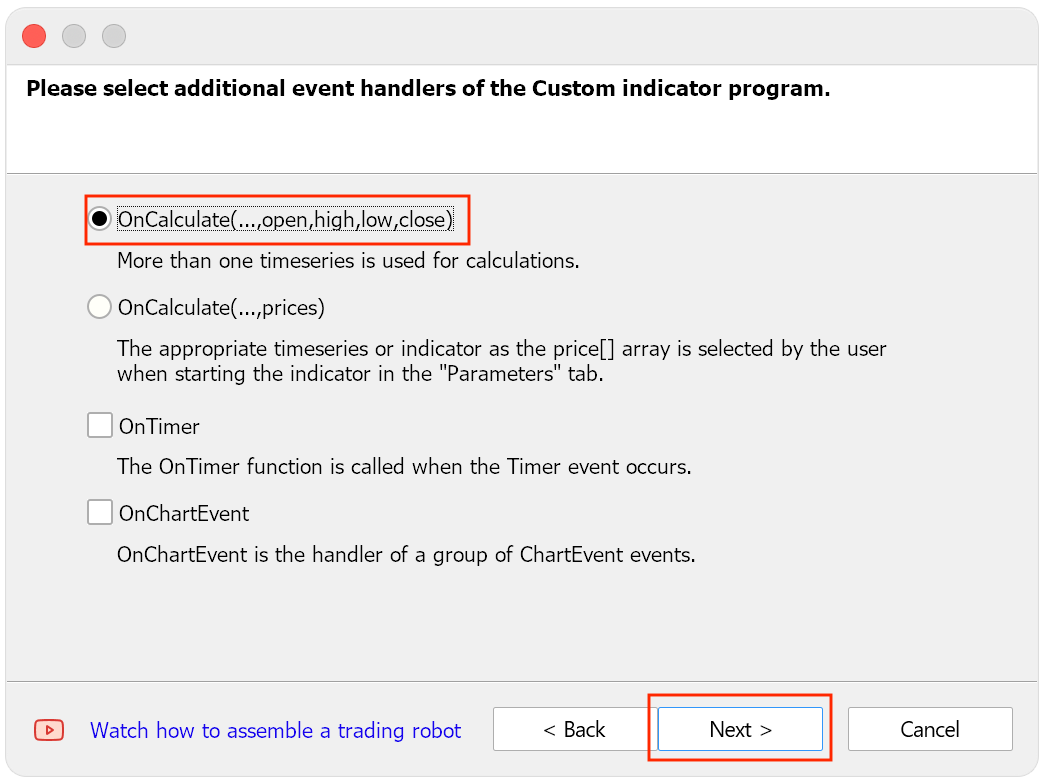
3. Then we select "OnCalculate()" for subsequent calculations.
4. Press Done to finish.
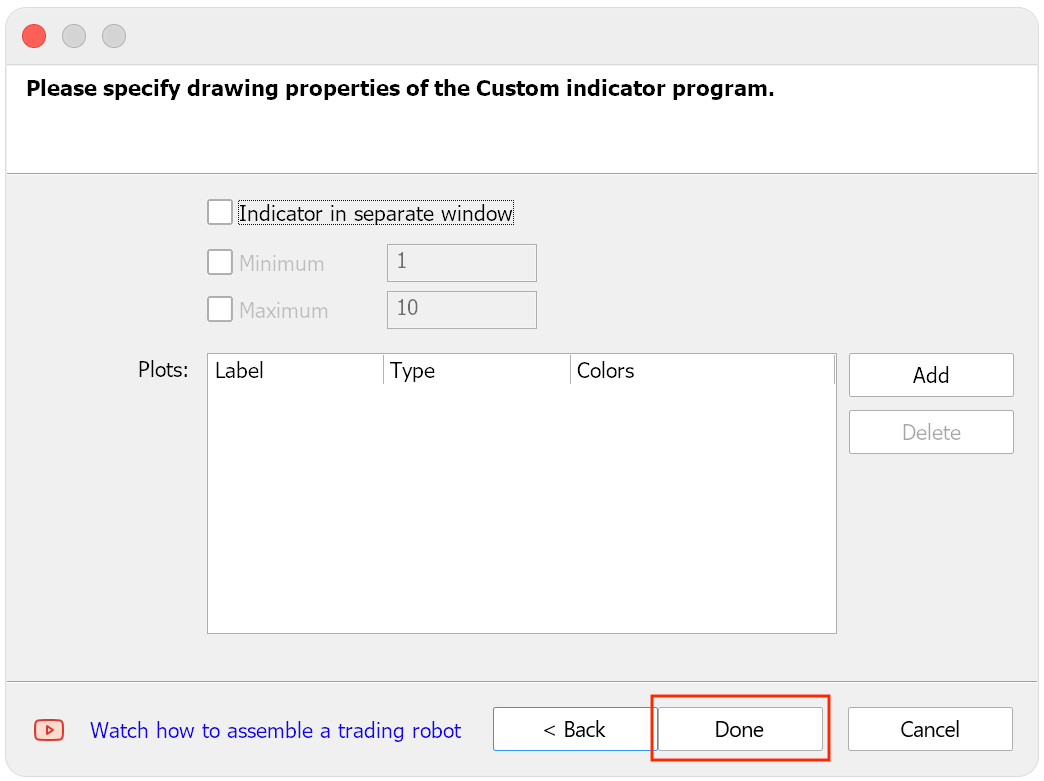
At this stage, we won't define any plots yet.
indicator_buffers
indicator_plots
To avoid the error: "no indicator plot defined for indicator00"
we add the following placeholder code at the top:
#property  indicator_buffers 1
#property  indicator_plots 1
This will remove the warning, allowing us to proceed with configuration and logic implementation.
Let's configure our inputs first:
Colors for bullish and bearish order blocks:
These settings allow users to choose the colors that will visually represent bullish and bearish Order Blocks, making it easier to distinguish them at a glance.
Rectangle customization options:
These options control how the rectangles used to mark Order Blocks are displayed:
- Border width: Sets the thickness of the rectangle borders.
- On the background: Defines whether the rectangle appears behind or on top of the candlesticks.
- Selectable: Allows users to enable or disable the ability to click and move the rectangles on the chart.
Order Block search range:
This parameter defines how many bars back from the current candlestick the indicator will search for valid Order Blocks. Adjusting this allows the indicator to adapt to different strategies or timeframes.
Organizing Inputs with Grouping:
Inputs are adjustable parameters that the user can modify outside the program. To enhance readability and organization, we use the following concept:
sinput Using the above keyword allows us to better organize the parameters by grouping them into categories using the property:
group
This not only improves the structure of the code, but also makes it easier for the user to recognize the different sets of parameters related to specific aspects of the indicator, such as setting up rectangles or analyzing order blocks.
sinput group "--- Order Block Indicator settings ---"
input          int  Rango_universal_busqueda = 500; // Universal range for searching order blocks
input          int  Witdth_order_block = 1;         // Width of the order block lines

input          bool Back_order_block = true; // Enable object to be drawn in the background
input          bool Fill_order_block = true; // Enable fill for the order block rectangle

input          color Color_Order_Block_Bajista = clrRed;   // Assign red color for bearish order block
input          color Color_Order_Block_Alcista = clrGreen; // Assign green color for bullish order block
2.2: Creating Key Structures and Functions
In this section, we will define the main structures and functions for managing order blocks in our indicator. This will allow us to store and organize key information for each order block, and manage data efficiently using dynamic arrays.
1. Variable for storing the time of the last candlestick
First we will create a variable that will store the time of the last candle processed. This is necessary to avoid duplication of order blocks on the same candlestick and to ensure correct tracking over time.
datetime tiempo_ultima_vela;
2. Handler for the ATR indicator:
The second step is to create an indicator handler:
ATR (Average True Range)
This will help us measure market volatility and complement the indicator's logic. This handler is initialized at the very beginning so that it can be used in the calculation of order blocks.
int atr_i;
3. Creating a structure for storing order block data
Now we will create a structure that will store the relevant data for each order block. This structure is very important as it contains information about the time, prices, the name of the block and whether it was mitigated or not. In addition, we will create a dynamic array that will store all the detected order blocks.
struct OrderBlock
{
   datetime time1;      // Time of the candle prior to the first candle of the order block
   double price1;       // Upper price level of the order block (level 1)
   double price2;       // Lower price level of the order block (level 2)
   string name;         // Name of the order block
   bool mitigated;      // Status of the order block (true if mitigated, false if not)
};
Description of Structure Fields
The OrderBlock structure consists of the following fields:
-
time1: This field stores the time of the candlestick preceding the first candlestick of the order block. It is useful to know when a block was formed and to compare the time.
-
price1: Represents the high price or the first key price of the order block. This will be the high price in case of a bullish order block.
-
price2: Represents the low price or the second key price of the order block. This is the low price in case of a bullish order block.
-
name: Will store a unique name for identifying order blocks on the chart. This name will be used to clearly label the block and make it visually recognizable.
-
mitigated: Indicates whether the order block has been mitigated or not. If the order block was mitigated (i.e. the price touched or exceeded the block levels), this value will be true, otherwise false.
4. Dynamic array to store order blocks
Finally, we will create a dynamic array containing all identified order blocks. These arrays will allow us to store multiple blocks in memory and manage them dynamically, turning order blocks on or off as needed over time.
OrderBlocks ob_bajistas[];
OrderBlocks ob_alcistas[];
The OnInit() function:
The OnInit() function is responsible for initializing all the elements of the indicator and performing checks to make sure everything is ok before the indicator starts working. Below we will explain step by step what is happening in the code.
1. Initialize Variables
At the beginning, the initial value of the variable is set:
"tiempo_ultima_vela" A 0. This variable is important because it will store the time of the last processed candlestick, which will avoid duplication and properly manage the indicator flow.
tiempo_ultima_vela = 0; Then the indicator handler is launched:
"ATR" (Average True Range) The ATR period is 14 candlesticks. ATR will then be used to measure market volatility and will contribute to the logic of order blocks.
atr_i = iATR(_Symbol, PERIOD_CURRENT, 14);
2. Checking Input Parameters
After initialization, the code checks the value of the following variable:
Rango_universal_busqueda
It's less than 40. This variable defines the range in which the indicator will search for order blocks. If this range is too small, it may affect the accuracy and effectiveness of the indicator, so a warning message is displayed and the indicator stops, returning the INIT_PARAMETERS_INCORRECT value.
if (Rango_universal_busqueda < 40)
{
   Print("Search range too small");
   return (INIT_PARAMETERS_INCORRECT);
}
This check allows you to ensure that the search range is of the appropriate size for the indicator to work properly, and to avoid incorrect settings that may affect its operation.
3. Checking the Initialization of the ATR Indicator
The next step is to check if the initialization of the ATR indicator handler is correct.
If:
"atr_i" Equals:
INVALID_HANDLE This means that an error occurred while trying to create the indicator, so an error message is displayed and the following is returned:
INIT_FAILED This terminates the indicator.
if (atr_i == INVALID_HANDLE)
{
   Print("Error copying data for indicators");
   return (INIT_FAILED);
}
4. Resizing of Dynamic Arrays
The dynamic arrays that store bearish and bullish order blocks are resized as necessary, while their initial size is set to 0. This ensures that both arrays are empty at the start of the program, ready to store new order blocks.
ArrayResize(ob_bajistas, 0);
ArrayResize(ob_alcistas, 0);
Using dynamic arrays is very important to control the number of detected order blocks, as it allows these arrays to grow or shrink as needed.
Initialization Completed Successfully
If all checks and initializations are completed without errors, then the function:
OnInit() Returns:
INIT_SUCCEEDED This means that the indicator is properly initialized and ready to start running on the chart.
return (INIT_SUCCEEDED);
Complete code:
int OnInit()
  {
//--- indicator buffers mapping
   tiempo_ultima_vela = 0;
   atr_i = iATR(_Symbol,PERIOD_CURRENT,14);

   if(Rango_universal_busqueda < 40)
     {
      Print("Search range too small");
      return (INIT_PARAMETERS_INCORRECT);
     }

   if(atr_i== INVALID_HANDLE)
     {
      Print("Error copying data of indicators");
      return(INIT_FAILED);
     }

   ArrayResize(ob_bajistas,0);
   ArrayResize(ob_alcistas,0);


//---
   return(INIT_SUCCEEDED);
  }
Now we'll add code to the indicator's deinitialization event to free up memory:
void OnDeinit(const int reason)
  {
//---
  Eliminar_Objetos();

  ArrayFree(ob_bajistas);
  ArrayFree(ob_alcistas);

  }
Eliminar_Objetos();
This will be the function we will use later to remove any rectangles we create.
Checking for the Appearance of a New Candlestick
The purpose of this code is to optimize the indicator by ensuring that it only executes when a new candlestick opens, rather than every time the price changes. Running an indicator every time the price changes would waste computer resources, especially if we are analyzing multiple assets or using multiple indicators.
To do this, the time of the last processed candlestick is checked. If a new candlestick is detected, the indicator processing is activated. Below is a description of each part of the code.
1. Initialization
We have a bool variable:
"new_vela" It acts as a trigger. The default value is false which means no new candlestick has been opened.
bool new_vela = false; // We assign the trigger that tells us whether a new candle has opened to false
2. Checking for the emergence of a new candlestick
The next step is to check the time of the last processed candlestick:
tiempo_ultima_vela
Check if it differs from the time of the current candlestick on the chart. Function:
iTime() Returns the open time of a specified candlestick, in this case the most recent candle (which is indexed as 0). If the time does not match, it means that a new candlestick has appeared.
if(tiempo_ultima_vela != iTime(_Symbol, PERIOD_CURRENT, 0)) // Check if the current time is different from the stored time
{
    new_vela = true;                                        // If it doesn't match, set the new candle indicator to true
    tiempo_ultima_vela = iTime(_Symbol, PERIOD_CURRENT, 0); // Update the last processed candle time
}
This block of code performs two tasks:
- Checks whether a new candlestick has formed.
- Updates the last_sail_time variable with the time of the new candlestick for future use.
Executing the main code
If variable:
new_vela
is true, this means a new candle has opened. In this case, we can execute the main indicator code that handles order blocks, or any other appropriate logic. By performing this check, we avoid executing the code on every price tick, but only when a new candlestick appears on the chart.
if(new_vela == true)
{
   // Here we will place the main code of the indicator that will run only when a new candlestick opens
}
Creating Arrays to Store Candlestick, Volume, and ATR Data
This block includes arrays that store key information about candlesticks, tick volume, and ATR. This data is necessary for price behavior analysis and identification of order blocks.
1. Declaring Arrays
We declare arrays of types double, datetime, and long to store the corresponding values:
double openArray[];  // Stores Open price of candlesticks
double closeArray[]; // Stores Close price of candlesticks
double highArray[];  // Stores High price of candlesticks
double lowArray[];   // Stores Low price of candlesticks
datetime Time[];     // Stores the time of each candlestick
double atr[];        // Stores ATR values, which indicator market volatility
long Volumen[];      // Stores tick volume, representing the number of transactions in each candlestick
2. Setting Up Arrays as Time Series
We use the ArraySetAsSeries() function to make arrays act as time series. This means that index 0 will represent the most recent candlestick, making it easier to access the latest candlestick data:
ArraySetAsSeries(openArray, true);
ArraySetAsSeries(closeArray, true);
ArraySetAsSeries(highArray, true);
ArraySetAsSeries(lowArray, true);
ArraySetAsSeries(Time, true);
ArraySetAsSeries(Volumen, true);
ArraySetAsSeries(atr, true);
3. Copying Candlestick and ATR Data
Then we use functions CopyOpen, CopyClose, CopyHigh, CopyLow, CopyTime and CopyTickVolume to copy the candlestick and tick volume data into the desired arrays. CopyBuffer is also used to obtain ATR values:
int copiedBars = CopyOpen(_Symbol, PERIOD_CURRENT, 0, (Rango_universal_busqueda * 2), openArray);
if(copiedBars < 0)
{
    Print("Error copying data from Open: ", GetLastError());
}
CopyClose(_Symbol, PERIOD_CURRENT, 0, (Rango_universal_busqueda * 2), closeArray);
CopyHigh(_Symbol, PERIOD_CURRENT, 0, (Rango_universal_busqueda * 2), highArray);
CopyLow(_Symbol, PERIOD_CURRENT, 0, (Rango_universal_busqueda * 2), lowArray);
CopyTime(_Symbol, PERIOD_CURRENT, 0, (Rango_universal_busqueda * 2), Time);
CopyTickVolume(_Symbol, PERIOD_CURRENT, 0, (Rango_universal_busqueda * 2), Volumen);
CopyBuffer(atr_i, 0, 0, (Rango_universal_busqueda * 2), atr);
4. Error Handling
When copying open data, we check whether the number of bars copied is negative, which indicates an error. In this case, to help debug, an error message is displayed using the GetLastError() function.
Preparing to Code the Order Block Detection Logic
Before implementing the order blocks detection logic, we will implement a number of necessary preparations:
-
Detecting Previous Bullish Candlesticks: We will create a function that identifies whether there are bullish candlesticks prior to the first candlestick of the pattern. If found, we will assign the value of this first candlestick to the closest one, allowing us to draw the Order Block from the beginning of the move.
-
Drawing Rectangles: We implement a special function to draw rectangles to visually represent order blocks on the chart.
-
Array Management: We will develop functions to add the detected order blocks into the corresponding arrays. This includes:
- Checking Duplication: A function that allows you to make sure that the order block that we are trying to add has not been recorded before. So only new order blocks will be added.
-
Order Block Mitigation: We will create a function that checks whether an Order Block has been mitigated.
-
Order Block Removal: We will add a function to mark order blocks as removed to keep our notifications tidy and clean.
With these functions we can start adding order blocks into arrays and ensure that only new blocks are registered. From this point on, we will not provide line-by-line explanations due to the amount of code, but instead provide a brief description of each relevant section.
1. Function
//+------------------------------------------------------------------+
//|     Functions to Manage and Add Values to the Arrays             |
//+------------------------------------------------------------------+
void AddIndexToArray_alcistas(OrderBlocks &newVela_Order_block_alcista)
  {
   if(!IsDuplicateOrderBlock_alcista(newVela_Order_block_alcista))  // Here we check if the structure we are about to add already exists in the array
     {
      int num_orderblocks_alcista = ArraySize(ob_alcistas);         // We assign the variable "num_orderblocks_alcista" the current size of the ob_alcistas array
      ArrayResize(ob_alcistas, num_orderblocks_alcista + 1);        // Resize the array by increasing its size by 1 to make space for a new order block
      ob_alcistas[num_orderblocks_alcista] = newVela_Order_block_alcista; // Assign the new order block to the new index (last position) in the array
     }
  }

bool IsDuplicateOrderBlock_alcista(const OrderBlocks &newBlock)
  {
   for(int i = 0; i < ArraySize(ob_alcistas); i++) //Start a loop to go through all positions of the ob_alcistas array
     {
      if(ob_alcistas[i].time1 == newBlock.time1 &&
         ob_alcistas[i].name == newBlock.name
        ) // Check if both time1 and name of the order block already exist in the array
        {
         return true; // If they do, return true (i.e., it is a duplicate)
         break        // Exit the loop
        }
     }
   return false; // If no duplicate is found, return false
  }

// This would be the same logic but for bearish order blocks
void AddIndexToArray_bajistas(OrderBlocks &newVela_Order_block_bajista)
  {
   if(!IsDuplicateOrderBlock_bajista(newVela_Order_block_bajista))
     {
      int num_orderblocks_bajistas = ArraySize(ob_bajistas);
      ArrayResize(ob_bajistas, num_orderblocks_bajistas + 1);
      ob_bajistas[num_orderblocks_bajistas] = newVela_Order_block_bajista;
     }
  }

bool IsDuplicateOrderBlock_bajista(const OrderBlocks &newBlock)
  {
   for(int i = 0; i < ArraySize(ob_bajistas); i++)
     {
      if(ob_bajistas[i].time1 == newBlock.time1 &&
         ob_bajistas[i].name == newBlock.name
        )
        {
         return true; // Duplicate found
         break;
        }
     }
   return false;      // No duplicate found
  }
Now that we have implemented the functions that will help us check if order block is not a duplicate and add it to the dynamic array, it's time to explain how we will draw these order blocks on the chart.
For this, we will use two key prices points:
-
Price 1: In case of a bullish order block, this price will represent the base of the rectangle. For a bearish order block, this will be the upper parallel side.
-
Price 2: In a bullish order block, this price will correspond to the upper parallel side of the rectangle. In the bearish order block, this will be the base of the rectangle.
Bullish Example:

Bearish example:

Let's mnow move on to demonstrating functions for mitigation in order blocks.
//+------------------------------------------------------------------+
//|             Functions for Order Blocks                           |
//+------------------------------------------------------------------+
datetime  mitigados_alcsitas(double price, double &openArray[], double &closeArray[], double &highArray[], double &lowArray[], datetime &Time[], datetime start, datetime end)
  {
   int startIndex = iBarShift(_Symbol,PERIOD_CURRENT,start); // Using iBarShift we find the index of the candle by passing the "start" time
   int endIndex = iBarShift(_Symbol, PERIOD_CURRENT, end);   // Using iBarShift we find the index of the candle by passing the "end" time
   NormalizeDouble(price,_Digits); // Normalize the price we will work with

   for(int i = startIndex - 2 ; i >= endIndex + 1 ; i--) // Start a loop from start (time1 of the order block) to end (time[1])
     {
      //terminated by endIndex which will be time[0] + 1 = time[1]  --> We are searching for mitigation from past to present (backward)
      NormalizeDouble(lowArray[i],_Digits);
      NormalizeDouble(openArray[i],_Digits);
      NormalizeDouble(highArray[i],_Digits);
      NormalizeDouble(openArray[i],_Digits);
      //Normalizamos todas laas variable

      if(price > lowArray[i] || price > openArray[i] || price > closeArray[i] || price > highArray[i]) // Check if OHLC closed below price
        {
         return Time[i]; //If mitigation is found, return the time of the candle where it happened
         Print("el orderblock tuvo mitigaciones", TimeToString(end));
        }
     }

   return 0; //If no mitigation was found, return 0
  }

// the same in the bearish case but changing something
// instead of the price closing below the price
datetime  mitigado_bajista(double price, double &openArray[], double &closeArray[], double &highArray[], double &lowArray[], datetime &Time[], datetime start, datetime end)
  {

   int startIndex = iBarShift(_Symbol,PERIOD_CURRENT,start);
   int endIndex = iBarShift(_Symbol, PERIOD_CURRENT, end);
   NormalizeDouble(price,_Digits);
   for(int i = startIndex - 2 ; i >= endIndex + 1 ; i--)
     {
      NormalizeDouble(lowArray[i],_Digits);
      NormalizeDouble(openArray[i],_Digits);
      NormalizeDouble(highArray[i],_Digits);
      NormalizeDouble(openArray[i],_Digits);
      if(highArray[i] > price || closeArray[i] > price || openArray[i] > price || lowArray[i] > price)
        {

         return Time[i]; // returns the time of the candle found
         Print("el orderblock tuvo mitigaciones", TimeToString(end));

        }
     }

   return 0; // not mitigated so far
  }

datetime esOb_mitigado_array_alcista(OrderBlocks &newblock, datetime end)
  {
   int endIndex = iBarShift(_Symbol, PERIOD_CURRENT, end);
   NormalizeDouble(newblock.price2,_Digits);

   for(int i = 0 ; i <  endIndex -2  ; i++)
     {

      double low = NormalizeDouble(iLow(_Symbol,PERIOD_CURRENT,i),_Digits);
      double close = NormalizeDouble(iClose(_Symbol,PERIOD_CURRENT,i),_Digits);
      double open = NormalizeDouble(iOpen(_Symbol,PERIOD_CURRENT,i),_Digits);

      if((newblock.price2 >= low || newblock.price2 >= open) || newblock.price2 >= close)
        {
         newblock.mitigated = true;


         return iTime(_Symbol,PERIOD_CURRENT,i); // returns the time of the found candle
        }
     }

   return 0; // not mitigated so far
  }

datetime esOb_mitigado_array_bajista(OrderBlocks &newblock, datetime end)
  {

   int endIndex = iBarShift(_Symbol, PERIOD_CURRENT, end);
   NormalizeDouble(newblock.price2,_Digits);

   for(int i = 0 ; i<  endIndex -2  ; i++)
     {

      double high = NormalizeDouble(iHigh(_Symbol,PERIOD_CURRENT,i),_Digits);
      double close = NormalizeDouble(iClose(_Symbol,PERIOD_CURRENT,i),_Digits);
      double open = NormalizeDouble(iOpen(_Symbol,PERIOD_CURRENT,i),_Digits);

      if((high >= newblock.price2 || close >= newblock.price2) || open >= newblock.price2)
        {
         newblock.mitigated = true;
         // returns the time of the found candlestick
         return iTime(_Symbol,PERIOD_CURRENT,i);
        }
     }

   return 0; // not mitigated so far
  }
These functions are responsible for checking the state of order blocks:
-
Mitigation Check Function: This function checks for the mitigation of order blocks adn is used to evaluate the added structure.
-
Mitigation Activation Function: The second function, which includes the "array" keyword, activates the mitigation status for order blocks.
Next we will look at functions for drawing rectangles and finding the nearest bullish or bearish candlestick.
The function of determining the nearest bullish or bearish candlestick is very important. Its purpose is to ensure the correct detection of the corresponding candlestick when detecting order blocks, especially in situations where the order block is formed at the beginning of a strong movement. This will avoid false detection in the middle or at the end of a movement, which may reduce the effectiveness of the analysis.
Bullish Example:

Here are the functions:
//+------------------------------------------------------------------+
//|  Functions to find the nearest bullish or bearish candle         |
//+------------------------------------------------------------------+
int FindFurthestAlcista(datetime start, int numVelas)
  {
   int startVela = iBarShift(_Symbol, PERIOD_CURRENT, start); // Function to find the furthest bullish candle in a consecutive sequence
// Initialize variables
   int furthestVela = 0;
   int counter_seguidas = 0;

   for(int i = startVela  + 1; i <= startVela + numVelas ; i++)  // Since the candle at "start" is already known to be bullish, we skip it (+1)
     {
      //then it is obvious that the candle at time 1 is bullish (in this function), that's why we increase +1, then we check that i is less than or equal to the index of startVela + num candles
      //here num candles would be the number of candles to search for
      double Close = NormalizeDouble(iClose(_Symbol,PERIOD_CURRENT,i),_Digits); //we get the open by index
      double Open = NormalizeDouble(iOpen(_Symbol,PERIOD_CURRENT,i),_Digits);  //we get the close by index

      if(Close > Open || Close == Open)  // we check if it's a bullish candle (close > open), that is, the close must be greater than the open
        {
         counter_seguidas++; // if this is true, we increase a variable by 1, which we will use later
        }
      else
         if(Open > Close)
           {
            furthestVela = startVela  + 1 + counter_seguidas; //if the found candle is not bullish, it is obviously bearish, therefore we assign the index of the previous candle to the one that started the bullish move
            // startVela: is the candle we passed, then we add 1 because as we said before, we will draw the order block one candle before the bullish move (i.e., bearish candle)
            // to this we add the counter of consecutive candles

            break; // exit the loop
           }
     }

//we check if the body of the candle before the move is more than 30% larger than the candle that starts the move; if it is, we revert to the normal value
   double body1 = NormalizeDouble(iClose(_Symbol,PERIOD_CURRENT,(furthestVela -1)),_Digits) - NormalizeDouble(iOpen(_Symbol,PERIOD_CURRENT,(furthestVela -1)),_Digits);;
   double body_furtles =  NormalizeDouble(iOpen(_Symbol,PERIOD_CURRENT,furthestVela),_Digits) -  NormalizeDouble(iClose(_Symbol,PERIOD_CURRENT,furthestVela),_Digits);

   if(body_furtles > (1.3 * body1))
      furthestVela--;

   return furthestVela; // return the index of the found candle
  }

// Function to search for the furthest bearish candle with consecutive bearish candles
int FindFurthestBajista(datetime start, int numVelas)
  {
   int startVela = iBarShift(_Symbol, PERIOD_CURRENT, start); // Index of the initial candle
   int furthestVela = 0;     // Initialize variable
   int counter_seguidas = 0; // Counter of consecutive bearish candles

   for(int i = startVela + 1; i <= startVela + numVelas; i++)
     {
      double Close = NormalizeDouble(iClose(_Symbol, PERIOD_CURRENT, i), _Digits);
      double Open = NormalizeDouble(iOpen(_Symbol, PERIOD_CURRENT, i), _Digits);

      // If the candle is bearish
      if(Close < Open || Close == Open)
        {
         counter_seguidas++; // Increase the counter of consecutive bearish candles
        }
      // If the candle is bullish, we stop
      else
         if(Close > Open)
           {
            // Return the candle where the bearish sequence is interrupted by a bullish one
            furthestVela = startVela + 1 + counter_seguidas;
            break;
           }
     }

   return furthestVela;
  }
Now we just need to create a function to draw rectangles:
 void RectangleCreate(long chart_ID, string name, const int sub_window, datetime time1, double price1, datetime time2, double price2, color clr, int width, bool fill, bool back , ENUM_LINE_STYLE style , bool select = false)
  {
   ResetLastError(); // reset the error

 // check and create rectangles
   if(!ObjectCreate(chart_ID, name, OBJ_RECTANGLE, sub_window, time1, price1, time2, price2))
     {
      Print(__FUNCTION__, ": Failed to create a rectangle! Error code = ", GetLastError()  , "The name of the rectangle is: " , name); //if creation fails, print the function + error code and rectangle name
     }

  // set the properties of the rectangles
   ObjectSetInteger(chart_ID, name, OBJPROP_COLOR, clr);
   ObjectSetInteger(chart_ID, name, OBJPROP_STYLE, STYLE_SOLID);
   ObjectSetInteger(chart_ID, name, OBJPROP_WIDTH, width);
   ObjectSetInteger(chart_ID, name, OBJPROP_FILL, fill);
   ObjectSetInteger(chart_ID, name, OBJPROP_BACK, back);
   ObjectSetInteger(chart_ID, name, OBJPROP_SELECTABLE, select);
   ObjectSetInteger(chart_ID, name, OBJPROP_SELECTED, select);
   ObjectSetInteger(Chart_ID, name, OBJPROP_STYLE ,style);
  }
Once all these functions are ready, we will move on to the next part.
2.3: Order Block Detection Logic
The logic we developed for this system is as follows:
- Detect order blocks using the logic described above.
- Assign values to structures.
- Add structure to the array that will store order blocks.
- Check mitigation of order blocks.
- Draw order blocks.
- Alert.
First, we create structures to store the order block values:
- We create 4 variables that will have the form of the OrderBlocks structure.
- 2 to save bullish order blocks (indicator and Price Action order blocks).
- 2 to save bearish order blocks (indicator and Price Action order blocks).
OrderBlocks  newVela_Order_block_alcista;
OrderBlocks  newVela_Order_block_volumen;
OrderBlocks newVela_Order_Block_bajista;
OrderBlocks newVela_Order_Block_bajista_2;
After adding these structures, we already have variables in which the order block values will be stored.
Now we just use logic to detect order blocks. So, let's begin.
We'll start with logic:
- We need to search for order blocks in the candlestick range and assign them an index, which is similar to searching for a candlestick pattern with the conditions we set in the logic.
- For this we will use 'for' loop.
Here's the code:
for(int i = Rango_universal_busqueda  ; i  > 5  ; i--)
   {

//checking errors
if(i + 3> ArraySize(highArray)  || i + 3 > ArraySize(atr))
continue;
if(i < 0)
continue;

//--------Variable Declaration--------------------------------------------//

// Update candle indices
int one_vela = i ; // central candlestick
int  vela_atras_two = i +2;
int vela_atras_one = one_vela +1;
int two_vela = one_vela - 1;
int tree_vela = one_vela - 2;
int four_vela = one_vela -3;

NormalizeDouble(highArray[vela_atras_one],_Digits);
NormalizeDouble(lowArray[vela_atras_one ], _Digits);
NormalizeDouble(closeArray[vela_atras_one ],_Digits);
NormalizeDouble(openArray[vela_atras_one ],_Digits);

NormalizeDouble(highArray[two_vela],_Digits);
NormalizeDouble(lowArray[two_vela], _Digits);
NormalizeDouble(closeArray[two_vela],_Digits);
NormalizeDouble(openArray[two_vela],_Digits);

NormalizeDouble(highArray[tree_vela],_Digits);
NormalizeDouble(lowArray[tree_vela], _Digits);
NormalizeDouble(closeArray[tree_vela],_Digits);
NormalizeDouble(openArray[tree_vela],_Digits);

NormalizeDouble(highArray[one_vela],_Digits);
NormalizeDouble(lowArray[one_vela], _Digits);
NormalizeDouble(closeArray[one_vela],_Digits);
NormalizeDouble(openArray[one_vela],_Digits);

// Calculate average body size of previous candles
double body1 = closeArray[one_vela] - openArray[one_vela];
double body2 = closeArray[two_vela] - openArray[two_vela];
double body3 = closeArray[tree_vela] - openArray[two_vela];

// Volume condition
long Volumen_one_vela = Volumen[one_vela];
long Volumen_two_vela = Volumen[two_vela];
long volumen_vela_atras_one = Volumen[vela_atras_one];
- Basically, in this code we are creating a loop that will move from the maximum value of the candlestick, which will be:
(Rango_universal_busqueda)
and ends at index 6:
i > 5 In the case i > 5
We subtract 1 from the value of i.
- We massively normalize the OHCL of the candlesticks we will work with.
- We assign the candlestick body as: close - open.
- We obtain the tick value, this only for the peak case:
//Volume
long Volumen_one_vela = Volumen[one_vela];
long Volumen_two_vela = Volumen[two_vela];
long volumen_vela_atras_one = Volumen[vela_atras_one];
Now we'll add one more case, that's atr which we basically analyze to see strong price movements in one direction.
- In this code snippet, which is shown below, you can see the basic logical conditions and the atr indicator:
//Boolean variables to detect if the case is met (only Price Action)
bool esVelaCorrecta_case_normal =false;
bool  esVela_Martillo = false;

//Here we check that 4 consecutive bullish candles have formed with close > open
if(
   closeArray[one_vela] > openArray[one_vela] &&
   closeArray[two_vela] > openArray[two_vela] &&
   closeArray[tree_vela] > openArray[tree_vela] &&
   closeArray[four_vela] > openArray[four_vela]
)
  {

   esVelaCorrecta_case_normal =true; // if true, assign true to "esVelaCorrecta_case_normal"
  }
else
   esVelaCorrecta_case_normal =false; // otherwise assign false

bool fuerte_movimiento_alcista =false; // create a variable that activates only if a strong bullish movement occurs

// Check if a movement of 6 consecutive bullish candles was created
if(
   closeArray[one_vela + 2] > openArray[one_vela + 2] &&
   closeArray[one_vela + 1] > openArray[one_vela +1] &&
   closeArray[one_vela] > openArray[one_vela] &&
   closeArray[two_vela] > openArray[two_vela] &&
   closeArray[tree_vela] > openArray[tree_vela] &&
   closeArray[four_vela] > openArray[four_vela]
)
  {
   fuerte_movimiento_alcista = true; // if true assign true to "fuerte_movimiento_alcista"
  }

//verificamos si es vela martillo
if(openArray[one_vela] - lowArray[one_vela] > closeArray[one_vela] - openArray[one_vela]) // check if lower wick is larger than the candle body
  {
   esVela_Martillo = true; // if so set "esVela_Martillo" to true
  }

bool atr_case = false;

if(atr[vela_atras_two] > atr[one_vela] && atr[two_vela] > atr[one_vela] && atr[two_vela] > atr[vela_atras_two] && closeArray[one_vela] > openArray[one_vela]
   && closeArray[four_vela] > openArray[four_vela] && closeArray[tree_vela] > openArray[tree_vela])
   atr_case = true;  // in this code we look for ATR to first fall in one candle
//then rise, and candles 1, 3, 4 must be bullish; second candle not necessary for this case

//Verification for normal case
if((esVelaCorrecta_case_normal == true && ((lowArray[two_vela] > ((body1 *0.5)+openArray[one_vela]) && ((body2 * 0.4)+openArray[two_vela]) > highArray[one_vela]) || esVela_Martillo == true)
    && lowArray[tree_vela] > ((body2 * 0.25) +openArray[two_vela])) || fuerte_movimiento_alcista == true || atr_case == true)
  {
   int furthestAlcista = FindFurthestAlcista(Time[one_vela],20); // call function to find previous bullish candles before "one_vela"
   if(furthestAlcista > 0) // whether or not found, will be > 0 since it returns previous candle index if none found
     {

      datetime time1 = Time[furthestAlcista];     //assign time of furthestAlcista candle to time1
      double price2 = openArray[furthestAlcista]; //assign open of furthestAlcista as price2 (usually drawn on a bearish candle)
      double price1 = lowArray[furthestAlcista];  //assign low of furthestAlcista as price1

      //assign mentioned variables to the structure
      newVela_Order_block_alcista.price1 = price1;
      newVela_Order_block_alcista.time1 = time1;
      newVela_Order_block_alcista.price2 = price2;

      case_OrderBlockAlcista_normal = true; //if all true, activate normal bullish case
     }
   else
      case_OrderBlockAlcista_normal =false;

  }
//versión bajista

bool case_OrderBlockBajista_normal = false;
bool case_OrderBlockBajista_volumen = false;

//---------------Conditions for Order Blocks--------------------//
//+------------------------------------------------------------------+
//| Conditions For Bearish Order Block case_normal                   |
//+------------------------------------------------------------------+
if(closeArray[one_vela] < openArray[one_vela]  &&
   closeArray[two_vela] < openArray[two_vela]  &&
   closeArray[tree_vela] < openArray[tree_vela]  &&
   closeArray[one_vela-3]< openArray[one_vela-3]
  )
  {
   esVelaCorrecta_case_normal =true;
  }
else
   esVelaCorrecta_case_normal =false;

bool a = false;

if(atr[vela_atras_two] > atr[one_vela] && atr[two_vela] > atr[one_vela] && atr[two_vela] > atr[vela_atras_two] && esVelaCorrecta_case_normal)
   a= true;

bool fuerte_movimiento_bajista =false;

if(
   closeArray[one_vela + 2] < openArray[one_vela + 2] &&
   closeArray[one_vela + 1] < openArray[one_vela +1] &&
   closeArray[one_vela] < openArray[one_vela] &&
   closeArray[two_vela] < openArray[two_vela] &&
   closeArray[tree_vela] < openArray[tree_vela] &&
   closeArray[one_vela - 3] <= openArray[one_vela - 3]
)
  {
   fuerte_movimiento_bajista = true;
  }

// Verification for normal bearish case
if((esVelaCorrecta_case_normal == true && highArray[two_vela] < ((body1 *0.70)+closeArray[one_vela]) && ((body2 * 0.4)+closeArray[two_vela]) < lowArray[one_vela] && highArray[tree_vela] < highArray[two_vela])
   || a == true || fuerte_movimiento_bajista == true
  )
  {
   int furthestBajista = FindFurthestBajista(Time[one_vela], 20);
   if(furthestBajista != -1)
     {

      datetime time1 = Time[furthestBajista];
      double price1 = closeArray[furthestBajista];
      double price2 = lowArray[furthestBajista];

      newVela_Order_Block_bajista.price1 = price1;
      newVela_Order_Block_bajista.time1 = time1;
      newVela_Order_Block_bajista.price2 = price2 ;

     }
   else
      case_OrderBlockBajista_normal =false;
  }
//+------------------------------------------------------------------+
Let's talk about each function with appropriate comments. So, we are looking to identify certain patterns, and when we find them, we activate the Boolean variables.
Next we check for bullish candlessticks before one_candle, which is the candlestick which which the movement begins.
Finally, we assign price and time values to order blocks.
Now we move on to the volume case, where we will look at both volume peaks and rising volume.
//condition orderblock volume --------------------------------//
if(Volumen_one_vela  > Volumen_two_vela && Volumen_one_vela > volumen_vela_atras_one)
  {
   VolumenCorrecto = true; //here we check the volume peak
  }
else
   VolumenCorrecto = false;

//so that the bullish candle behind is bearish and 2 bullish
if(closeArray[one_vela] > openArray[one_vela]  &&
   closeArray[two_vela] > openArray[two_vela])
  {
   VelaCorrecta_casevolumen = true;
  }

//consecutive case
bool case_vol_2 = false;
if(Volumen[one_vela] > volumen_vela_atras_one && Volumen[two_vela] > Volumen[one_vela] && openArray[tree_vela] < closeArray[tree_vela] && openArray[four_vela] < closeArray[four_vela])
   case_vol_2 = true;

//here we verify that the highlights do not mitigate the order block
if((VolumenCorrecto == true && VelaCorrecta_casevolumen == true
    && ((lowArray[two_vela] > ((body1 * 0.5)+openArray[one_vela]) && ((body2 *0.6)+openArray[two_vela]) > highArray[one_vela]) || esVela_Martillo == true)
    && highArray[tree_vela] > openArray[two_vela]) || case_vol_2 == true)
  {
//I already explained all this above, it is literally the same, we look for the closest bullish trend and assign a value to the one before it
   int furthestAlcista = FindFurthestAlcista(Time[one_vela],20);
   if(furthestAlcista > 0)
     {

      datetime time1 = Time[furthestAlcista];
      double price2 = openArray[furthestAlcista];
      double price1 = lowArray[furthestAlcista];

      newVela_Order_block_volumen.price1 = price1;
      newVela_Order_block_volumen.time1 = time1;
      newVela_Order_block_volumen.price2 = price2;

      case_orderblock_vol= true;
     }
   else
      case_orderblock_vol =false;

  }
//Bearish version
//+------------------------------------------------------------------+

//+------------------------------------------------------------------+
//| Condition for Bullish Order Block Case case_Volumen              |
//+------------------------------------------------------------------+

bool VelaCorrecta_casevolumen = false;
bool VolumenCorrecto;
//condition orderblock volume --------------------------------//
//by peak volume
if(Volumen_one_vela  > Volumen_two_vela && Volumen_one_vela > volumen_vela_atras_one)
  {
   VolumenCorrecto = true;
  }
else
   VolumenCorrecto = false;
//we look here for 2 consecutive bearish candles
if(closeArray[one_vela] < openArray[one_vela]  &&
   closeArray[two_vela] < openArray[two_vela])
  {

   VelaCorrecta_casevolumen = true; //we set the variable "VelaCorrecta_casevolumen" to true
  }
//we look for an increasing volume in addition to the 3rd candle and 4th candle being bearish
bool case_vol_2 = false;
if(Volumen[one_vela] > volumen_vela_atras_one && Volumen[two_vela] > Volumen[one_vela] && openArray[tree_vela] > closeArray[tree_vela] && openArray[four_vela] > closeArray[four_vela])
   case_vol_2 = true;

if((VolumenCorrecto == true && VelaCorrecta_casevolumen == true && highArray[two_vela] < ((body1 * 0.5)+closeArray[one_vela]) && ((body2 *0.5)+closeArray[two_vela]) < lowArray[one_vela]) || case_vol_2 == true)   // verificamos si se cumple
  {
// the peak volume case or increasing volume case
   int furthestBajista = FindFurthestBajista(Time[one_vela],20); //we look for the bearish candle closest to the 1st candle

   if(furthestBajista > 0)
     {
      //if this is true, which as I said before it will always be, we assign the candle values
      //to the structure variables to draw the rectangles
      datetime time1 = Time[furthestBajista];
      double price1 = closeArray[furthestBajista];
      double price2 = lowArray[furthestBajista];

      newVela_Order_Block_bajista_2.price1 = price1;
      newVela_Order_Block_bajista_2.time1 = time1;
      newVela_Order_Block_bajista_2.price2 = price2 ;

      case_OrderBlockBajista_volumen = true;
     }
   else
      case_OrderBlockBajista_volumen = false;
  }
//+------------------------------------------------------------------+
Now that we have implemented detection of order blocks, we need to add them to the array so that later they can be displayed on the chart.
In this code, we will perform the following actions:
- We initialize the variable 'mitigated' to false.
- We set a name for an order block based on its type and set time according to one_sail.
- Finally, we add the order block into a dynamic array.
if(case_OrderBlockAlcista_normal == true
   && mitigados_alcsitas(newVela_Order_block_alcista.price2,openArray,closeArray,highArray,lowArray,Time,newVela_Order_block_alcista.time1,Time[0]) == 0)  //we verify that the order block has not been mitigated
  {
   newVela_Order_block_alcista.mitigated = false; //we activate the order block status as unmitigated = false
   newVela_Order_block_alcista.name =  "Order Block Alcista normal" + TimeToString(newVela_Order_block_alcista.time1) ;  //we assign the name "Normal Bullish Order Block" + the time of one_Vela
   AddIndexToArray_alcistas(newVela_Order_block_alcista); //we add to the array to then check if they are being mitigated and draw them

  }
//the same would be for the volume case
if(case_orderblock_vol == true
   && mitigados_alcsitas(newVela_Order_block_volumen.price2,openArray,closeArray,highArray,lowArray,Time,newVela_Order_block_volumen.time1,Time[0]) == 0)
  {
   newVela_Order_block_volumen.mitigated = false;
   newVela_Order_block_volumen.name =  "Order Block Alcista vol" + TimeToString(newVela_Order_block_volumen.time1) ;
   AddIndexToArray_alcistas(newVela_Order_block_volumen);

  }

  }

//--- Bearish version

if(case_OrderBlockBajista_normal == true  && mitigado_bajista(newVela_Order_Block_bajista.price2,openArray, closeArray, highArray, lowArray, Time, Time[0],newVela_Order_Block_bajista.time1) == 0
  ) //we check if the bearish order block was not mitigated and the normal case is true
  {
   newVela_Order_Block_bajista.mitigated = false; //we initialize the state of the order block as unmitigated = false
   newVela_Order_Block_bajista.name = ("Order Block Bajista ")+ TimeToString(newVela_Order_Block_bajista.time1) ; //we assign the name as "Bearish Block Order" + the time of the 1st candle
   AddIndexToArray_bajistas(newVela_Order_Block_bajista); //we add the structure to the array
  }

if(case_OrderBlockBajista_volumen == true   && mitigado_bajista(newVela_Order_Block_bajista_2.price2, openArray,closeArray,highArray,lowArray,Time,Time[0],newVela_Order_Block_bajista_2.time1)== 0
  )//we check if the bearish order block was not mitigated and the volume case is true
  {
   newVela_Order_Block_bajista_2.mitigated = false; //we initialize the state of the order block as unmitigated = false
   newVela_Order_Block_bajista_2.name = ("Order Block Bajista ") + TimeToString(newVela_Order_Block_bajista_2.time1) ; //we assign the name as "Bearish Block Order" + the time of the 1st candle
   AddIndexToArray_bajistas(newVela_Order_Block_bajista_2); //we add the structure to the array

  }
  }
//+------------------------------------------------------------------+
Now we can move on to drawing and verifying the mitigation.
2.4: Visualization: Colors and Checking Order Block Mitigation
In this section, we will look at how to update order blocks, draw them and activate their mitigated state.
- We will draw them by iterating over "ob_bullish" and "ob_bearish" the arrays, as we have already said, that store information about order blocks.
- We will move objects using "ObjectMove" because we don't want to redraw everything again, as this reduces the efficiency of the program and also consumes more computer resources.
Now that we've done all this, let's look at the code I prepared to meet these requirements:
for(int i = 0; i < ArraySize(ob_alcistas); i++) //We iterate through all the indexes of the array where the order blocks information is stored
  {
   datetime mitigadoTime = esOb_mitigado_array_alcista(ob_alcistas[i],ob_alcistas[i].time1); //we call the function that will tell us if index i has been mitigated or not. If it is, we activate its state to true

   if(ob_alcistas[i].mitigated == false)  //we verify that it has not been mitigated
     {
      if(mitigadoTime == 0) //We condition that the order block has not been touched by the price
        {

         if(ObjectFind(ChartID(),ob_alcistas[i].name) < 0) //we check if the object exists in the graph with ObjectFind
           {
            RectangleCreate(ChartID(), ob_alcistas[i].name, 0, ob_alcistas[i].time1, ob_alcistas[i].price1,
                            Time[0], ob_alcistas[i].price2,Color_Order_Block_Alcista, Witdth_order_block, Fill_order_block, Back_order_block,STYLE_SOLID); //  we create the rectangle with the data

           }
         else
            ObjectMove(ChartID(),ob_alcistas[i].name,1,Time[0],ob_alcistas[i].price2);     //on the contrary, if the object exists, the only thing we will do is update it to the current time using anchor point 1
        }
     }
  }

// Draw all order blocks from the orderBlocks array
for(int i = 0; i < ArraySize(ob_bajistas); i++)
  {
   datetime mitigadoTime = esOb_mitigado_array_bajista(ob_bajistas[i],ob_bajistas[i].time1);

   if(ob_bajistas[i].mitigated == false)
     {

      if(mitigadoTime == 0)
        {

         if(ObjectFind(ChartID(),ob_bajistas[i].name) < 0)
           {
            RectangleCreate(ChartID(), ob_bajistas[i].name,0, ob_bajistas[i].time1, ob_bajistas[i].price1,
                            Time[0], ob_bajistas[i].price2,Color_Order_Block_Bajista,Witdth_order_block,Fill_order_block,Back_order_block,STYLE_SOLID);

           }
         else
            ObjectMove(ChartID(),ob_bajistas[i].name,1,Time[0],ob_bajistas[i].price2);

        }
     }

  }
//+------------------------------------------------------------------+
- The order block detection is performed inside the for loop which, in turn, is executed with the following condition:
new_vela == true - A rectangle is drawn outside the loop, but also with the condition:
new_vela == true 2.5: Implementing Alerts for Order Block Mitigation and Object Removal
In this section, we will look at how to implement alerts when order blocks are relaxed, and create the function we mentioned at the beginning:
Eliminar_Objetos()
Let's start with the definition of logic:
- We will need to call the following functions:
esOb_mitigado_array_bajista
esOb_mitigado_array_alcista
When we detect that the order block was mitigated, we return the time of the mitigation candlestick and also set the order block status to true, which is equivalent to the order block being mitigated.
Therefore, to find out whether an order block is mitigated or not, we will use its state:
mitigated
Now, looking at the structure of the order block, we see that it has its price, time, state, and name:
struct OrderBlocks
{
 datetime time1;
 double price1;
 double price2;
 string name;
 bool mitigated;

};
From this structure, we are particularly interested in 2 variables for alerts:
 string name;
 bool mitigated;
- mitigated: This boolean variable lets us know if the order block has been mitigated.
- name: Using this parameter, we check if the mitigated order block has been previously mitigated.
We still need:
- Two arrays; these arrays will be of type string and also dynamic, since we will be updating their size as more order blocks are mitigated.
- A function to add entries to the string arrays.
- A function to check if the string we pass as the order block name already exists in the array.
Alright, I've integrated the missing functions and arrays:
- We go to the global section of the program where we write:
string pricetwo_eliminados_oba[];
string pricetwo_eliminados_obb[];
These will be the arrays we need.
Then we will create the following functions:
  bool Es_Eliminado_PriceTwo(string pName_ob , string &pArray_price_two_eliminados[])
  {
   bool a = false; // we create the variable "a" and initialize it to false
     for(int i = 0 ; i < ArraySize(pArray_price_two_eliminados) ; i++) // we traverse all the indices of the array passed as a reference
     {
      if(pName_ob == pArray_price_two_eliminados[i]) // we will compare all the positions in the array with the variable "pName_ob"
      { // if the comparison is identical the variable "a" becomes true
       a = true;
        break; // we exit the loop
      }
     }
  return a; //we return the value of "a"
 }

 //function to add values and assign a new size to the array passed by reference
 void Agregar_Index_Array_1(string &array[], string pValor_Aagregar) {
    int num_array = ArraySize(array);
    if (ArrayResize(array, num_array + 1) == num_array + 1) {
        array[num_array] = pValor_Aagregar;
    } else {
      Print("Error resizing array");
    }
}
- These functions will help us ensure that when an order block is mitigated, it hasn't already been mitigated before, to avoid massive alert spam.
Now we move to the part inside OnCalculate() to finish programming the alerts:
- We start by creating a loop through all the indices of the order blocks array.
- We check with an if() the status of the order block, and also verify that the name of the order block is NOT in the string array where we store the names of mitigated order blocks.
- If all of this is true, we notify the user with an alert that an order block was mitigated.
- We add the name of the order block to the string array to avoid repetitions.
- We finish by exiting the loop with a break.
// Loop through the order blocks
for(int i = 0; i < ArraySize(ob_alcistas); i++)
  {
   if(ob_alcistas[i].mitigated == true && Es_Eliminado_PriceTwo(ob_alcistas[i].name, pricetwo_eliminados_oba) == false)
     {
      Alert("El order block alcista esta siendo mitigado: ", TimeToString(ob_alcistas[i].time1));

      Agregar_Index_Array_1(pricetwo_eliminados_oba, ob_alcistas[i].name);

      break;
     }
  }

// Loop through the order blocks
for(int i = 0; i < ArraySize(ob_bajistas); i++)
  {
   if(ob_bajistas[i].mitigated == true && Es_Eliminado_PriceTwo(ob_bajistas[i].name, pricetwo_eliminados_obb) == false)
     {

      Alert("El order block bajista esta siendo mitigado: ", TimeToString(ob_bajistas[i].time1));

      Agregar_Index_Array_1(pricetwo_eliminados_obb, ob_bajistas[i].name);

      break;
     }
  }
//+------------------------------------------------------------------+
Now that we're done with alerts, let's move on to deleting objects:
bool  ObjectDelete(
   long    chart_id,     // chart identifier
   string  name          // object name
   );
Next we need the current chart ID:
ChartID() Order block name:
name
With all this in mind, we need to loop through all of our order block positions and then call:
ObjectDelete() To delete all objects we have created:
  void Eliminar_Objetos()
  {

  for(int i = 0 ; i < ArraySize(ob_alcistas) ; i++) // we iterate through the array of bullish order blocks
  {
   ObjectDelete(ChartID(),ob_alcistas[i].name); // we delete the object using the name of the order block
  }
  for(int n = 0 ; n < ArraySize(ob_bajistas) ; n++) // we iterate through the array of bearish order blocks
  {
  ObjectDelete(ChartID(),ob_bajistas[n].name);  // we delete the object using the name of the order block
  }

 }
At this point we have finished working on the indicator, but we still need to change the functions:
OnInit() We need to ensure it properly handles the new variables and arrays we added.
So, we change it to:
OnDeinit() We also make sure to free up the resources used by the indicator by deleting the graphical objects and freeing up the memory of the dynamic arrays where the order block data is stored.
It is also important to make sure that the ATR handler is properly freed if we have initialized it correctly, to avoid memory leaks or errors when closing the indicator. We do it as follows:
if(atr_i != INVALID_HANDLE)
    IndicatorRelease(atr_i);
Final implementation of
OnDeinit() is as follows:
 void OnDeinit(const int reason)
  {
//---
  Eliminar_Objetos();

  ArrayFree(ob_bajistas);
  ArrayFree(ob_alcistas);
  ArrayFree(pricetwo_eliminados_oba);
  ArrayFree(pricetwo_eliminados_obb);

  if(atr_i  != INVALID_HANDLE) IndicatorRelease(atr_i );

  }

//---

int OnInit()
  {
//--- indicator buffers mapping
  tiempo_ultima_vela = 0;
     atr_i = iATR(_Symbol,PERIOD_CURRENT,14);

     if(Rango_universal_busqueda < 40)
     {
      Print("Search range too small");
      return (INIT_PARAMETERS_INCORRECT);
     }

      if( atr_i== INVALID_HANDLE)
     {
      Print("Error copying data for indicators");
      return(INIT_FAILED);
     }

  ArrayResize(ob_bajistas,0);
  ArrayResize(ob_alcistas,0);
  ArrayResize(pricetwo_eliminados_oba,0);
  ArrayResize(pricetwo_eliminados_obb,0);

//---
   return(INIT_SUCCEEDED);
  }
3.0: Conclusion
In this article, you have learned how to:
- Create an indicator based on Smart Money and Inner Circle Trader concepts.
- Configure alerts.
- Draw rectangles on the chart.
Our final result:

If you've made it this far, I sincerely thank you for your enthusiasm and patience in learning more advanced trading concepts. Programming offers a wide range of possibilities, from basic concepts like highs and lows of a period to the creation of intelligent trading robots. I invite you to keep exploring more articles to advance in this fascinating world of programming.
I would be very happy if you share this article with someone who might need it.
As a thank-you for your reading, I've prepared a file that includes all the code for the indicator we discussed here. Also, I want to mention that this series doesn't end here, and I plan to develop more parts. Below is a possible outline of future articles:
Part Two:
- Integrate buffers and plots for this indicator (buy and sell signal buffer).
- Implement take profit (TP) and stop loss (SL) levels once a signal is triggered (two lines for TP and two for SL).
- Introduce a new advanced method for detecting Order Blocks (based on the order book).
If I receive enough support, I plan to create a third part where we will build an Expert Advisor (EA) using the indicator buffers we've developed.
Translated from Spanish by MetaQuotes Ltd.
Original article: https://www.mql5.com/es/articles/15899
Warning: All rights to these materials are reserved by MetaQuotes Ltd. Copying or reprinting of these materials in whole or in part is prohibited.
This article was written by a user of the site and reflects their personal views. MetaQuotes Ltd is not responsible for the accuracy of the information presented, nor for any consequences resulting from the use of the solutions, strategies or recommendations described.

- Free trading apps
- Over 8,000 signals for copying
- Economic news for exploring financial markets
You agree to website policy and terms of use
Hello,
I was just testing my EA in the Strategy Tester, EURUSD H4 1/1/2025-2//1/2025, and observed at the end of the run, there were two problems with the Block Order indicator.
First, it selected a block order on 2/3/2025 which is outside of the test window and secondly, it placed the block text in the Chart Shift area.
Enjoy
CapeCoddah
Here is an English Translated version of your first indicator. I decided I needed to understand your many code comments in English and reconsidered Google Translate as DeepL did not impress me. I first changed all // comments into #/# to allow Google translate the // line comments.. and then converted the text file into a MS Word document for input to Translate. After the translation, I opened the new document and saved it as a text file, renamed it and began syntaxing the new source. I estimate that Translate did 90% of the work but it did add spaces and characters that required manual conversion. After a days work, it compiled with out errors. AMAZINGLY it worked on the first try! I compared it to your original indicator for 1000 bars and they were identical.
Here is an English Translated version of your first indicator. I decided I needed to understand your many code comments in English and reconsidered Google Translate as DeepL did not impress me. I first changed all // comments into #/# to allow Google translate the // line comments.. and then converted the text file into a MS Word document for input to Translate. After the translation, I opened the new document and saved it as a text file, renamed it and began syntaxing the new source. I estimate that Translate did 90% of the work but it did add spaces and characters that required manual conversion. After a days work, it compiled with out errors. AMAZINGLY it worked on the first try! I compared it to your original indicator for 1000 bars and they were identical.
Unfortunately it appears that your indicator is structurally flawed and useless for trading as it is performing its calculations on future variables that are unknownat the time of the calculation as highlighted in the code below in bold.
for( int i = Universal_search_range ; i > 5 ; i--) {
//error checking
if( i + 3 > ArraySize(highArray) || i + 3 > ArraySize(atr))
continue ;
if( i < 0) continue;
// Update candlestick indices
one_candle = i ; //central candle
candle_behind_two = i +2;
candle_behind_one = one_candle +1;
two_candle = one_candle - 1;
three_candle = one_candle - 2;
four_candle = one_candle -3;
// Calculate the average volume of previous candles
body1 = MathAbs(closeArray[one_candle] - openArray[one_candle]);
body2 = MathAbs(closeArray[two_candle] - openArray[two_candle]);
body3 = MathAbs(closeArray[three_candle] - openArray[three_candle]);
Hello CapeCoddah, I think that is not the case, since for example the indicator does all the calculations using arrays in series (although it is not common, they are normally done without series) in the context of the first loop shown, that loop is used to detect order blocks, what is done is go from the "Universal_search_range" candle (Remember that in series candle 0 is the most recent) to candle 6 so at no time do I see future candles being used and if that were the case then two_candle or another index would result in a value less than 0 causing out of range. So the candle four_candle = one_candle - 3, would be the closest to 0 in the case that the loop ends where i = 6 then four_candle = 3, so taking into account that the current candle is 0 then, I can say that at no time am I using future candles. The name may sound confusing, I know, but I did it that way because it was easier for me to understand, given that when it came to obtaining the order blocks, one_vela was like the central candle. So if I was looking for a strong move, I would evaluate the candles that followed it (in series, this would be subtraction).