MQL5 Wizard Techniques you should know (Part 73): Using Patterns of Ichimoku and the ADX-Wilder
Introduction
The Ichimoku Kinko Hyo (Ichimoku) indicator and ADX-Wilder (ADX) oscillator are used in this article in a support/resistance and trend-identification pairing. The Ichimoku is certainly multifaceted and quite versatile. It can provide more than just support/ resistance levels. However, we are sticking to just S/R for now. Indicator pairings, especially when complimentary, have the potential to spun more incisive and accurate entry signals for Expert Advisors. As usual, we examine 10 signal patterns of this indicator pairing. We test these 10 signal patterns that are each assigned an index, one at a time, while being guided by these rules;
Indexing is from 0 to 9 allowing us to easily compute the map value for their exclusive use by the Expert Advisor. For instance, if a pattern is indexed 1 then we have to set the parameter ‘PatternsUsed’ to 2 to the power 1 which comes to 2. If the index is 4 then this is 2 to the power 4 which comes to 16, and so on. The maximum value that this parameter can be assigned, meaningfully, is 1023 since we have only 10 parameters. Any number between 0 and 1023 that is not a pure exponent of 2 would represent a combination of more than one of these 10 patterns.
In previous articles we have argued why training or optimizing with multiple signals is bound to be futile despite the rosy test results they often present. This is because when more than one signal is engaged, they tend to inadvertently cancel each other’s trades at points that are convenient for maximizing profits in that limited test window. Tests could be made on wider test windows in order to work around this, but since this article is focused on a one-year test window, that would not be applicable for our purposes.
The Ichimoku
By definition, the Ichimoku is a comprehensive indicator that brings together several elements to assess trend direction, momentum and S/R. An indicator whose name translates to all-in-one system, it seeks to give a holistic view of price action and is often used for trend following strategies. It constitutes five buffers. The Tenkan-sen, the Kijun-sen, Senkou-Span-A, Senkou-Span-B, and finally the Chikou-Span. In addition to these buffers, a Kumo-Cloud is also often referred to, being constituted of the two Senkou-Spans A and B. Prima-face, this cloud can serve as an S/R marker and also a metric of trend strength depending on its thickness.
The inputs required to calculate all its five buffers are three, and they are typically assigned 9, 26, and 52. On paper, these values can be customized for various markets, but one is probably better off leaving these periods as is and looking to adjust other attributes of his system. With this indicator, a multitude of signals can be inferred and these include crossovers of the Tenkan with Kijun as well as Chikou confirmations, as we’ll see below. The Ichimoku is thus versatile and can be applied to a variety of assets from stocks and forex up to crypto on a variety of timeframes.
Let's now look at the underlying formula of these five buffers, starting with the Tenkan-sen. It is determined as follows:
= (Highest High + Lowest Low) / 2
Where:
- The Highest high is the maximum price over the last 9 periods.
- The Lowest low is similarly the least price across the last 9.
Its purpose could be taken as a short-term trend indicator that is sensitive to price changes and thus can readily take market temperature on short horizon moves. The Kijun-sen is also set in similar fashion:
= (Highest High + Lowest Low) / 2
Where:
- Highest High is the maximum price across 26 periods
- The lowest low is also the least price over 26.
Its purpose is taken as a medium-term trend barometer that can also serve as S/R. Next we have the Senkou Span A. This buffer’s formula is as follows:
= (Tenkan-sen + Kijun-sen) / 2
Where:
- Tenkan-sen and Kijun-sen are the conversion line and baseline values from the buffers whose formulae are presented above.
The purpose of this buffer is primarily to form an edge of the Kumo cloud, an important S/R feature of the Ichimoku. Up next, we have the Senkou span B. This too is similar to the Tenkan-sen, with differences stemming in length of period used:
= (Highest High + Lowest Low) / 2
Where:
- Highest High is the max price over 52 periods
- Lowest low is also the least price over 52 periods
Its purpose is to complement Senkou span A by forming the second edge of the Kumo cloud. Its longer indicator periods also make it a long-term S/R. Finally, the Chikou span, the final buffer, is defined as follows:
= Current period’s close
Where:
- The close price is plotted 26 periods back
Chikou’s purpose is to confirm trends by comparing past price to current action. Also noteworthy, and already mentioned above, is the Kumo cloud. This is typically the area between the Senkou span A and Senkou span B. When span A is greater than B we have a bullish Kumo cloud and when the reverse is true, A < B we have a bearish. Kumo helps visualize trend strength as well as S/R levels.
The ADX-Wilder
Our second indicator for this article measures the strength of a prevalent trend. Not its direction. It however features 2 additional buffers, besides its primary, that can be used to assess bullish and bearish momentum. Typically, the ADX main buffer has values ranging from 0 to 100. However, it seldom breaches the 25 level which is why, when it does, it is taken as a sign of a strong prevalent trend. When its value is less than 20 this is a sign of a weak trend. It is a lagging indicator that usually uses 14 indicator periods in its calculations. It can be versatile across various asset classes. Signals could secondarily be generated from crossovers of +DI/-DI when suggesting trend direction, with the ADX main buffer confirming trend strength.
The ADX Wilder outputs 3 buffers, but actually works with up to 6 different buffers, in the process. We have +DM directional movement and a +DM directional indicator, a -DM directional movement and a -DM directional indicator, a true range, and finally the ADX main buffer. Let's go over the formulae of each. First up is the positive DM directional movement:
= Current High - Previous High
Where:
- The Previous Low needs to be greater than the Current Low. If this condition is not met then its value is zero.
This buffer tracks upward price movement. The next buffer we have is the negative directional movement. This is given by the formula:
= Previous Low - Current Low
Where:
- The current high is above the previous high, otherwise its value is zero.
This buffer measures downward price movement. With the directional movement’s defined, we now turn to the true range. This is given by the following simple formula:
= Max[(Current High - Current Low), |Current High - Previous Close|, |Current Low - Previous Close|]
Where:
- Max is simply the maximum value from the three differences expressed above.
The main purpose of the true range is to measure price volatility. With the directional movements and true range defined, we can now move onto the used indicator buffers. First of these is the positive directional indicator. And this is given by the formula below:
= (Smoothed +DM / Smoothed TR) × 100
Where:
- The smoothed +DM is the exponential moving average of the positive directional movement defined above.
- The smoothed TR is the exponential moving average of the true range.
The purpose of the +DM is to indicate bullish strength. We also have the -DM that is defined by the formula below:
= (Smoothed -DM / Smoothed TR) × 100
Where:
- The smoothed -DM is also the exponential moving average of the negative directional movement, whose formula is shared above.
- The smoothed TR is also the exponential moving average of the true range.
The periods used for both the -DM and +DM indicator buffers is typically 14. The purpose of -DM is to measure bearish strength. With these 2 indicator buffers defined, it leads us to the ADX main buffer. Its formula is as follows:
= smoothed[(|+DI - -DI| / (+DI + -DI)) × 100]
Where:
- The smoothing refers to averaging the formula output values, exponentially, over a 14 period window.
- The +DI is the bullish indicator buffer we have just defined above and NOT the positive directional movement.
- The -DI also the bearish indicator we have just defined.
- The non-smoothed value is also referred to as DX.
The purpose of the smoothed DX aka ADX is to quantify trend strength. With the two indicators introduced, we can proceed to look at the 10 patterns we are using in this article. All testing will be done as always on the year 2023 with 2024 serving as a walk-forward or test environment. We are however using the 30-minute timeframe, as opposed to our regular 4-hour, because the Ichimoku indicator does not emit enough signals in one year, our test period. Our test symbol is GBP USD.
Price Crossing Senkou Span A with ADX Confirmation
Our pattern-0 is the very first we are considering as always, and the naming format used throughout is pattern-x where x if the pattern’s index, not its position count. As mentioned in the introduction above, we emphasize indices here because they help in setting input parameter values that allow us to test one pattern at a time. The bullish signal for pattern-0 is when price crosses above the Senkou span A, marking a breakout above the Kumo cloud. This should typically be backed by a solid ADX reading of at least 25. We implement this in MQL5 as follows;
//+------------------------------------------------------------------+
//| Check for Pattern 0.                                             |
//+------------------------------------------------------------------+
bool CSignalIchimoku_ADXWilder::IsPattern_0(ENUM_POSITION_TYPE T)
{  if(T == POSITION_TYPE_BUY && Close(X() + 1) < Ichimoku_SenkouSpanA(X() + 1) && Close(X()) > Ichimoku_SenkouSpanA(X()) && ADX(X()) >= 25.0)
   {  return(true);
   }
   else if(T == POSITION_TYPE_SELL && Close(X() + 1) > Ichimoku_SenkouSpanA(X() + 1) && Close(X()) < Ichimoku_SenkouSpanA(X()) && ADX(X()) >= 25.0)
   {  return(true);
   }
   return(false);
}
The bearish pattern is also defined when price crosses the Senkou span A to close below it. This signals a breakdown below the cloud with a strong trend. The combination of the Ichimoku cloud breakout and the ADX trend strength affirmation make this a reliable signal. It should work best in a market context that is trending; choppy conditions are not suited for this pattern. A test run over the 2-year period of 2023 and 2024, following testing in only 2023, gives us the following report;
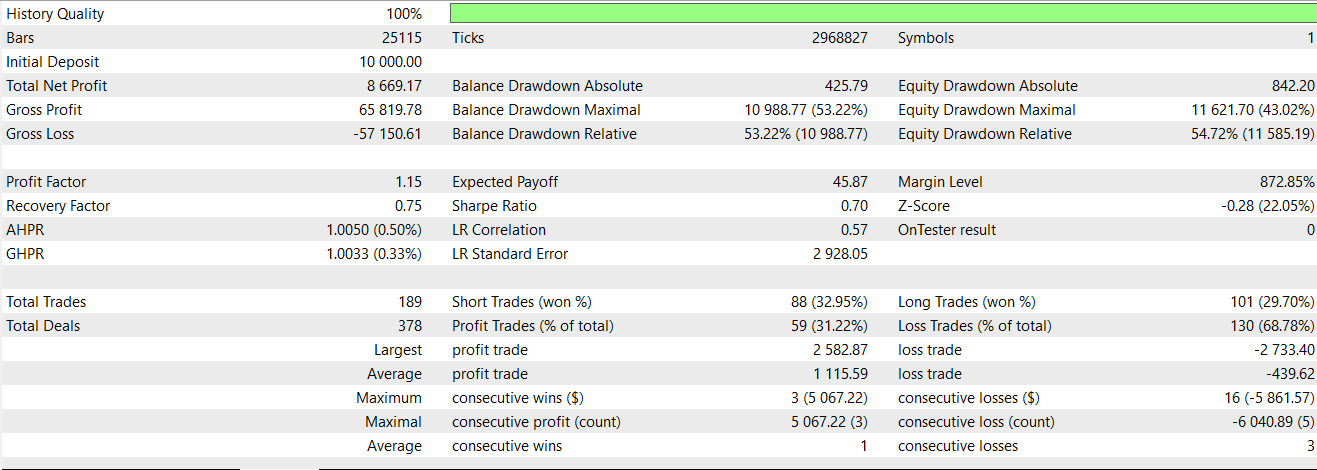
The initial test run in the year 2023 produced very choppy results that were slightly profitable. Interestingly, a forward walk also produces a similar equity curve profile, however this is still profitable. Best Practice Guidance for this pattern could call for confirmation on higher timeframes to get trend alignment before pulling the trigger. The requirement for ADX to at least be 25 is essential is filtering weak signals. Stop-loss can be set below/above the Kumo cloud for buy/sell trades, respectively. Monitoring for false breakouts is crucial.
Tenkan-Sen/Kijun-Sen Crossover with ADX Confirmation
Our next pattern is based on two moving average crossovers and an ADX confirmation. For the bullish, when the Tenkan-Sen crosses the Kijun-Sen from below to close above it, this signals a short term change in momentum, towards long. The ADX would need to be at least 20. We code our check function in MQL5 as follows:
//+------------------------------------------------------------------+
//| Check for Pattern 1.                                             |
//+------------------------------------------------------------------+
bool CSignalIchimoku_ADXWilder::IsPattern_1(ENUM_POSITION_TYPE T)
{  if(T == POSITION_TYPE_BUY && Ichimoku_TenkanSen(X() + 1) < Ichimoku_KijunSen(X() + 1) && Ichimoku_TenkanSen(X()) > Ichimoku_KijunSen(X()) && ADX(X()) >= 20.0)
   {  return(true);
   }
   else if(T == POSITION_TYPE_SELL && Ichimoku_TenkanSen(X() + 1) > Ichimoku_KijunSen(X() + 1) && Ichimoku_TenkanSen(X()) < Ichimoku_KijunSen(X()) && ADX(X()) >= 20.0)
   {  return(true);
   }
   return(false);
}
The bearish signal is when the Tenkan-Sen crosses the Kijun-Sen from above to close below it, marking a shift towards bearish momentum. This at its core is an early trend reversal signal of the Ichimoku that supplements the ADX for confirmation. A suitable market context would be at trend genesis, or fractal points. It is bound to be less reliable in range-bound markets. A test run exclusively with this pattern presents us the following report:

This pattern clearly struggled to forward walk. This could be down to using tight price targets and no-stop losses. These are parameters that can be tuned or adjusted by the reader to provide different trading settings. Also when using this pattern trades should be in direction of higher time frame trend. The ADX threshold of only 20 is meant to sift out weak crossovers. Stop-loss placement can be below the Kijun-Sen for buys and above it for sells. Combination with volume indicators can boost confirmation.
Senkou Span A/B Crossover with ADX Confirmation
Pattern-2 is based on the Kumo cloud switch or crossover. The bullish signal is when Senkou span A crosses above the Senkou span B, leading to a bullish cloud formation. This switch needs to happen on an ADX that is at least 25. We implement this in MQL5 as follows:
//+------------------------------------------------------------------+
//| Check for Pattern 2.                                             |
//+------------------------------------------------------------------+
bool CSignalIchimoku_ADXWilder::IsPattern_2(ENUM_POSITION_TYPE T)
{  if(T == POSITION_TYPE_BUY && Ichimoku_SenkouSpanA(X() + 1) < Ichimoku_SenkouSpanB(X() + 1) && Ichimoku_SenkouSpanA(X()) > Ichimoku_SenkouSpanB(X()) && ADX(X()) >= 25.0)
   {  return(true);
   }
   else if(T == POSITION_TYPE_SELL && Ichimoku_SenkouSpanA(X() + 1) > Ichimoku_SenkouSpanB(X() + 1) && Ichimoku_SenkouSpanA(X()) < Ichimoku_SenkouSpanB(X()) && ADX(X()) >= 25.0)
   {  return(true);
   }
   return(false);
}
The bearish signal is when Senkou span A crosses the Senkou span B from above to close below it. This signals a shift to the bearish cloud. It is a long-term trend signal change, that can also serve as a backup trend confirmation. You want to use this signal in trending markets as a swing-trader. Its test results are given below:

Pattern-2 appears to be holding up well on a forward walk. As always, this is following a limited test window of just one year, so independent test diligence is expected on the part of the reader before the ideas presented here can be taken further. For pattern-2, confirmation of cloud crossover on higher timeframes can be supportive. The ADX 25 threshold is meant to sift out weak signals and is key. Stop loss placement can be below/above the cloud for buys/sell positions. This pattern should be avoided when the cloud is thin.
Price Bounce/Rejection at Cloud with ADX and DI Confirmation
Pattern-3, considers price action around the Kumo cloud. The bullish signal is when price bounces off the top of the Kumo, which is always the Senkou-Span-A while the ADX is at least 25 and the positive directional index is more than the negative directional index. We implement this in MQL5 as follows;
//+------------------------------------------------------------------+
//| Check for Pattern 3.                                             |
//+------------------------------------------------------------------+
bool CSignalIchimoku_ADXWilder::IsPattern_3(ENUM_POSITION_TYPE T)
{  if(T == POSITION_TYPE_BUY &&
      Close(X() + 2) > Close(X() + 1) && Close(X() + 1) < Close(X()) &&
      Close(X() + 2) > Ichimoku_SenkouSpanA(X() + 2) && Close(X()) > Ichimoku_SenkouSpanA(X()) &&
      Close(X() + 1) <= Ichimoku_SenkouSpanA(X() + 1) &&
      ADX_Plus(X()) > ADX_Minus(X()) && ADX(X()) >= 25.0
      )
   {  return(true);
   }
   else if(T == POSITION_TYPE_SELL &&
      Close(X() + 2) < Close(X() + 1) && Close(X() + 1) > Close(X()) &&
      Close(X() + 2) < Ichimoku_SenkouSpanA(X() + 2) && Close(X()) < Ichimoku_SenkouSpanA(X()) &&
      Close(X() + 1) >= Ichimoku_SenkouSpanA(X() + 1) &&
      ADX_Plus(X()) < ADX_Minus(X()) && ADX(X()) >= 25.0
      )
   {  return(true);
   }
   return(false);
}
The bearish signal is when price rejects a cloud bottom, which again would be the Senkou-Span-A, in a U formation. In addition, the ADX would be at least 25 and the negative directional index would be above the positive directional index. Pattern-3 is a strong S/R signal that also offers directional confirmation. It is best suited for markets in range-to-trend transitions, that can be tricky to spot, which is why we have several filter checks before this signal pattern can be confirmed. Our testing of pattern-3 gives us the following report:

This pattern, a bit like pattern-2, is also able to eke out a positive forward walk as shown above. When engaging pattern-3, it always good to confirm the bounce/rejection with candlestick patterns such as pin bars. The positive/negative directional index relative trend needs to match with price trend direction. Stop loss can be placed just below/above the Senkou-Span-B.
Chikou Span vs. Senkou Span A with ADX Confirmation
Pattern-4 incorporates the Ichimoku indicator’s 5th buffer of the Chikou-Span. A bullish signal is when the Chikou span is deemed above the Senkou span A. The Chikou as already mentioned in the introduction is a laggard, typically by 26 period bars. From a coder’s perspective this means when referring to the Chikou buffer of the inbuilt Ichimoku indicator, we need to manually shift our reading of these values by 26 otherwise we’ll get NaN values. So with the Chikou above span-A, we also need to have the ADX north of 25. We implement this in MQL5 as follows:
//+------------------------------------------------------------------+
//| Check for Pattern 4.                                             |
//+------------------------------------------------------------------+
bool CSignalIchimoku_ADXWilder::IsPattern_4(ENUM_POSITION_TYPE T)
{  if(T == POSITION_TYPE_BUY &&
      Ichimoku_ChinkouSpan(X() + 26) > Ichimoku_SenkouSpanA(X()) &&
      ADX(X()) >= 25.0
      )
   {  return(true);
   }
   else if(T == POSITION_TYPE_SELL &&
      Ichimoku_ChinkouSpan(X() + 26) < Ichimoku_SenkouSpanA(X()) &&
      ADX(X()) >= 25.0
      )
   {  return(true);
   }
   return(false);
}
The bearish signal is when the Chikou is positioned below the Senkou Span A with the ADX still being at least 25. In this instance, though, span A would be below span B; unlike for the bullish signal where it would be above span B. This signal is a lagging confirmation for trend strength and is best for confirming existing trends. Our forward walk test is as follows:

Pattern-4 clearly forward walks well. Probably better than even pattern 3 and 2. When using it, though, trend confirmation could be a better application than entry signalling. It can also be paired with other Ichimoku signals, such as the Kumo cloud positioning. Setting of stop loss can be based on recent swing points. The market context suitable for pattern-4 is a trending market, and choppy environments should not be combined with this signal. For extra illustration, below is a representation of bullish pattern-4 signal on a chart.

Price Bounce/Rejection at Tenkan-Sen with ADX and DI Confirmation
Our next pattern uses price action at the Tenkan-Sen vs the Kumo cloud which we’ve just looked at, with the pattern above. A bullish signal is when price bounces off the Tenkan-Sen with the ADX being at least at the 25 threshold and the positive directional index also being above the negative directional index. We implement this as follows in MQL5:
//+------------------------------------------------------------------+
//| Check for Pattern 5.                                             |
//+------------------------------------------------------------------+
bool CSignalIchimoku_ADXWilder::IsPattern_5(ENUM_POSITION_TYPE T)
{  if(T == POSITION_TYPE_BUY &&
      Close(X() + 2) > Close(X() + 1) && Close(X() + 1) < Close(X()) &&
      Close(X() + 2) > Ichimoku_TenkanSen(X() + 2) && Close(X()) > Ichimoku_TenkanSen(X()) &&
      Close(X() + 1) <= Ichimoku_TenkanSen(X() + 1) &&
      ADX_Plus(X()) > ADX_Minus(X()) && ADX(X()) >= 25.0
      )
   {  return(true);
   }
   else if(T == POSITION_TYPE_SELL &&
      Close(X() + 2) < Close(X() + 1) && Close(X() + 1) > Close(X()) &&
      Close(X() + 2) < Ichimoku_TenkanSen(X() + 2) && Close(X()) < Ichimoku_TenkanSen(X()) &&
      Close(X() + 1) >= Ichimoku_TenkanSen(X() + 1) &&
      ADX_Plus(X()) < ADX_Minus(X()) && ADX(X()) >= 25.0
      )
   {  return(true);
   }
   return(false);
}
The bearish pattern is when price rejects Tenkan-Sen as a resistance and the ADX is also at least 25. The directional indices should have the negative buffer being more than the positive buffer. This is signal serves to confirm short-term momentum. It’s effective when used in trending markets, especially in pullback situations. Our forward walk tests give us the following report:

Of all our tested signal patterns so far with this indicator pairing, this is clearly the dud. It completely fails to forward walk. Possible enhancements that it could use could be candle stick confirmation of its signals. Directional index alignment is already being checked, however thresholds could be added as a check before a signal is confirmed. Stop loss placement can also be added as we are testing without one. This can be below/above the Tenkan-sen for buy /sell orders.
Price Crossing Kijun-Sen with ADX and DI Confirmation
The next pattern, pattern-6, involves price crossovers with the Kijun-Sen. The bullish signal is when price crosses the Kijun-Sen from below to close above it. In addition to this, the positive directional index would be more than the negative, while the ADX is at least 25. We implement this as follows in MQL5:
//+------------------------------------------------------------------+
//| Check for Pattern 6.                                             |
//+------------------------------------------------------------------+
bool CSignalIchimoku_ADXWilder::IsPattern_6(ENUM_POSITION_TYPE T)
{  if(T == POSITION_TYPE_BUY &&
   Close(X() + 1) < Ichimoku_KijunSen(X() + 1) &&
   Close(X()) > Ichimoku_KijunSen(X()) &&
   ADX_Plus(X()) > ADX_Minus(X()) && ADX(X()) >= 25.0)
   {  return(true);
   }
   else if(T == POSITION_TYPE_SELL &&
   Close(X() + 1) > Ichimoku_KijunSen(X() + 1) &&
   Close(X()) < Ichimoku_KijunSen(X()) &&
   ADX_Plus(X()) < ADX_Minus(X()) && ADX(X()) >= 25.0)
   {  return(true);
   }
   return(false);
}
The bearish signal is when [rice crosses the Kijun-Sen from above to close below it. The negative directional index would also be greater than the positive, with the ADX main buffer at least 25 as well. This is a mid-term trend signal that uses directional confirmation. Its ideal market context is in established trends. Testing pattern-6 gives us the following report:
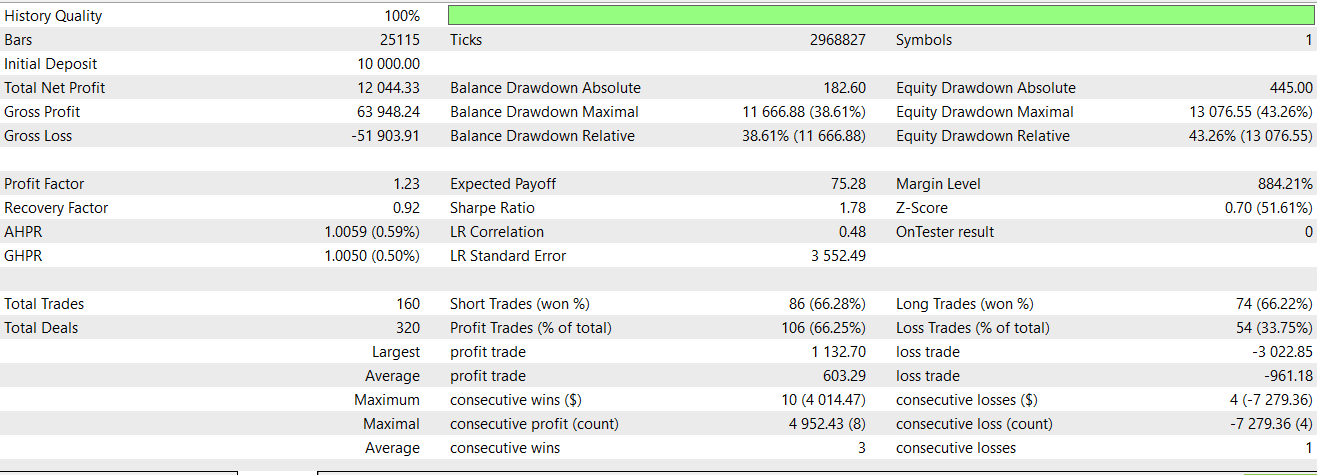
This, pattern, like the one we have reviewed just before it, also struggles to forward walk, albeit not as spectacularly. Possible adjustments could be introduced if we pay attention to higher timeframe cloud directions. Also, besides the ADX threshold and directional index alignment, we can incorporate stop loss below or above the Kijun-Sen for long/short positions. This pattern is also better suited in trending environments and should be avoided in range bound markets.
Price Bounce/Rejection at Senkou Span B with ADX Confirmation
Our eighth pattern, pattern-7, considers price action at span B. A bullish signal is when price bounces off Senkou Span B, where it's acting as a support and the ADX is at 20 and rising. In this situation The Span A would be above the B meaning this price inflection is happening within the Kumo cloud. We implement it in MQL5 as follows:
//+------------------------------------------------------------------+
//| Check for Pattern 7.                                             \
//+------------------------------------------------------------------+
bool CSignalIchimoku_ADXWilder::IsPattern_7(ENUM_POSITION_TYPE T)
{  if(T == POSITION_TYPE_BUY &&
      Close(X() + 2) > Close(X() + 1) && Close(X() + 1) < Close(X()) &&
      Close(X() + 2) > Ichimoku_SenkouSpanB(X() + 2) && Close(X()) > Ichimoku_SenkouSpanB(X()) &&
      Close(X() + 1) <= Ichimoku_SenkouSpanB(X() + 1) && Ichimoku_SenkouSpanA(X()) > Ichimoku_SenkouSpanB(X()) &&
      ADX(X()) >= 20.0
      )
   {  return(true);
   }
   else if(T == POSITION_TYPE_SELL &&
      Close(X() + 2) < Close(X() + 1) && Close(X() + 1) > Close(X()) &&
      Close(X() + 2) < Ichimoku_SenkouSpanB(X() + 2) && Close(X()) < Ichimoku_SenkouSpanB(X()) &&
      Close(X() + 1) >= Ichimoku_SenkouSpanB(X() + 1) && Ichimoku_SenkouSpanA(X()) < Ichimoku_SenkouSpanB(X()) &&
      ADX(X()) >= 20.0
      )
   {  return(true);
   }
   return(false);
}
The bearish signal is when price also rejects the span B where it acts as a resistance and again the ADX is at 20 and rising. As with the bullish signal, the span B is above the span A meaning this price turn also happens in the Kumo. This is a S/R cloud based signal that is suitable for deep pullbacks in trends. From our testing for forward walks as with the already covered signals, we get the following results:
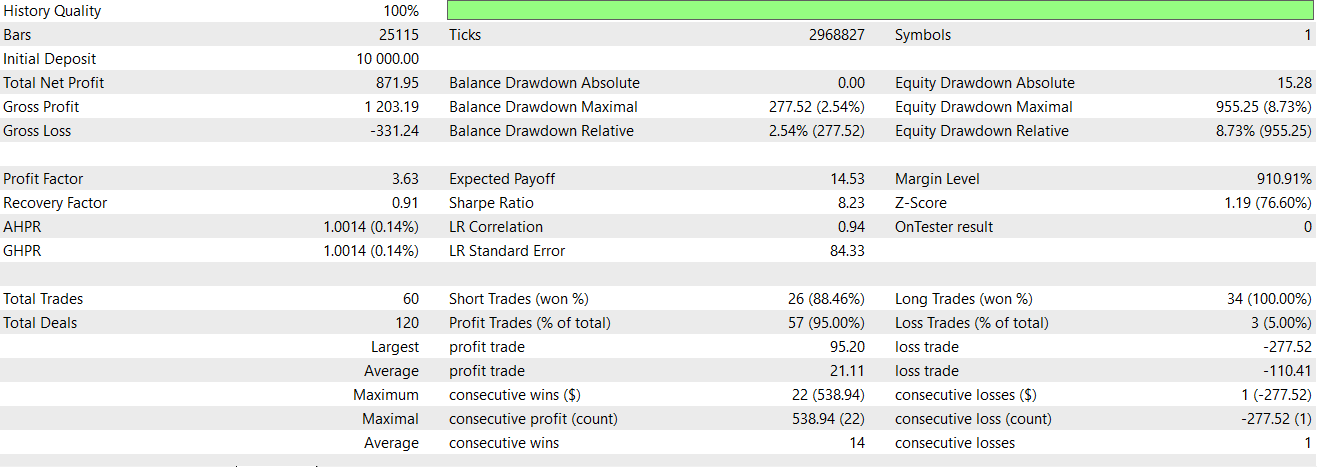
Pattern-7 fares better than the last 2 as it is able to forward walk for a year following one year of testing/ optimization. Nonetheless, it could use some improvements. Independent confirmation of direction can be added with candle stick patterns. Stop loss placement in this instance would be tight and strictly be below/above the span B for buying/selling. This pattern should be avoided when dealing with thin clouds or low ADX values.
Price Above/Below Cloud with ADX Confirmation
Our penultimate pattern takes a bit of a macro view by considering price’s position relative to the Kumo cloud. The bullish signal is when price is above the Kumo cloud, meaning span A is greater than span B and ADX is at least 25. We implement this in MQL5 as follows:
//+------------------------------------------------------------------+
//| Check for Pattern 8.                                             |
//+------------------------------------------------------------------+
bool CSignalIchimoku_ADXWilder::IsPattern_8(ENUM_POSITION_TYPE T)
{  if(T == POSITION_TYPE_BUY &&
      Close(X() + 1) < Close(X()) &&
      Close(X() + 1) > Ichimoku_SenkouSpanA(X() + 1) && Close(X()) > Ichimoku_SenkouSpanA(X()) &&
      Ichimoku_SenkouSpanA(X()) > Ichimoku_SenkouSpanB(X()) &&
      ADX(X()) >= 25.0
      )
   {  return(true);
   }
   else if(T == POSITION_TYPE_SELL &&
      Close(X() + 1) > Close(X()) &&
      Close(X() + 1) < Ichimoku_SenkouSpanA(X() + 1) && Close(X()) < Ichimoku_SenkouSpanA(X()) &&
      Ichimoku_SenkouSpanA(X()) > Ichimoku_SenkouSpanB(X()) &&
      ADX(X()) >= 25.0
      )
   {  return(true);
   }
   return(false);
}
The bearish signal is when price is below the Kumo this time with span B being above span A. ADX main buffer should indicate an established strong trend, meaning its reading should at least be 25. This pattern amounts to a simple trend following signal with ADX confirmation. It is ideal for continuation trend setups. Forward testing this pattern, following an optimization stint gives us the following report:
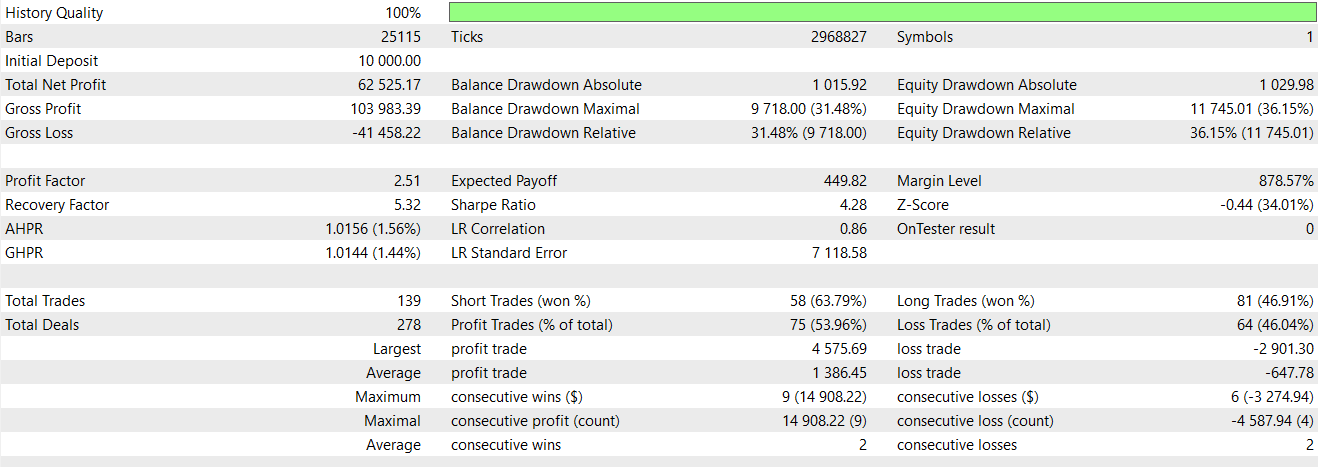
Pattern 8 is probably the best performer of all the tested signal patterns in this article. Its forward walk results clearly surpass its test results. Our testing and training is over a very limited time window, so as always, readers should keep this in mind. Possible enhancements to pattern-8 are considering the actual price trend direction before pulling the trigger, by using price delta parameters. Also, stop loss can be set comfortably at a distance below or above the cloud for long/short positions. For more illustration, a bullish signal for pattern-8 is shown below:

Chikou Span vs. Price and Cloud with ADX Confirmation
Our final pattern revisits the Chikou that we’ve looked at in pattern-4 and combines it with the Kumo. The bullish signal is when the Chikou span is above price as well as span A. ADX needs to be at least 25 to affirm a strong trend. We implement this in MQL5 as follows:
//+------------------------------------------------------------------+
//| Check for Pattern 9.                                             |
//+------------------------------------------------------------------+
bool CSignalIchimoku_ADXWilder::IsPattern_9(ENUM_POSITION_TYPE T)
{  if(T == POSITION_TYPE_BUY &&
      Ichimoku_ChinkouSpan(X() + 26) > Ichimoku_SenkouSpanA(X()) &&
      //Ichimoku_ChinkouSpan(X() + 26) > Close(X()) &&
      Ichimoku_SenkouSpanA(X()) > Ichimoku_SenkouSpanB(X()) &&
      ADX(X()) >= 25.0
      )
   {  return(true);
   }
   else if(T == POSITION_TYPE_SELL &&
      Ichimoku_ChinkouSpan(X() + 26) < Ichimoku_SenkouSpanA(X()) &&
      //Ichimoku_ChinkouSpan(X() + 26) < Close(X()) &&
      Ichimoku_SenkouSpanA(X()) < Ichimoku_SenkouSpanB(X()) &&
      ADX(X()) >= 25.0
      )
   {  return(true);
   }
   return(false);
}
The bearish signal is when the Chikou is below price as well as span A. The ADX should also be at least 25. This somewhat lagging signal confirms trend direction and strength. The best market context for pattern-9 would be strongly trending markets. Our test results for this final pattern are as follows:
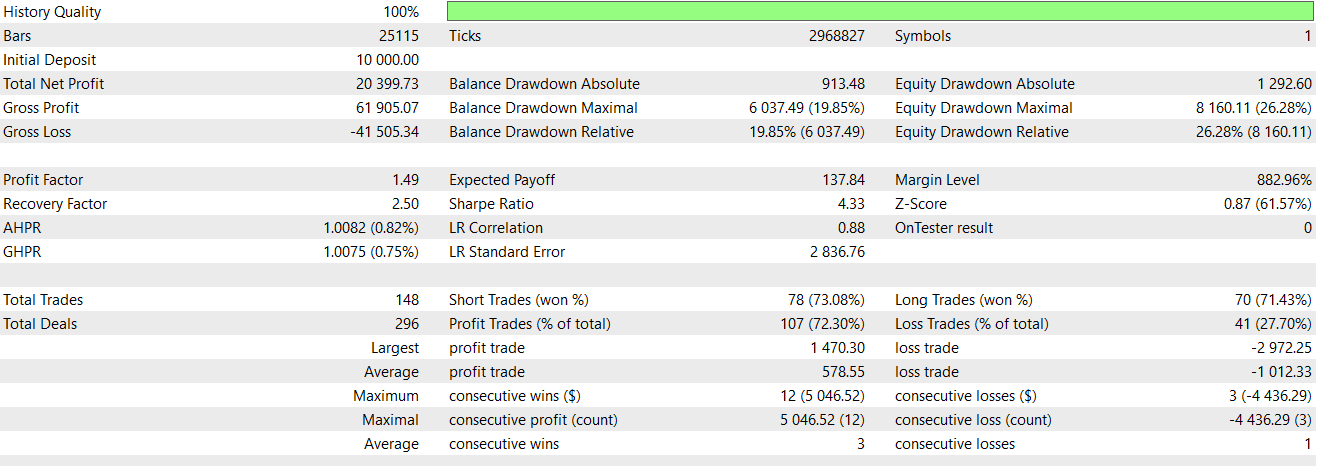
Even though this pattern eventually turns profitable in its forward walk portion, it is a bit of a struggle when compared to pattern-8 and a few others that we have covered above, such as pattern-4. Possible ways of improving it could come with adopting a secondary confirmation with other Ichimoku patterns. It is important also, with this signal pattern, to ensure that the cloud supports the trade direction. Setting stop loss can be based off recent price action and as already stressed this is not a pattern for sideways or choppy markets.
Conclusion
We have introduced another indicator pairing of the Ichimoku indicator and the ADX Wilder. This pairing, based on the limited 2-year time window of testing, has given us potentially seven signal patterns that could forward walk profitably. We are speaking potentially here because the test window we are using is very small, and as always the gist of this article is to be exploratory. In the next piece we will try to examine the three signal patterns that struggled to forward walk and see if machine learning can play a role, if at all, in turning their fortunes around.
| name | description |
|---|---|
| WZ-73.mq5 | Wizard Assembled Expert Advisor whose header shows files included in assembly |
| SignalWZ_73.mqh | Custom Signal Class file, used in MQL5 Wizard assembly. |
Warning: All rights to these materials are reserved by MetaQuotes Ltd. Copying or reprinting of these materials in whole or in part is prohibited.
This article was written by a user of the site and reflects their personal views. MetaQuotes Ltd is not responsible for the accuracy of the information presented, nor for any consequences resulting from the use of the solutions, strategies or recommendations described.
 Automating Trading Strategies in MQL5 (Part 22): Creating a Zone Recovery System for Envelopes Trend Trading
 Statistical Arbitrage Through Cointegrated Stocks (Part 1): Engle-Granger and Johansen Cointegration Tests
 From Novice to Expert: Animated News Headline Using MQL5 (IV) — Locally hosted AI model market insights
 Using association rules in Forex data analysis
- Free trading apps
- Over 8,000 signals for copying
- Economic news for exploring financial markets
You agree to website policy and terms of use