
MQL5とMetaTrader 5のインジケーターの再定義

はじめに
MQL5は、かつてはシンプルな自動売買ロボットを作成するための単純なプログラミング言語にすぎませんでしたが、現在では大きく進化しています。今日では、非常に高度な取引プログラムを構築し、より堅牢かつ便利な方法で展開・テストすることが可能です。
取引経験のある人であれば、誰もが一度は「ネイティブインジケーター」または「カスタムインジケーター」を使用したことがあるでしょう。MetaTrader 5は、インジケーターの読み込みやチャートへの適用を簡単に行えるインターフェイスを備えており、これによりトレーダー(特に裁量トレーダー)は、視覚的に市場分析をおこなうことができます。しかし、アルゴリズム取引において重要なのは、チャート上に表示される見た目ではなく、インジケーターの計算そのものです。
たとえば裁量取引では、移動平均線を視覚的に確認し、トレンドを判断するという使い方が一般的ですが、アルゴリズム取引では、終値がある期間の移動平均を上回っているか下回っているかといった「条件」に基づいてトレンドの有無を判断します。
アルゴリズム取引で特定のインジケーター(例:20期間の単純移動平均(SMA))を利用する場合は、以下が必要です。
int sma_handle; //Declare an indicator handle
//+------------------------------------------------------------------+
//| Expert initialization function                                   |
//+------------------------------------------------------------------+
int OnInit()
  {
   sma_handle = iMA(Symbol(), Period(), 20, 0, MODE_SMA, PRICE_CLOSE); //Initialize the indicator inside the OnInit function

//---
   return(INIT_SUCCEEDED);
  }
//+------------------------------------------------------------------+
//| Expert deinitialization function                                 |
//+------------------------------------------------------------------+
void OnDeinit(const int reason)
  {
//---

  }
//+------------------------------------------------------------------+
//| Expert tick function                                             |
//+------------------------------------------------------------------+
void OnTick()
  {
//---

   double sma_buffer[];
   CopyBuffer(sma_handle, 0, 0, 1, sma_buffer); //Copy the indicator buffers inside the Ontick function
  }
この方法は便利で、最低限の目的は果たせますが、正直なところ、やや強引で洗練されておらず、インジケーターに即時計算させるために渡す情報を柔軟かつ細かく制御することができません。
また、この従来のアプローチに基づくと、移動平均(MA)インジケーターは、ドキュメントで定義されている特定の価格定数のいずれかにしか適用できないとされています。
| ID | 説明 |
|---|---|
| PRICE_CLOSE | 終値 |
| PRICE_OPEN | 始値 |
| PRICE_HIGH | 期間の最高価格 |
| PRICE_LOW | 期間の最安価格 |
| PRICE_MEDIAN | 中央値、(高値 + 安値)/ 2 |
| PRICE_TYPICAL | 基準値、(高値 + 安値 + 終値)/3 |
| PRICE_WEIGHTED | 平均価格、(高値 + 安値 + 終値 + 終値)/4 |
使用できる平滑化手法もドキュメントに記載されているものに限定されています。
| ID | 説明 |
|---|---|
| MODE_SMA | 単純平均 |
| MODE_EMA | 指数平均 |
| MODE_SMMA | 平滑平均 |
| MODE_LWMA | 線形加重平均 |
既成概念にとらわれない何かを試してみたい場合はどうすればよいでしょうか。 たとえば、「高値と安値の差」に対する移動平均を計算したいと思っても、現在のアプローチではそれは不可能です。というのも、インジケーターに対して何をできるかが制限されているからです。
もちろん、インジケーターの多くは、その数学的定義や導出方法に基づいて設計されていることは承知しています。ですが、市場にまだ見ぬパターンを見出すために、より柔軟に入力値やパラメータをカスタマイズできたら、それは非常に魅力的なことではないでしょうか。
Technical Analysis (TA-Lib)Pythonライブラリにインスパイアされて、この革新的なアプローチでは、インジケーターに与える情報をより自由にコントロールできるようにし、即時に計算できる仕組みを目指しています。これは、トレーダーやアルゴリズム開発者にとって、新たな可能性を切り開く手段となるでしょう。

この記事では、「プラグアンドプレイ方式」を用いて、よく使われるインジケーターのいくつかを実装していきます。
以下の3つのカテゴリに分けます。
トレンド系インジケーター
- 単純移動平均(SMA: Simple Moving Average)
- 指数移動平均(EMA: Exponential Moving Average)
- ボリンジャーバンド(Bollinger Bands)
- パラボリックSAR (Parabolic SAR: Stop and Reverse)
- 標準偏差(Standard Deviation)
オシレーター系インジケーター
- 移動平均収束拡散(MACD: Moving Average Convergence Divergence)
- 相対力指数(RSI: Relative Strength Index)
- ストキャスティクス(Stochastic Oscillators)
- ATR (Average True Range)
- モメンタムインジケーター(Momentum Indicator)
ビルウィリアムズ系インジケーター
- ACオシレーター(Accelerator Oscillator)
- Awesome Oscillator
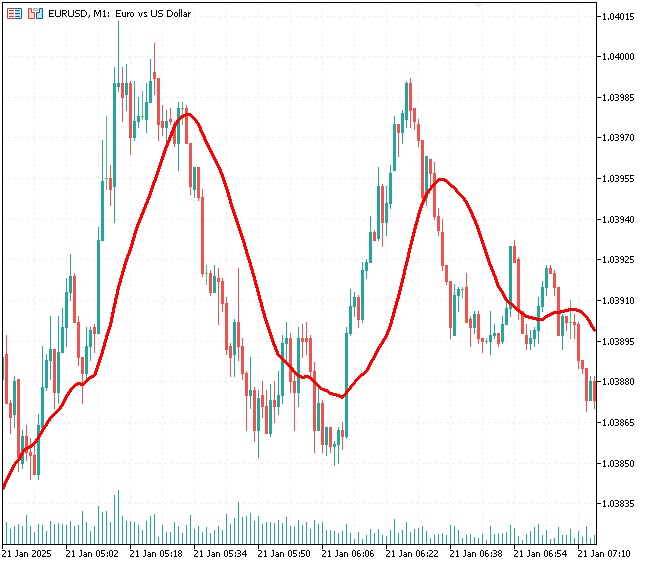
単純移動平均(SMA: Simple Moving Average)
これは最も一般的に使われるテクニカル指標の一つで、指定された期間の価格系列の平均を計算します。
以下の式で表されます。
![]()
ここで
![]() は価格(例えば
は価格(例えば![]() 期間中の終値)
期間中の終値)
![]() はSMAの期間
はSMAの期間
この式はベクトル化された関数で簡単に実装できます。
ファイル:ta-lib.mqh
vector CTrendIndicators::SMA(const vector &price, uint period, uint shift = 0)
  {
   uint size = (uint)price.Size();

   if(!CheckShiftPeriod(size, period, shift))
      return price;

//---

   vector ma(size);
   ma.Fill(NaN);

   for(uint i = shift + period - 1; i < size; i++) //Loop through all the prices considering the period and shift
     {
      double sum = 0;
      for(uint j = i - period + 1; j <= i; j++)
         sum += price[j]; //sum of the prices

      ma[i] = sum / period; //divided by period to find the mean of that period
     }

   return ma;
  }
これは単純移動平均(SMA)インジケーターの計算方法です。バッファを使わず、特定の銘柄でインジケーターを読み込む際のMQL5エラーのチェックもおこなわないため、手間がかかりません。
このミニマリスト的アプローチでは、shiftとperiodの値が正しいかだけをチェックし、正しければインジケーターの計算を実行し、計算結果をベクター形式で返します。ベクター形式を採用したのは、最終的な結果に対してより多くの制御と柔軟性を得るためです。
また、Indicatorsクラス内のすべての関数は静的メソッドなので、MQL5のプログラム内で簡単にインジケーターの値にアクセスできます。例えば、シンプルなスクリプトで以下のように使えます。
ファイル: Custom Indicators test script.mq5
#include <ta-lib.mqh>
//+------------------------------------------------------------------+
//| Script program start function                                    |
//+------------------------------------------------------------------+
void OnStart()
  {
     vector prices = {1,2,3,4,5,6,7,8,9,10};
     int period = 3;

     Print("SMA values: ", CTrendIndicators::SMA(prices, period));
  }
出力
2025.01.21 09:57:35.727 Custom Indicators test script (EURUSD,H1) SMA values: [nan,nan,2,3,4,5,6,7,8,9]
このようにして、ある値のベクターを与えるだけで単純移動平均インジケーターを計算することができました。これらの値を視覚的なインジケーターとしてプロットする方法については、後ほど詳しく説明します。
指数移動平均(EMA: Exponential Moving Average)
EMA(指数移動平均)は、SMA(単純移動平均)と同様に特定の期間にわたる価格の平均を計算しますが、直近の価格により大きな重みを置くため、価格変動をより敏感に反応します。
以下の式で表されます。
![]()
ここで
![]() は時刻tにおけるEMA
は時刻tにおけるEMA
は時刻tにおける価格
![]() は前期間のEMA、
は前期間のEMA、
![]() は平滑化係数(nは期間)です。
は平滑化係数(nは期間)です。
MQL5では次のように実装できます。
ファイル:ta-lib.mqh
vector CTrendIndicators::EMA(const vector &price, uint period, uint shift = 0)
  {
   uint size = (uint)price.Size();

   if(!CheckShiftPeriod(size, period, shift))
      return price;

//---

   double alpha = 2.0 / (period + 1.0);    // Smoothing factor

   vector res(size);
   res.Fill(NaN);

// Initialize the EMA with the SMA of the first period

   vector sma = SMA(price, period, shift);
   res[period - 1 + shift] = sma[period - 1 + shift];

// Calculate EMA for the rest of the prices

   for(ulong i = period + shift; i < size; i++)
      res[i] = alpha * price[i] + (1 - alpha) * res[i - 1];

   return res;
  }
計算済みインジケーター値はSMAの場合と同様に取得できます。
ファイル: Custom Indicators test script.mq5
void OnStart()
  {
     vector prices = {1,2,3,4,5,6,7,8,9,10};
     int period = 3;

     Print("EMA values: ", CTrendIndicators::EMA(prices, period));
  }
出力
2025.01.21 10:19:54.291 Custom Indicators test script (EURUSD,H1) EMA values: [nan,nan,2,3,4,5,6,7,8,9]
組み込みのIMAインジケーターでの計算方法とは異なり、本アプローチでは単純移動平均(SMA)と指数移動平均(EMA)をそれぞれ個別に計算し、希望する平滑化方法を柔軟に選択できるようにしています。
このような分離型のアプローチでは、すべての移動平均インジケーターに対応する平滑化手法を実装するために、追加のコードを記述する必要があります。
なお、MODE_SMMA(平滑平均化)やMODE_LWMA(線形加重平均化)などの平滑化手法については、SMAやEMAほど一般的に使用されていないと考えられるため、本ライブラリでは現時点では未実装となっています。
ボリンジャーバンド(Bollinger Bands)
これは、3本のバンドで構成されるボラティリティ系インジケーターです。
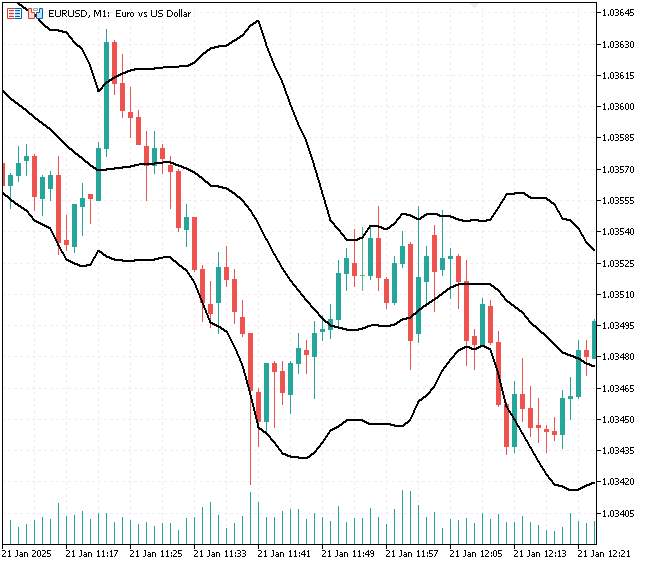
- ミドルバンドは、特定の期間における終値の単純移動平均(SMA)です。

- 上部のバンド(アッパーバンド)は、ミドルバンドに同期間の終値の標準偏差に倍率(通常は2)をかけた値を加えたものです。

- 下部のバンド(ロワーバンド)は、ミドルバンドから同期間の終値の標準偏差に倍率をかけた値を引いたものです。

ここで
![]() は倍率で、通常は2(ボリンジャーバンドの標準設定)
は倍率で、通常は2(ボリンジャーバンドの標準設定)
![]() は、SMAと標準偏差を計算するための期間
は、SMAと標準偏差を計算するための期間
このインジケーターは、ミドル・アッパー・ロワーの3つの一次元(1D)値、すなわち組み込みのボリンジャーバンドインジケーターでいう「バッファ」を返す必要があるため、関数の戻り値として3つのベクトルを含む構造体を使って返すようにします。
ファイル:ta-lib.mqh
struct BB_res_struct
  {
   vector            upper_band;
   vector            lower_band;
   vector            middle_band;
  };
BB_res_struct CTrendIndicators::BollingerBands(const vector &price, uint period, uint shift = 0, double k = 2.0)
  {
   uint size = (uint)price.Size();

   BB_res_struct res;

//--- Check for valid parameters
   if(!CheckShiftPeriod(size, period, shift))
      return res;

//--- Initialize vectors

   res.upper_band.Resize(size);
   res.lower_band.Resize(size);

   res.upper_band.Fill(NaN);
   res.lower_band.Fill(NaN);

//--- Calculate the middle band (SMA)

   res.middle_band = SMA(price, period, shift);

//--- Calculate the upper and lower bands

   for(uint i = shift + period - 1; i < size; i++)
     {
      double sum_squared_diff = 0;
      for(uint j = i - period + 1; j <= i; j++)
        {
         sum_squared_diff += MathPow(price[j] - res.middle_band[i], 2);
        }

      double std_dev = MathSqrt(sum_squared_diff / period);

      res.upper_band[i] = res.middle_band[i] + (k * std_dev);
      res.lower_band[i] = res.middle_band[i] - (k * std_dev);
     }

   return res;
  }
以下は、ボリンジャーバンドインジケーターを簡単に実装し、その値を取得する方法です。
ファイル: Custom Indicators test script.mq5
void OnStart()
  {
     vector prices = {1,2,3,4,5,6,7,8,9,10};
     int period = 3;

     BB_res_struct bb;
     bb = CTrendIndicators::BollingerBands(prices,period,0,2);

     Print("BB upper: ",bb.upper_band);
     Print("BB middle: ",bb.middle_band);
     Print("BB lower: ",bb.lower_band);
  }
出力
RL      0       11:39:21.000    Custom Indicators test script (EURUSD,H1)       BB upper: [nan,nan,3.632993161855452,4.632993161855453,5.632993161855453,6.632993161855453,7.632993161855453,8.632993161855453,9.632993161855453,10.63299316185545]
RO      0       11:39:21.000    Custom Indicators test script (EURUSD,H1)       BB middle: [nan,nan,2,3,4,5,6,7,8,9]
FF      0       11:39:21.000    Custom Indicators test script (EURUSD,H1)       BB lower: [nan,nan,0.3670068381445479,1.367006838144548,2.367006838144548,3.367006838144548,4.367006838144547,5.367006838144547,6.367006838144547,7.367006838144547]
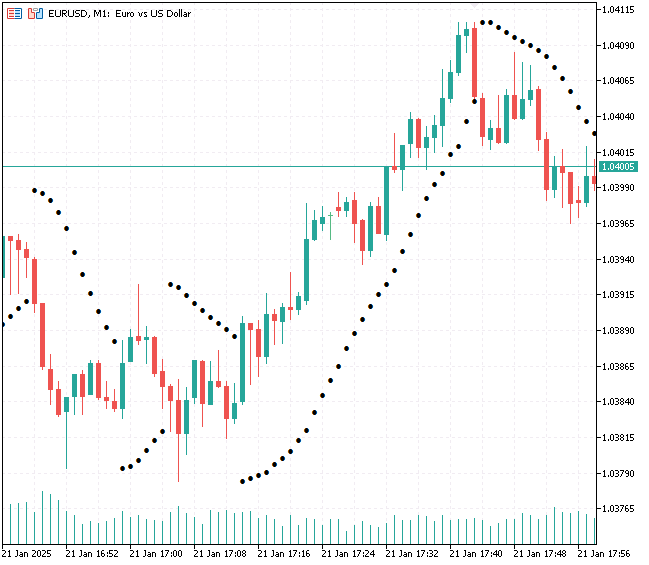
パラボリックSAR (Parabolic SAR: Stop and Reverse)
これは、トレンドフォロー型のインジケーターで、市場の潜在的な反転を検出するために使用されます。トレンドの方向に応じて、価格の上または下にドットを配置します。
以下の式で表されます。
上昇トレンドの場合
![]()
下降トレンドの場合
![]()
ここで
![]() は、次の期間のSAR値
は、次の期間のSAR値
![]() は、加速係数(初期値は例として0.02で、新しい高値または安値が更新されるたびに最大値0.2まで0.02ずつ増加)
は、加速係数(初期値は例として0.02で、新しい高値または安値が更新されるたびに最大値0.2まで0.02ずつ増加)
![]() は、極値点(上昇トレンドでは最高値、下降トレンドでは最低値)
は、極値点(上昇トレンドでは最高値、下降トレンドでは最低値)
このインジケーターは、MQL5では次のように実装できます。
ファイル:ta-lib.mqh
vector CTrendIndicators::ParabolicSAR(const vector &high,
                                      const vector &low,
                                      const vector &close,
                                      double step = 0.02,
                                      double max = 0.2)
  {
   uint size = (uint)close.Size();
   vector psar(size);
   psar.Fill(NaN);

// Initialize variables

   double AF = step;    // Acceleration Factor
   double EP = high[0];      // Extreme Point
   double SAR = low[0];      // Initial SAR
   bool isUptrend = true;    // Assume uptrend at the start

// Calculate Parabolic SAR

   for(uint i = 0; i < size; i++)
     {
      // Update SAR
      if(isUptrend)
         SAR = SAR + AF * (EP - SAR);
      else
         SAR = SAR + AF * (SAR - EP);

      // Determine if trend changes
      if(isUptrend && SAR > low[i])
        {
         // Switch to downtrend
         isUptrend = false;
         SAR = EP;            // Reset SAR to the most recent EP
         EP = low[i];         // Reset EP
         AF = step;      // Reset AF
        }

      else
         if(!isUptrend && SAR < high[i])
           {
            // Switch to uptrend
            isUptrend = true;
            SAR = EP;            // Reset SAR to the most recent EP
            EP = high[i];        // Reset EP
            AF = step;      // Reset AF
           }

      // Update EP and AF
      if(isUptrend)
        {
         if(high[i] > EP)
           {
            EP = high[i];
            AF = MathMin(AF + step, max);
           }
        }
      else
        {
         if(low[i] < EP)
           {
            EP = low[i];
            AF = MathMin(AF + step, max);
           }
        }

      // Store the SAR value
      psar[i] = SAR;
     }

   return psar;
  }
前述の2つのトレンドフォロー系インジケーターが価格入力として単一のベクターを受け取るのに対し、パラボリックSARは3つの価格値(高値、安値、終値)を考慮します。
ファイル: Custom Indicators test script.mq5
void OnStart()
  {
     vector close = {1,2,3,4,5,6,7,8,9,10};
     vector high = {1.5,2.5,3.5,4.5,5.5,6.5,7.5,8.5,9.5,10.5};
     vector low = {0.5,1.5,2.5,3.5,4.5,5.5,6.5,7.5,8.5,9.5};

     Print("Parabolic SAR values: ", CTrendIndicators::ParabolicSAR(high,low,close,0.02,0.2));
  }
出力
2025.01.21 11:11:03.525 Custom Indicators test script (EURUSD,H1) Parabolic SAR values: [1.5,0.5,0.54,0.6584000000000001,0.8888960000000001,1.25778432,1.782005888,2.46816518144,3.3126220560384,4.302602527072256]
標準偏差(Standard Deviation)
このインジケーターは、価格の平均からの変動または分散の量を測定します。市場のボラティリティを評価するためによく使用されます。
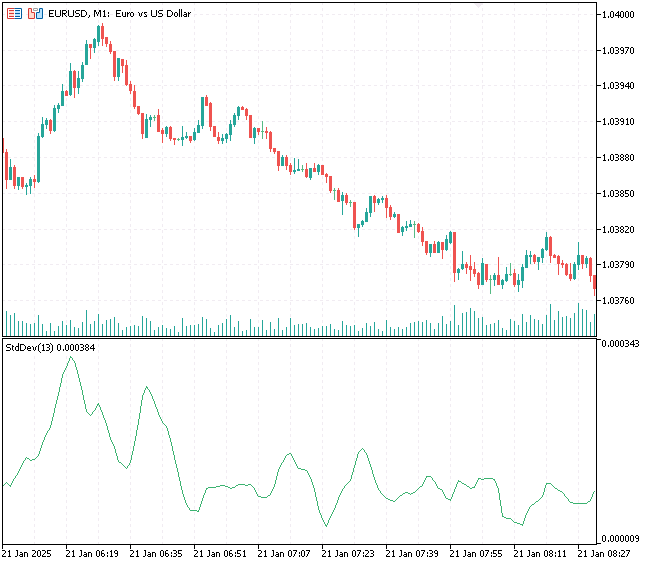
標準偏差値が高い場合はボラティリティが高いことを示し、標準偏差値が低い場合はボラティリティが低いことを示します。
以下の式で表されます。
![]()
ここで
![]() は標準偏差
は標準偏差
nは期間
![]() は価格帯
は価格帯
![]() はデータポイントの平均
はデータポイントの平均![]()
このインジケーターは次のようにMQL5で実装できます。
ファイル:ta-lib.mqh
vector CTrendIndicators::StandardDeviation(const vector &price, uint period, uint shift = 0)
  {
   uint size = (uint)price.Size();

// Check if the period and shift are valid
   if(!CheckShiftPeriod(size, period, shift))
      return price;

// Initialize standard deviation vector
   vector std_dev(size);
   std_dev.Fill(NaN);

// Loop through the price data
   for(uint i = shift + period - 1; i < size; i++)
     {
      double sum = 0.0;
      double sum_sq_diff = 0.0;

      // Calculate mean
      for(uint j = i - period + 1; j <= i; j++)
         sum += price[j];
      double mean = sum / period;

      // Calculate squared differences
      for(uint j = i - period + 1; j <= i; j++)
         sum_sq_diff += MathPow(price[j] - mean, 2);

      // Calculate standard deviation
      std_dev[i] = MathSqrt(sum_sq_diff / period);
     }

   return std_dev;
  }
これは次のように呼び出すことができる別の単純なインジケーターです。
ファイル: Custom Indicators test script.mq5
void OnStart()
  {
     vector prices = {1,2,3,4,5,6,7,8,9,10};
     int period = 3;

     Print("Stddev values: ", CTrendIndicators::StandardDeviation(prices, period));
  }
出力
2025.01.21 11:55:11.657 Custom Indicators test script (EURUSD,H1) Stddev values: [nan,nan,0.816496580927726,0.816496580927726,0.816496580927726,0.816496580927726,0.816496580927726,0.816496580927726,0.816496580927726,0.816496580927726]
移動平均収束拡散(MACD: Moving Average Convergence Divergence)
このオシレーターは、ある銘柄の価格における2つの移動平均の関係を示します。テクニカル分析ツールとして広く使用されています。

以下の式で表されます。
MACDメインライン
![]()
ここで
![]() はより短い期間の指数移動平均(例:12)
はより短い期間の指数移動平均(例:12)
![]() はより長い期間の指数移動平均(例:26)
はより長い期間の指数移動平均(例:26)
シグナルライン
![]()
これはMACDラインの平滑化されたEMAであり、通常は期間値が9です。
MACDヒストグラム
これはMACDラインとシグナルラインの差です。
![]()
ボリンジャーバンドの計算値を複数返したときと同様に、MACDヒストグラム、メインライン、シグナルラインの値を返すための構造体を定義します。
ファイル:ta-lib.mqh
struct MACD_res_struct
  {
   vector            main;     // The MACD Line
   vector            signal;   // The Signal Line
   vector            histogram;    // The MACD Histogram
  };
MACD_res_struct COscillatorIndicators::MACD(const vector &price, uint fast_ema = 12, uint slow_ema = 26, uint macd_sma = 9, uint shift = 0)
  {
   uint size = (uint)price.Size();

   MACD_res_struct res;
   if(!CheckShiftPeriod(size, slow_ema, shift))
      return res;

//--- Calculate EMA(short), EMA(long), and MACD Line

   vector fast_ema_vector = CTrendIndicators::EMA(price, fast_ema, shift);
   vector slow_ema_vector = CTrendIndicators::EMA(price, slow_ema, shift);

   res.main.Resize(size);
   res.main.Fill(NaN);

   for(uint i = 0; i < size; i++)
      res.main[i] = fast_ema_vector[i] - slow_ema_vector[i];

//--- Calculate Signal Line (SMA of MACD Line)

   res.signal = CTrendIndicators::SMA(price, macd_sma, shift);

//--- Calculate MACD Histogram

   res.histogram.Resize(size);
   res.histogram.Fill(NaN);

   for(uint i = 0; i < size; i++)
      res.histogram[i] = res.main[i] - res.signal[i];

   return res;
  }
次のようにテストスクリプト内でMACDオシレーターの計算値を簡単に取得できます。
ファイル:Custom Indicators test script.mq5
void OnStart()
  {
     vector prices = {1,2,3,4,5,6,7,8,9,10};

     MACD_res_struct macd;

     macd = COscillatorIndicators::MACD(prices,2,3,4);

     Print("MACD main: ", macd.main);
     Print("MACD signal: ", macd.signal);
  }
出力
RD      0       12:28:51.368    Custom Indicators test script (EURUSD,H1)       MACD main: [nan,nan,0.5,0.5,0.5,0.5,0.5,0.5,0.5,0.5]
HO      0       12:28:51.368    Custom Indicators test script (EURUSD,H1)       MACD signal: [nan,nan,nan,2.5,3.5,4.5,5.5,6.5,7.5,8.5]
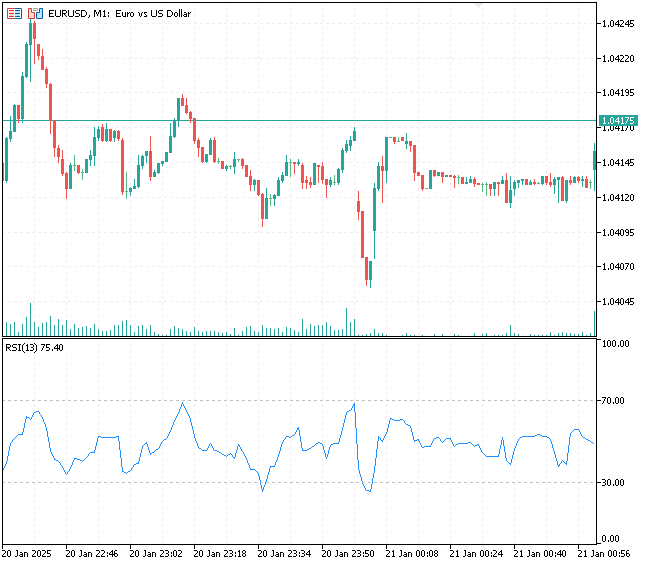
相対力指数(RSI: Relative Strength Index)
これはモメンタムオシレーターで、価格変動のスピードと大きさを測定します。0〜100の範囲で振動し、トレーダーはこれを使って市場の買われすぎや売られすぎの状態を識別します。
RSIインジケーターの計算には次の手順が含まれます。
01:指定された期間の平均利益と平均損失を求める
![]()
![]()
02:相対強度(RS)の計算
![]()
03:RSIの計算
![]()
MQL5での実装
vector COscillatorIndicators::RSI(const vector &price, uint period, uint shift = 0)
  {
   uint size = (uint)price.Size();

//--- Check for valid parameters
   if(!CheckShiftPeriod(size, period, shift))
      return price;

//--- Initialize vectors
   vector rsi(size), gains(size), losses(size);
   rsi.Fill(NaN);
   gains.Fill(0.0);
   losses.Fill(0.0);

//--- Calculate gains and losses
   for(uint i = shift + 1; i < size; i++)
     {
      double change = price[i] - price[i - 1];
      gains[i] = (change > 0) ? change : 0;
      losses[i] = (change < 0) ? -change : 0;
     }

//--- Initialize first average gain and loss (simple average for the first period)
   double avg_gain = 0, avg_loss = 0;
   for(uint i = shift + 1; i < shift + 1 + period; i++)
     {
      avg_gain += gains[i];
      avg_loss += losses[i];
     }
   avg_gain /= period;
   avg_loss /= period;

//--- Compute RSI for the rest of the periods
   for(uint i = shift + period; i < size; i++)
     {
      // Apply smoothing for average gain and loss
      avg_gain = ((avg_gain * (period - 1)) + gains[i]) / period;
      avg_loss = ((avg_loss * (period - 1)) + losses[i]) / period;

      // Calculate RSI
      double rs = (avg_loss == 0) ? 0 : avg_gain / avg_loss;
      rsi[i] = (avg_loss == 0) ? 100 : (100 - (100 / (1 + rs)));
     }

   return rsi;
  }
以下は、RSIインジケーターから値を取得する方法です。
void OnStart()
  {
     vector prices = {1,2,3,4,5,6,7,8,9,10};
     int period = 3;

     Print("RSI values: ", COscillatorIndicators::RSI(prices,period));
  }
出力
2025.01.21 12:51:29.640 Custom Indicators test script (EURUSD,H1) RSI values: [nan,nan,nan,100,100,100,100,100,100,100]
ストキャスティクス
これは、特定の期間における証券の終値を、その期間内の価格レンジと比較するモメンタム系インジケーターです。
このインジケーターの計算には以下の要素が含まれます。
%Kライン
![]()
ここで
![]() は現在の終値
は現在の終値
![]() はルックバック期間中の最安価格
はルックバック期間中の最安価格
![]() はルックバック期間中の最高価格
はルックバック期間中の最高価格
%Dライン
これは、通常3期間の単純移動平均(SMA)を使用して計算される%Kラインの移動平均です。
以下は、このインジケーターをMQL5で実装する方法です。
Stochastic_struct COscillatorIndicators::StochasticOscillator(const vector &high, const vector &low, const vector &close, uint k_period = 5, uint d_period = 3, uint period = 3, uint shift = 0)
  {
   uint size = (uint)close.Size();

   Stochastic_struct res;

// Check for valid parameters
   if(!CheckShiftPeriod(size, period, shift))
      return res;

// Initialize vectors for %K and %D
   vector K(size), D(size);
   K.Fill(NaN);
   D.Fill(NaN);

// Calculate %K
   for(uint i = shift + period - 1; i < size; i++)
     {
      double H_max = -DBL_MAX, L_min = DBL_MAX;

      // Find the highest high and the lowest low over the lookback period
      for(uint j = i - period + 1; j <= i; j++)
        {
         H_max = MathMax(H_max, high[j]);
         L_min = MathMin(L_min, low[j]);
        }

      // Calculate %K
      double K_value = (H_max - L_min != 0) ? ((close[i] - L_min) / (H_max - L_min)) * 100 : 0;
      K[i] = K_value;
     }

// Smooth %K with a simple moving average (k_period)
   vector smoothedK(size);
   smoothedK.Fill(NaN);

   for(uint i = shift + k_period - 1; i < size; i++)
     {
      double sum = 0;
      for(uint j = i - k_period + 1; j <= i; j++)
        {
         sum += K[j];
        }
      smoothedK[i] = sum / k_period;
     }

// Calculate %D (3-period moving average of %K)

   D = CTrendIndicators::SMA(smoothedK, period, shift);

   res.main = K;
   res.signal = D;

   return res;
  }
シグナルとメインラインを構造体で返します。
void OnStart()
  {
     vector close = {1,2,3,4,5,6,7,8,9,10};
     vector high = {1.5,2.5,3.5,4.5,5.5,6.5,7.5,8.5,9.5,10.5};
     vector low = {0.5,1.5,2.5,3.5,4.5,5.5,6.5,7.5,8.5,9.5};

     Stochastic_struct stoch;
     stoch = COscillatorIndicators::StochasticOscillator(high,low,close,5,3,3);

     Print("Stoch main: ", stoch.main);
     Print("Stoch signal: ", stoch.signal);
  }
ATR (Average True Range)
これは市場のボラティリティを理解するのに役立つインジケーターです。指定された期間の高値と安値の平均範囲を測定します。

以下の式で表されます。
01:True Range (TR)の計算
![]()
ここで
Hは現在の期間の最高値
![]() は今期の安値
は今期の安値
![]() は前期の終値
は前期の終値
02:ATR (Average True Range)の計算
ATRは、一定期間における「トゥルーレンジ(真の値幅)」の移動平均です。
![]() 、ここでSMAは単純移動平均です。
、ここでSMAは単純移動平均です。
このインジケーターは、MQL5では次のように実装できます。
vector COscillatorIndicators::ATR(const vector &high, const vector &low, const vector &close, uint period = 14, uint shift = 0)
  {
   uint size = (uint)close.Size();

// Check for valid parameters
   if(!CheckShiftPeriod(size, period, shift))
      return close;

// Initialize the True Range (TR) and ATR vectors
   vector TR(size);
   TR.Fill(NaN);

// Calculate the True Range for each period
   for(uint i = shift + 1; i < size; i++)
     {
      double H = high[i];
      double L = low[i];
      double C_prev = close[i - 1];

      // Calculate the three possible True Range values
      double TR1 = H - L;
      double TR2 = MathAbs(H - C_prev);
      double TR3 = MathAbs(L - C_prev);

      // True Range is the maximum of the three
      TR[i] = MathMax(TR1, MathMax(TR2, TR3));
     }

//--- Smooth the True Range using a simple moving average (SMA) over the specified period

   return CTrendIndicators::SMA(TR, period, shift);
  }
以下に、このインジケーターの値を取得する方法を示します。
void OnStart()
  {
     vector close = {1,2,3,4,5,6,7,8,9,10};
     vector high = {1.5,2.5,3.5,4.5,5.5,6.5,7.5,8.5,9.5,10.5};
     vector low = {0.5,1.5,2.5,3.5,4.5,5.5,6.5,7.5,8.5,9.5};

     Print("ATR values: ", COscillatorIndicators::ATR(high,low,close,3));
  }
出力
2025.01.21 13:57:59.943 Custom Indicators test script (EURUSD,H1) ATR values: [nan,nan,nan,1.5,1.5,1.5,1.5,1.5,1.5,1.5]
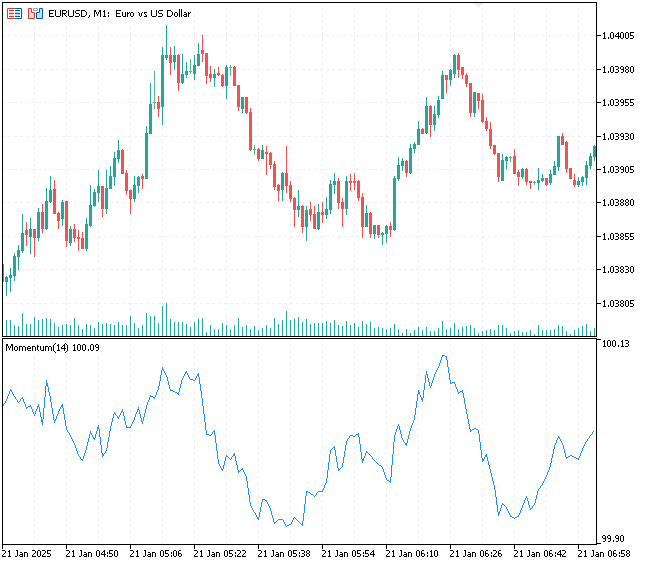
モメンタムインジケーター(Momentum Indicator)
これは、特定の期間における資産価格の変動スピードを測定するためのシンプルなインジケーターです。トレンドやその転換点を特定するのに役立ちます。
簡単な式で表されます。
![]()
ここで
Momentum(t)は時刻tにおけるモメンタム値
Price(t)は現在の価格
Price(t - n)はn期間前の価格
nはモメンタムを計算する期間
モメンタムを計算する際には、比率を用いるバリエーションもあります。
![]()
このバリエーションを使用してモメンタムインジケーターを実装します。
MQL5での実装
vector COscillatorIndicators::MomentumIndicator(const vector &price, uint period, uint shift = 0)
  {
   uint size = (uint)price.Size();

// Check for valid input
   if(!CheckShiftPeriod(size, period, shift))
      return price;

// Initialize the momentum vector
   vector momentum(size);
   momentum.Fill(NaN);

// Calculate Momentum
   for(uint i = shift + period; i < size; i++)
     {
      //momentum[i] = price[i] - price[i - period]; // Momentum difference formula

      // using the ratio formula:
      momentum[i] = (price[i] / price[i - period]) * 100;
     }

   return momentum;
  }
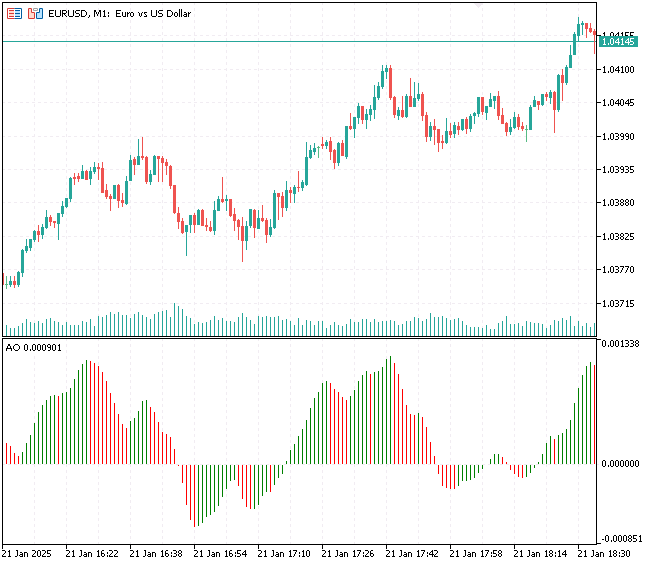
Awesome Oscillator
これはモメンタムインジケーターで、中央値価格((高値 + 安値) ÷ 2)の2つの単純移動平均(SMA)の差を計算します。
以下の式で表されます。
![]()
ここで
![]() はより短い期間のSMA(通常5)
はより短い期間のSMA(通常5)
![]() はより長い期間のSMA(通常34)
はより長い期間のSMA(通常34)
以下はMQL5での実装です。
vector CBillWilliamsIndicators::AwesomeOscillator(const vector &high, const vector &low, uint fast_period = 5, uint slow_period = 34, uint shift = 0)
  {
   uint size = (uint)high.Size();
   if(size != low.Size())
      return vector::Zeros(0); // Ensure high and low vectors are of the same size

   if(!CheckShiftPeriod(size, slow_period, shift))
      return vector::Zeros(0); // Validate shift and slow period

// Initialize vectors
   vector ao(size), median_price(size);
   ao.Fill(NaN);
   median_price.Fill(NaN);

// Calculate Median Price
   for(uint i = 0; i < size; i++)
      median_price[i] = (high[i] + low[i]) / 2;

// Calculate Fast and Slow SMAs of the Median Price
   vector sma_fast = CTrendIndicators::SMA(median_price, fast_period, shift);
   vector sma_slow = CTrendIndicators::SMA(median_price, slow_period, shift);

// Calculate AO
   for(uint i = 0; i < size; i++)
      ao[i] = sma_fast[i] - sma_slow[i];

   return ao;
  }
高値と安値のベクトルは非常に単純なので、高速期間を3に、低速期間を5に設定できます。
void OnStart()
  {
     vector close = {1,2,3,4,5,6,7,8,9,10};
     vector high = {1.5,2.5,3.5,4.5,5.5,6.5,7.5,8.5,9.5,10.5};
     vector low = {0.5,1.5,2.5,3.5,4.5,5.5,6.5,7.5,8.5,9.5};

     Print("AO values: ", CBillWilliamsIndicators::AwesomeOscillator(high,low,3,5));
  }
出力
2025.01.21 14:25:50.590 Custom Indicators test script (EURUSD,H1) AO values: [nan,nan,nan,nan,1,1,1,1,1,1]
ACオシレーター(Accelerator Oscillator)
ACオシレーター(Accelerator Oscillator)は、価格モメンタムの変化速度を追跡するテクニカル分析ツールです。これは、市場の推進力が加速しているのか減速しているのかを示し、トレーダーが潜在的な反転を予測するのに役立ちます。
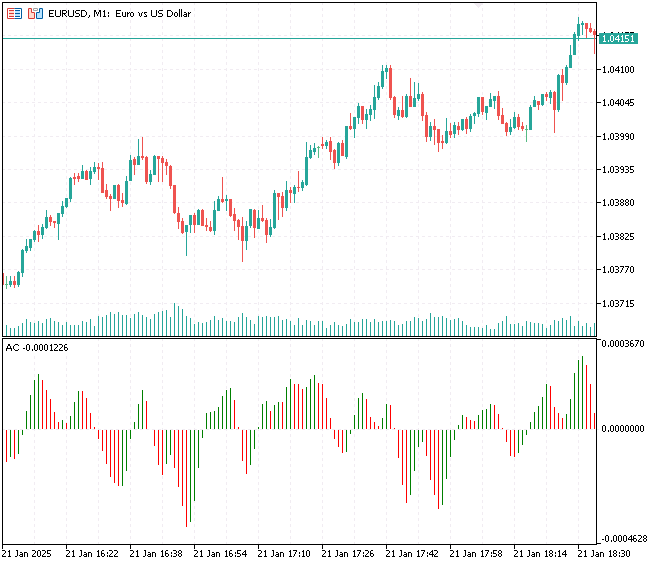
これは、Awesome Oscillator (AO)と、そのAOの5期間単純移動平均(SMA)の差として計算されます。
以下の式で表されます。
このインジケーターは、MQL5では次のように実装できます。
vector CBillWilliamsIndicators::AcceleratorOscillator(const vector &high,
      const vector &low,
      uint ao_period_fast = 5, // Fast period for AO
      uint ao_period_slow = 34, // Slow period for AO
      uint ac_period = 5 // Period for AC SMA
                                                     )
  {
   uint size = (uint)high.Size();
   if(size != low.Size())
      return vector::Zeros(0); // Ensure high and low vectors are of the same size


// Validate shift and period
   if(!CheckShiftPeriod(size, ao_period_slow, 0))
      return vector::Zeros(0);

// Calculate AO (Awesome Oscillator)

   vector ao = AwesomeOscillator(high, low, ao_period_fast, ao_period_slow);

// Calculate AC (Accelerator Oscillator)

   vector ac(size);
   ac.Fill(NaN);

   vector ao_sma_ac = CTrendIndicators::SMA(ao, ac_period);

   for(uint i = 0; i < size; i++)
      ac[i] = ao[i] - ao_sma_ac[i];

   return ac;
  }
ACオシレーターはAwesome Oscillatorと非常に似ているため、同様の引数を使用してその関数を呼び出すことができます。
void OnStart()
  {
     vector close = {1,2,3,4,5,6,7,8,9,10};
     vector high = {1.5,2.5,3.5,4.5,5.5,6.5,7.5,8.5,9.5,10.5};
     vector low = {0.5,1.5,2.5,3.5,4.5,5.5,6.5,7.5,8.5,9.5};

//--- Bill williams indicator

     Print("AO values: ", CBillWilliamsIndicators::AwesomeOscillator(high,low,3,5));
     Print("AC values: ", CBillWilliamsIndicators::AcceleratorOscillator(high,low,3,5));
  }
出力
MQ      0       14:40:36.296    Custom Indicators test script (EURUSD,H1)       AO values: [nan,nan,nan,nan,1,1,1,1,1,1]
EL      0       14:40:36.296    Custom Indicators test script (EURUSD,H1)       AC values: [nan,nan,nan,nan,nan,nan,nan,nan,0,0]
インジケーターデータ収集の簡素化
これまでにライブラリでいくつかのインジケーターがどのように実装されているかを見てきましたが、次は市場から取得したい情報を自由に集め、それをもとにインジケーターを作成してみましょう。たとえば、始値、高値、安値、終値の移動平均を計算してみます。
まずはOHLCの値を取得することから始めます。
int size = 1000;

vector open, high, low, close;

open.CopyRates(Symbol(), Period(), COPY_RATES_OPEN, 1, size);
high.CopyRates(Symbol(), Period(), COPY_RATES_HIGH, 1, size);
low.CopyRates(Symbol(), Period(), COPY_RATES_LOW, 1, size);
close.CopyRates(Symbol(), Period(), COPY_RATES_CLOSE, 1, size);
まず、期間20の単純移動平均(SMA)を始値に適用することから始めます。
vector sma_open = CTrendIndicators::SMA(open, 20);
異なる期間や異なる価格に対して、さまざまなSMAインジケーターを手軽に収集することができます。
vector sma_open = CTrendIndicators::SMA(open, 20);
vector sma_high = CTrendIndicators::SMA(high, 50);
vector sma_low = CTrendIndicators::SMA(low, 100);
vector sma_close = CTrendIndicators::SMA(close, 20);
それらをまとめて行列に格納し、一緒に観察してみましょう。
matrix Indicators(size, 4);

Indicators.Col(CTrendIndicators::SMA(open, 20), 0);
Indicators.Col(CTrendIndicators::SMA(high, 50), 1);
Indicators.Col(CTrendIndicators::SMA(low, 100), 2);
Indicators.Col(CTrendIndicators::SMA(close, 20), 3);

Print("Indicators matrix\n",Indicators);
出力
NK      0       18:30:25.100    Custom Indicators test script (EURUSD,H1)        [1.0485715,1.0484514,nan,1.048488]
LL      0       18:30:25.100    Custom Indicators test script (EURUSD,H1)        [1.0484425,1.0485544,nan,1.0484265]
RP      0       18:30:25.100    Custom Indicators test script (EURUSD,H1)        [1.048381,1.0486754,nan,1.048299]
QG      0       18:30:25.100    Custom Indicators test script (EURUSD,H1)        [1.0483055,1.0488004,nan,1.048152]
KK      0       18:30:25.100    Custom Indicators test script (EURUSD,H1)        [1.0481585,1.0489198,nan,1.048296]
HL      0       18:30:25.100    Custom Indicators test script (EURUSD,H1)        [1.048303,1.049033,nan,1.0485255]
DS      0       18:30:25.100    Custom Indicators test script (EURUSD,H1)        [1.048533,1.0491756,nan,1.0487015]
OK      0       18:30:25.100    Custom Indicators test script (EURUSD,H1)        [1.048658,1.0493158,1.0475226,1.0488295]
KD      0       18:30:25.100    Custom Indicators test script (EURUSD,H1)        [1.0487895,1.0494628,1.047473,1.0488985]
JR      0       18:30:25.100    Custom Indicators test script (EURUSD,H1)        [1.0488575,1.0494916,1.0474256,1.0489465]
FR      0       18:30:25.100    Custom Indicators test script (EURUSD,H1)        [1.0489055,1.049475,1.0473723,1.0490045]
LL      0       18:30:25.100    Custom Indicators test script (EURUSD,H1)        [1.048964,1.0494814,1.0473137,1.049052]
HK      0       18:30:25.100    Custom Indicators test script (EURUSD,H1)        [1.0490075,1.0494728,1.0472494,1.0491065]
CF      0       18:30:25.100    Custom Indicators test script (EURUSD,H1)        [1.049062,1.0494618,1.0471845,1.049044]
RE      0       18:30:25.100    Custom Indicators test script (EURUSD,H1)        [1.0489995,1.0494452,1.047114,1.048892]
FQ      0       18:30:25.100    Custom Indicators test script (EURUSD,H1)        [1.048848,1.0494558,1.047044,1.0487065]
CL      0       18:30:25.100    Custom Indicators test script (EURUSD,H1)        [1.0486625,1.0495002,1.0469762,1.0486305]
DK      0       18:30:25.100    Custom Indicators test script (EURUSD,H1)        [1.048586,1.0496014,1.0469234,1.048582]
EE      0       18:30:25.100    Custom Indicators test script (EURUSD,H1)        [1.0485375,1.0496714,1.0468866,1.048646]
RE      0       18:30:25.100    Custom Indicators test script (EURUSD,H1)        [1.0486015,1.0497982,1.046857200000001,1.04877]
IP      0       18:30:25.100    Custom Indicators test script (EURUSD,H1)        [1.0487245,1.0498646,1.0468378,1.0490025]
DO      0       18:30:25.100    Custom Indicators test script (EURUSD,H1)        [1.0489565,1.0499466,1.046833500000001,1.0492415]
GN      0       18:30:25.100    Custom Indicators test script (EURUSD,H1)        [1.0491975,1.050113,1.046846700000001,1.0497525]
CK      0       18:30:25.100    Custom Indicators test script (EURUSD,H1)        [1.0497085,1.0502838,1.046881000000001,1.0502025]
IJ      0       18:30:25.100    Custom Indicators test script (EURUSD,H1)        [1.050159,1.0503826,1.046898100000001,1.0506915]
PF      0       18:30:25.100    Custom Indicators test script (EURUSD,H1)        [1.0506475,1.0504916,1.046935200000001,1.051158…]
これらの変数に基づいてモメンタムインジケーターを作成し、それらの変数のモメンタムを測定したいとします。
Indicators.Col(COscillatorIndicators::MomentumIndicator(open, 20), 4);
Indicators.Col(COscillatorIndicators::MomentumIndicator(high, 50), 5);
Indicators.Col(COscillatorIndicators::MomentumIndicator(low, 100), 6);
Indicators.Col(COscillatorIndicators::MomentumIndicator(close, 20), 7);
出力
IN      0       18:39:34.172    Custom Indicators test script (EURUSD,H1)        [1.0441885,nan,nan,1.0438975,99.43679181343492,nan,nan,99.44502817843157]
LN      0       18:39:34.172    Custom Indicators test script (EURUSD,H1)        [1.0438975,1.0495116,nan,1.043593,99.44407828753189,nan,nan,99.41864350150351]
QS      0       18:39:34.172    Custom Indicators test script (EURUSD,H1)        [1.0435925,1.0492638,nan,1.0433225,99.4176888931316,98.82473464044848,nan,99.4833645288208]
HG      0       18:39:34.172    Custom Indicators test script (EURUSD,H1)        [1.0436275,1.049148199999999,nan,1.043363,100.0668474731655,99.45161810609009,nan,100.0773424743863]
EH      0       18:39:34.172    Custom Indicators test script (EURUSD,H1)        [1.0436685,1.0490618,nan,1.043385,100.0782973197491,99.59030385797199,nan,100.0420047732697]
KO      0       18:39:34.172    Custom Indicators test script (EURUSD,H1)        [1.0436925,1.0489454,nan,1.0434175,100.0458251389074,99.4479854313681,nan,100.0620536907626]
JQ      0       18:39:34.172    Custom Indicators test script (EURUSD,H1)        [1.0437225,1.048834,nan,1.043484,100.0572803299347,99.47183265534476,nan,100.1270939444036]
JE      0       18:39:34.172    Custom Indicators test script (EURUSD,H1)        [1.043788,1.048718,nan,1.0435725,100.1251839535195,99.45010144680205,nan,100.1690625149243]
LE      0       18:39:34.172    Custom Indicators test script (EURUSD,H1)        [1.043877,1.048595199999999,nan,1.0435315,100.1700192943244,99.41799844546816,nan,99.92180198737388]
MI      0       18:39:34.172    Custom Indicators test script (EURUSD,H1)        [1.0438365,1.048457,nan,1.0437085,99.92275488503829,99.34503611305946,nan,100.3389538390831]
HN      0       18:39:34.172    Custom Indicators test script (EURUSD,H1)        [1.044013,1.0483164,nan,1.044095,100.3379931060896,99.33386396801032,nan,100.7431263218612]
KS      0       18:39:34.172    Custom Indicators test script (EURUSD,H1)        [1.0443985,1.048186,nan,1.044364,100.7411964891704,99.38227742565063,nan,100.5158345877638]
EE      0       18:39:34.172    Custom Indicators test script (EURUSD,H1)        [1.0446665,1.0480502,nan,1.044532,100.5139219145509,99.35649569733499,nan,100.3225558712848…]
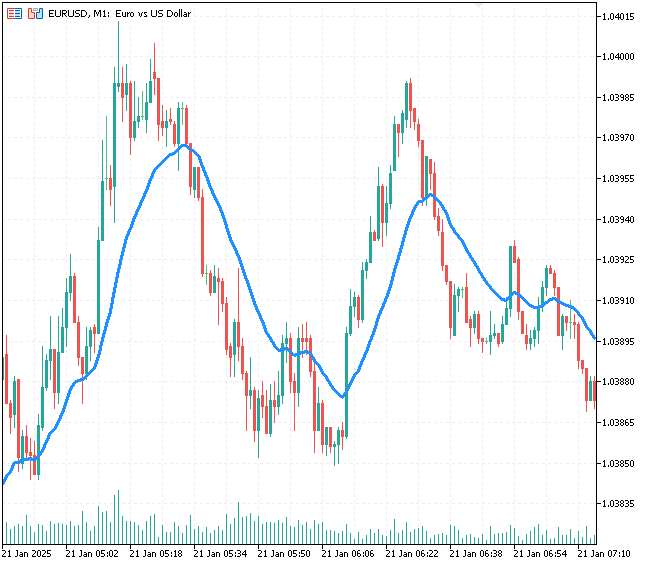
カスタム関数で作成されたインジケーターのプロット
このライブラリから取得したインジケーター計算結果を人の目に見える形にしてみましょう。
この手法は主にデータ収集を目的としていますが、MetaTrader 5のカスタムインジケーターで計算結果を可視化してみます。
以下は、SMA(期間20)インジケーターの可視化です。
#property indicator_chart_window
#property indicator_buffers 1
#property indicator_plots 1

#property indicator_color1 clrDodgerBlue
#property indicator_type1 DRAW_LINE
#property indicator_style1 STYLE_SOLID

#include <ta-lib.mqh>

input int period_ = 20; //SMA period

double buffer[];
//+------------------------------------------------------------------+
//| Custom indicator initialization function                         |
//+------------------------------------------------------------------+
int OnInit()
  {
//--- indicator buffers mapping

   SetIndexBuffer(0, buffer, INDICATOR_DATA);
   PlotIndexSetDouble(0, PLOT_EMPTY_VALUE, 0);

   PlotIndexSetString(0,PLOT_LABEL,"SMA("+string(period_)+")");
   PlotIndexSetInteger(0,PLOT_DRAW_BEGIN,period_+1);

//---
   return(INIT_SUCCEEDED);
  }
//+------------------------------------------------------------------+
//| Custom indicator iteration function                              |
//+------------------------------------------------------------------+
int OnCalculate(const int rates_total,
                const int prev_calculated,
                const datetime &time[],
                const double &open[],
                const double &high[],
                const double &low[],
                const double &close[],
                const long &tick_volume[],
                const long &volume[],
                const int &spread[])
  {
//---

   if (prev_calculated==0) //Initial indicator calculation, For Plotting the entire past
     {
       vector buffer_vector = CTrendIndicators::SMA(close, period_);

       VectorToArray(buffer_vector, buffer); //We assign the calculations into an array format
     }
    else //For plotting the current value
     {
       for (int i=prev_calculated-1; i<rates_total; i++) //Loop from the prev_calculated bars -1 to the total bars present
        {
           double temp_close[]; //For storing temporary close values
           int size = period_*2; //We are going to copy an equivalent of period x 2 to leave a room for NaN values

           if (ArrayCopy(temp_close, close, 0, i - size, size) < 0)
            {
               printf("Failed to copy closing price values to a temporary array, err = %d",GetLastError());
               continue;
            }

           vector indicator_values = CTrendIndicators::SMA(temp_close, period_);
           ulong last_index = indicator_values.Size() - 1; //The last value in the vector is the recent calculated indicator value

           buffer[i] = indicator_values[last_index]; //Assing the last indicator value to the last value in the buffer
        }
     }

//--- return value of prev_calculated for next call
   return(rates_total);
  }
//+------------------------------------------------------------------+
//|      A crude way to convert a vector into Array                  |
//+------------------------------------------------------------------+
template <typename T>
void VectorToArray(const vector<T> &v, T &arr[])
 {
   ArrayResize(arr, (uint)v.Size());

   for (uint i=0; i<(uint)v.Size(); i++)
       arr[i] = v[i];
 }
出力

最後に
このカスタム指標値収集の手法は、特定のタスクというよりもデータ収集に非常に便利であり、データ分析や分析目的で指標データを革新的に集めたいトレーダーや開発者に最適です。
インジケーターを初期化したり、MetaTrader 5でエラーを引き起こす面倒な作業を繰り返すことなく、複数のインジケーター値を素早く取得したい場面が多々あります。近年、MQL5が高度なAIや機械学習モデルを扱えるようになったことで、データの需要が増大しており、分析や機械学習のトレーニングに使うための指標データを効率的に抽出し、可視化する新しい方法が求められています。
では、また。
添付ファイルの表
| ファイル名 | 説明/用途 |
|---|---|
| Include\ta-lib.mqh | この記事で説明したすべてのインジケーターコードを含む MQL5ライブラリ |
| Indicators\Trend Indicators Redefined.mq5 | デモ用に実装された単純移動平均インジケーターを含むインジケーター |
| Scripts\Custom Indicators test script.mq5 | インジケータコードのテストとデバッグ用に作成されたシンプルなスクリプト |
情報源と参考文献
- Relative Strength Index (RSI) Indicator Explained With Formula
- Moving Average (MA):Purpose, Uses, Formula, and Examples
- How to Use Bollinger Bands to Gauge Trends
- Parabolic SAR Indicator:Definition, Formula, Trading Strategies
- Standard Deviation Formula and Uses vs.Variance
- What is MACD?
- Stochastic Oscillator:What It Is, How It Works, How To Calculate
- Average True Range (ATR) Formula, What It Means, and How to Use It
MetaQuotes Ltdにより英語から翻訳されました。
元の記事: https://www.mql5.com/en/articles/16931
警告: これらの資料についてのすべての権利はMetaQuotes Ltd.が保有しています。これらの資料の全部または一部の複製や再プリントは禁じられています。
この記事はサイトのユーザーによって執筆されたものであり、著者の個人的な見解を反映しています。MetaQuotes Ltdは、提示された情報の正確性や、記載されているソリューション、戦略、または推奨事項の使用によって生じたいかなる結果についても責任を負いません。


 ログレコードをマスターする(第4回):ログをファイルに保存する
- 無料取引アプリ
- 8千を超えるシグナルをコピー
- 金融ニュースで金融マーケットを探索