Join our fan page
- Views:
- 28007
- Rating:
- Published:
- Updated:
-
Need a robot or indicator based on this code? Order it on Freelance Go to Freelance
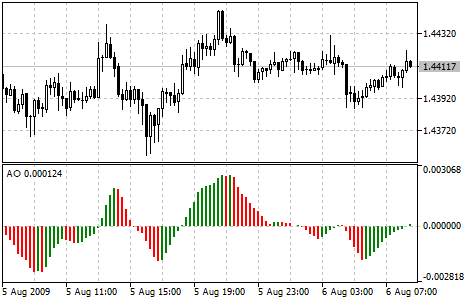
Bill Williams's Awesome Oscillator (AO) is a 34-period simple moving average, plotted through the middle points of the bars (H+L)/2, which is subtracted from the 5-period simple moving average, built across the central points of the bars (H+L)/2.
It shows us quite clearly what’s happening to the market driving force at the present moment. (B. Williams: "New Trading Dimensions: How to Profit from Chaos in Stocks, Bonds and Commodities").
Signals to Buy:
"Saucer" is the only signal to buy that comes when the bar chart is higher than the zero line. One must bear in mind:
- the saucer signal is generated when the bar chart reversed its direction from the downward to upward. The second column is lower than the first one and is colored red. The third column is higher than the second and is colored green;
- for the saucer signal to be generated the bar chart should have at least three columns.
Keep in mind, that all Awesome Oscillator columns should be over the zero line for the saucer signal to be used.
"Zero line crossing" is the signal to buy generated when the bar chart passes from the area of negative values to that of positive. It comes when the bar chart crosses the zero line. As regards this signal:
- for this signal to be generated, only two columns are necessary;
- the first column is to be below the zero line, the second one is to cross it (transition from a negative value to a positive one);
- simultaneous generation of signals to buy and to sell is impossible.
"Two pikes" is the only signal to buy that can be generated when the bar chart values are below the zero line. As regards this signal, please, bear in mind:
- the signal is generated, when you have a pike pointing down (the lowest minimum) which is below the zero line and is followed by another down-pointing pike which is somewhat higher (a negative figure with a lesser absolute value, which is therefore closer to the zero line), than the previous down-looking pike;
- the bar chart is to be below the zero line between the two pikes. If the bar chart crosses the zero line in the section between the pikes, the signal to buy doesn’t function. However, a different signal to buy will be generated — zero line crossing;
- each new pike of the bar chart is to be higher (a negative number of a lesser absolute value that is closer to the zero line) than the previous pike;
- if an additional higher pike is formed (that is closer to the zero line) and the bar chart has not crossed the zero line, an additional signal to buy will be generated.
Signals to Sell:
Awesome Oscillator signals to sell are identical to the signals to buy. The saucer signal is reversed and is below zero. zero line crossing is on the decrease - the first column of it is over the zero, the second one is under it. The two pikes signal is higher than the zero line and is reversed too.

Awesome Oscillator Indicator
Calculation:
AO is a 34-period simple moving average, plotted through the central points of the bars (H+L)/2, and subtracted from the 5-period simple moving average, graphed across the central points of the bars (H+L)/2.
MEDIAN PRICE = (HIGH + LOW) / 2
AO = SMA (MEDIAN PRICE, 5) - SMA (MEDIAN PRICE, 34)
where:
- MEDIAN PRICE - median price;
- HIGH - the highest price of the bar;
- LOW - the lowest price of the bar;
- SMA - Simple Moving Average.
Translated from Russian by MetaQuotes Ltd.
Original code: https://www.mql5.com/ru/code/13
 Average True Range (ATR)
Average True Range Technical Indicator (ATR) is an indicator that shows volatility of the market.
 Accumulation Swing Index (ASI)
ASI was created by Wales Wilder as an ordinary fluctuations indicator that gets signals from previous maximums and minimums of price.
 Plombiers - oscillator in the channel.
Sometimes this is useful - to observe the behavior of the oscillator in the channel. Greatly simplifies the evaluation of the situation.
 Accumulation/Distribution
The Accumulation/Distribution Indicator is determined by the changes in price and volume.