MetaForecast M5
- インディケータ
-
Vahidreza Heidar Gholami
 I'm a software engineer with over 15 years of experience in programming and software development. As an active member of the MQL5 community, I strive to deliver high-quality products. My goal is to create efficient and productive tools for traders, and I have a wealth of innovative ideas to achieve
 - バージョン: 3.6
- アップデート済み: 8 3月 2025
- アクティベーション: 10
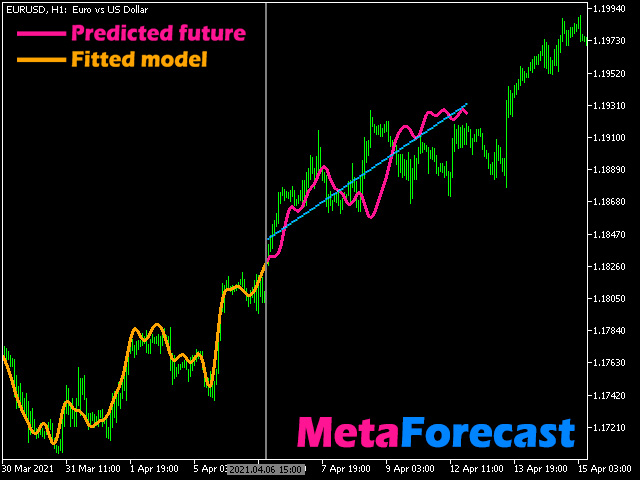
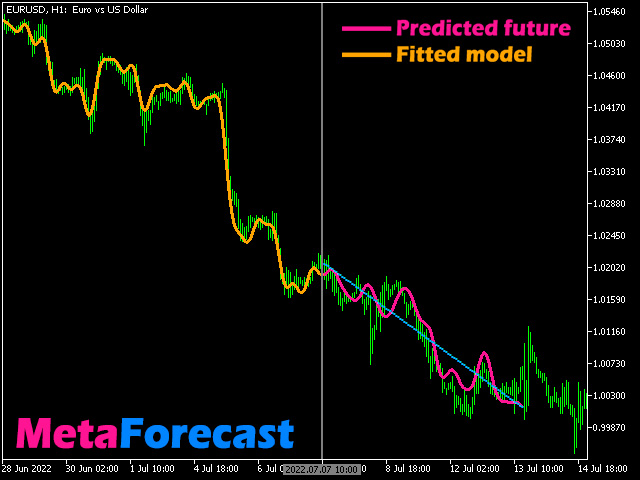
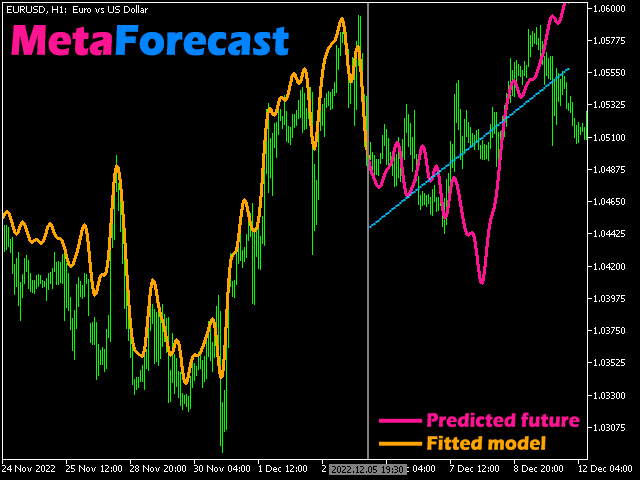
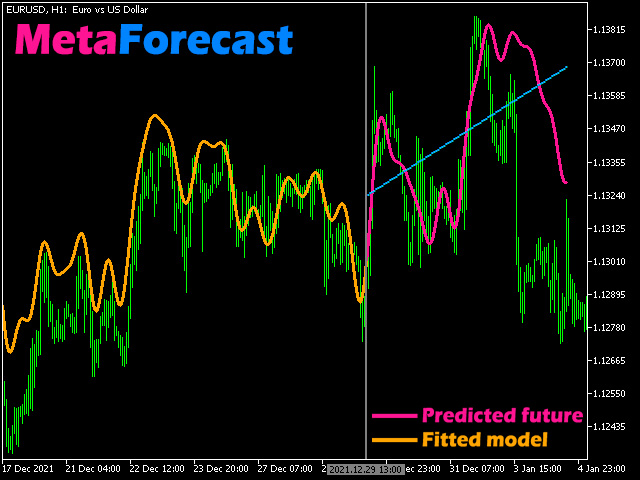
MetaForecastは、価格データのハーモニクスに基づいて、どんな市場の未来を予測し視覚化します。市場が常に予測可能ではありませんが、価格にパターンがある場合、MetaForecastは可能な限り正確な未来を予測できます。他の類似製品と比較して、MetaForecastは市場のトレンドを分析することでより正確な結果を生成することができます。
入力パラメータ
Past size (過去のサイズ)
MetaForecastが将来の予測を生成するために使用するバーの数を指定します。モデルは選択したバー上に描かれた黄色の線で表されます。
Future size (将来のサイズ)
予測すべき将来のバーの数を指定します。予測された将来は、ピンクの線で表示され、その上に青い回帰線が描かれます。
Degree (程度)
この入力は、MetaForecastが市場で行う分析のレベルを決定します。
| Degree | 説明 |
|---|---|
| 0 | Degree 0の場合、価格の全てのピークや谷、そして詳細をカバーするために、「Past size」の入力に大きな値を使用することが推奨されています。 |
| 1 (推奨) | Degree 1の場合、MetaForecastはトレンドを理解し、より良い結果を生成するために、より小さな「Past size」を使用することができます。 |
| 2 | Degree 2の場合、トレンドに加えて、MetaForecastは転換点も特定することができます。Degreeが1より大きい場合、'Details'と'Noise Reduction'の入力にはより高い値を使用する必要があります。 |
| 2より大きい | Degree 2を超える度数を使用することは推奨されていませんが、試してみることもできます。 |
Details (詳細)
予測生成のために抽出する価格データの詳細の割合を指定します。より高い値を設定するほど、処理時間が長くなります。
Noise Reduction (ノイズの削減)
Degreeが1より大きい場合、MetaForecastは適切なモデルを作成するために、入力データのノイズを削減する必要があります。例えば、degree=2の場合、ノイズ削減を90%に設定します。より良い結果を得るためには、詳細度を20%に増やしてください。
Remove jumps (ジャンプを除去する)
時には、特に度数が1より高い場合、予測結果に大きなジャンプが生じることがあります。この入力を有効にすることで、予測の形状を修正することができます。
Regression lines (回帰直線)
MetaForecastは、予測されたバーに回帰直線を描画し、トレンドをより明確にします。この入力を使用して、直線の数を指定してください。
Calculate per n bars (nバーごとに計算する)
この入力を使用して、2つの予測間の間隔を設定します。例えば、100と設定すると、次の予測を行う前に100バーの間を空けます。
MetaForecastは、トレーダーが価格の過去データから将来の価格変動を予測し、その結果を実際の将来の価格と比較することを可能にします。この機能を使用するには、キーボードの "H" を押して垂直線を表示し、予測を現在のキャンドルではなく歴史的な価格に対応させることができます。過去のデータを参照するには、"Ctrl"キーを押しながらマウスを動かして垂直線を移動させます。現在のキャンドルに戻るには、再度 "H" を押します。もし複数のMetaForecastをチャート上に表示しており、同時にリセットしたい場合は、キーボードの "R" キーを押します。
私は常に市場の将来を予測するための新しいアイデアを探求しています。新しい有効な手法やアルゴリズムを発見するたびに、それを製品に取り入れます。このユニークな提案を続けて開発するために、あなたのサポートをいただけると幸いです。


I absolutely love it. You don't need to waste your time searching out all the support and resistance levels. For me it is very very lucrative trading the 1 hr timeframe with this indicator. Especially on pairs that are more trendy. Even BTC trading is easily possible with this indicator. Absolutely great!