SmartMass MT5
- Indikatoren
-
Roberto Alvarez
 I'm Engineer and algorithmic programmer.
My passion is learning more and more about AI, machine learning, data science and robotics.
I love trading, of course. - Version: 3.13
- Aktualisiert: 16 Januar 2024
- Aktivierungen: 5
SMARTMASS-INDIKATOR
Dieser Indikator unterscheidet sich von allen bekannten Volumenindikatoren. Es handelt sich um einen Algorithmus, der die Kursbewegung mit dem Volumen in Beziehung setzt und versucht, die Proportionalität und die effiziente Bewegung zu finden, während er das Rauschen und andere Bewegungen herausfiltert, die eher zufällig sind und nicht einem Trend oder einer Umkehrung folgen. Letztendlich zeigt er die wahre Stärke der Bewegung auf, indem er angibt, ob sie von Bullen oder Bären unterstützt wird oder ob es sich lediglich um eine Bewegung mit hohem Volumen handelt, die den Ausgleich von Handelskonten erklärt, wie er beispielsweise am Ende einer Börsensitzung vorkommt.
Es spielt keine Rolle, ob es sich um echtes Volumen oder um Tick-Volumen handelt. Wenn der Broker groß genug ist, korreliert das Tick-Volumen mit dem realen Volumen. Dieser Indikator liefert ungefähre, aber an die Realität angepasste Informationen, die Ihnen helfen, bessere Entscheidungen zu treffen und die Erfolgswahrscheinlichkeit zu erhöhen.
EINGABEPARAMETER
Allgemeine Parameter:
Generische Daten. Diese Daten sind bereits für die normale Verwendung des Indikators optimiert. Es ist nicht notwendig, diese Werte zu ändern, es sei denn, in sehr spezifischen Situationen oder für spezielle Tests.
Chart-Optionen:
Aktivieren oder Deaktivieren von Kurven. Farbauswahl.
Impuls-Erkennung:
Aktivieren oder deaktivieren Sie die Impuls-Erkennung. Auswahl der Farbe.
Warnungen:
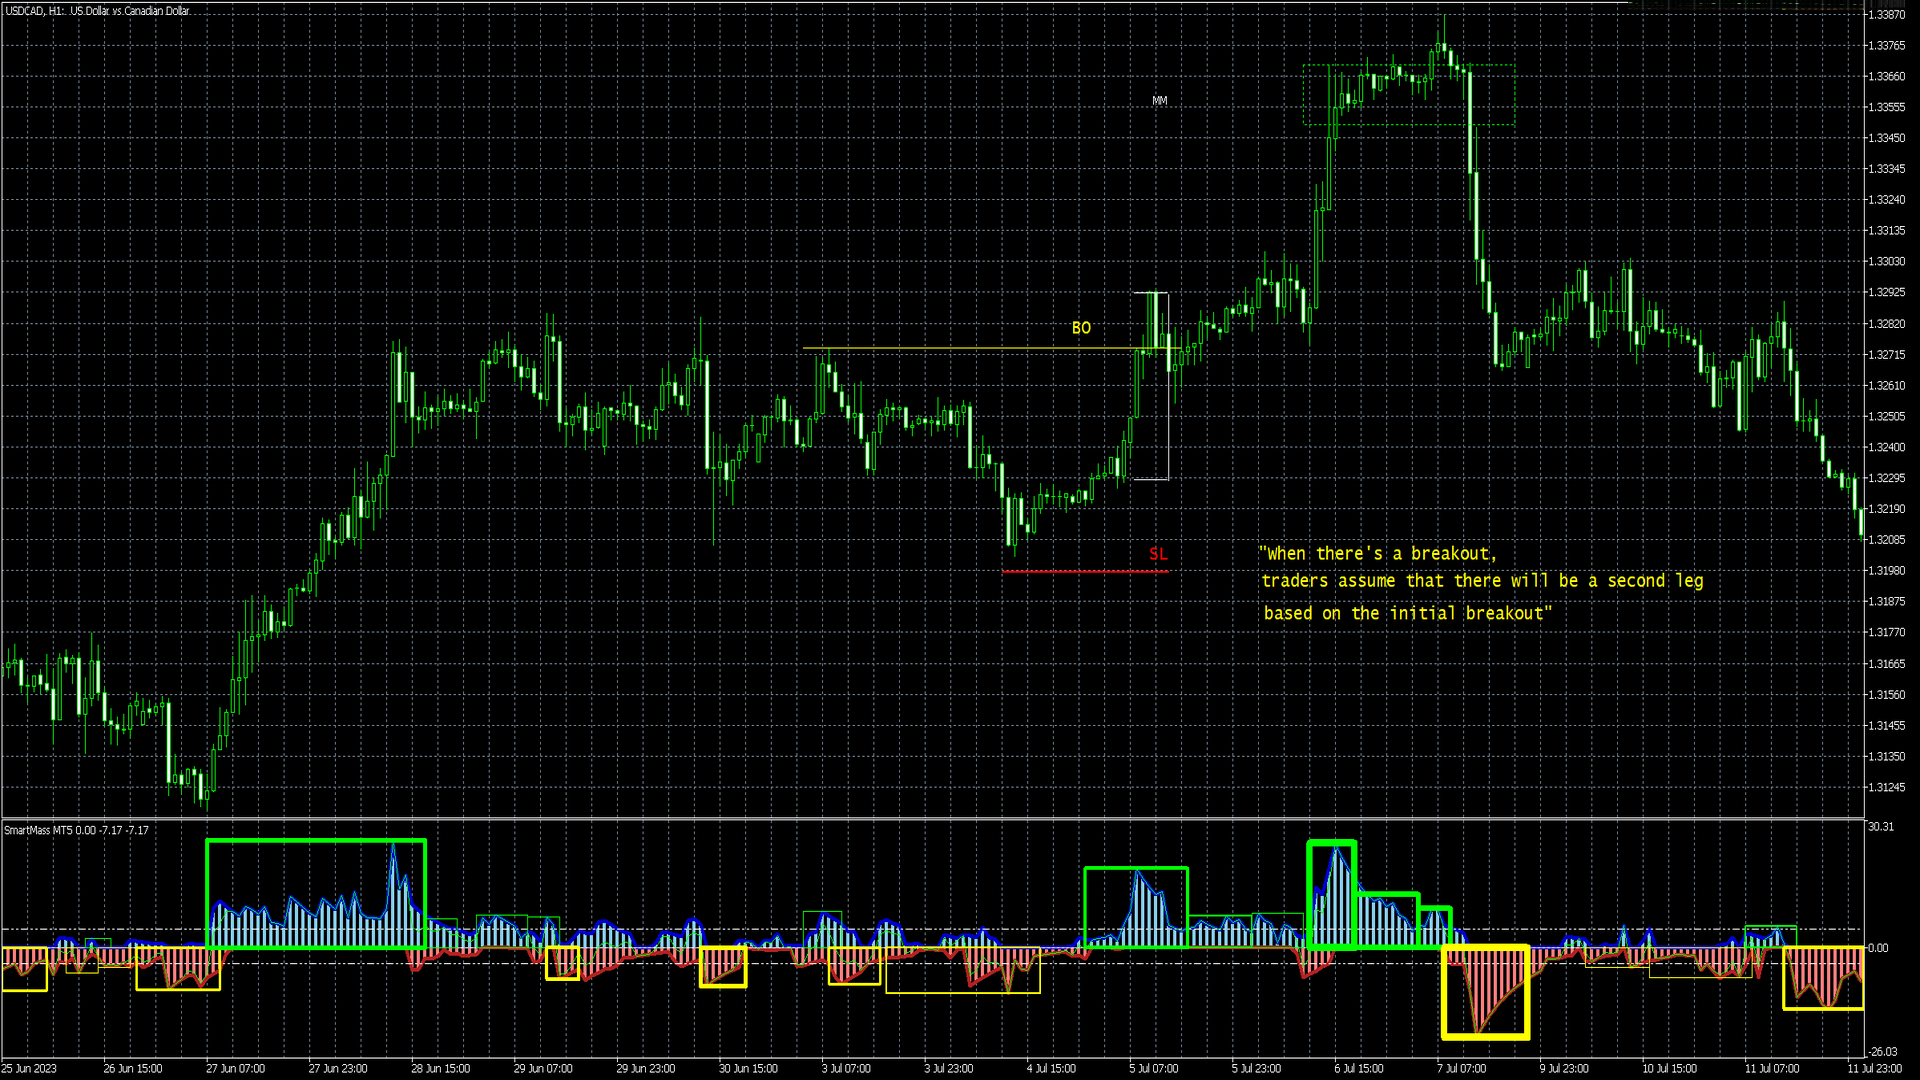
Konfigurieren Sie verschiedene Arten von Alarmen, um über Marktimpulse informiert zu bleiben. Bei diesen Impulsen kann es sich um Ausbrüche von Unterstützungen oder Widerständen handeln, die in vielen Fällen der Fortsetzung einer weitreichenden Bewegung in Trendrichtung oder umgekehrt einer Umkehrbewegung vorausgehen.
Töne:
Es besteht die Möglichkeit, akustische Warnungen zu konfigurieren.
WIE KANN UNS DER SMARTMASS-INDIKATOR HELFEN?
Der SmartMass-Indikator ist ein Instrument, das den Händler auf folgende Weise unterstützt:
-
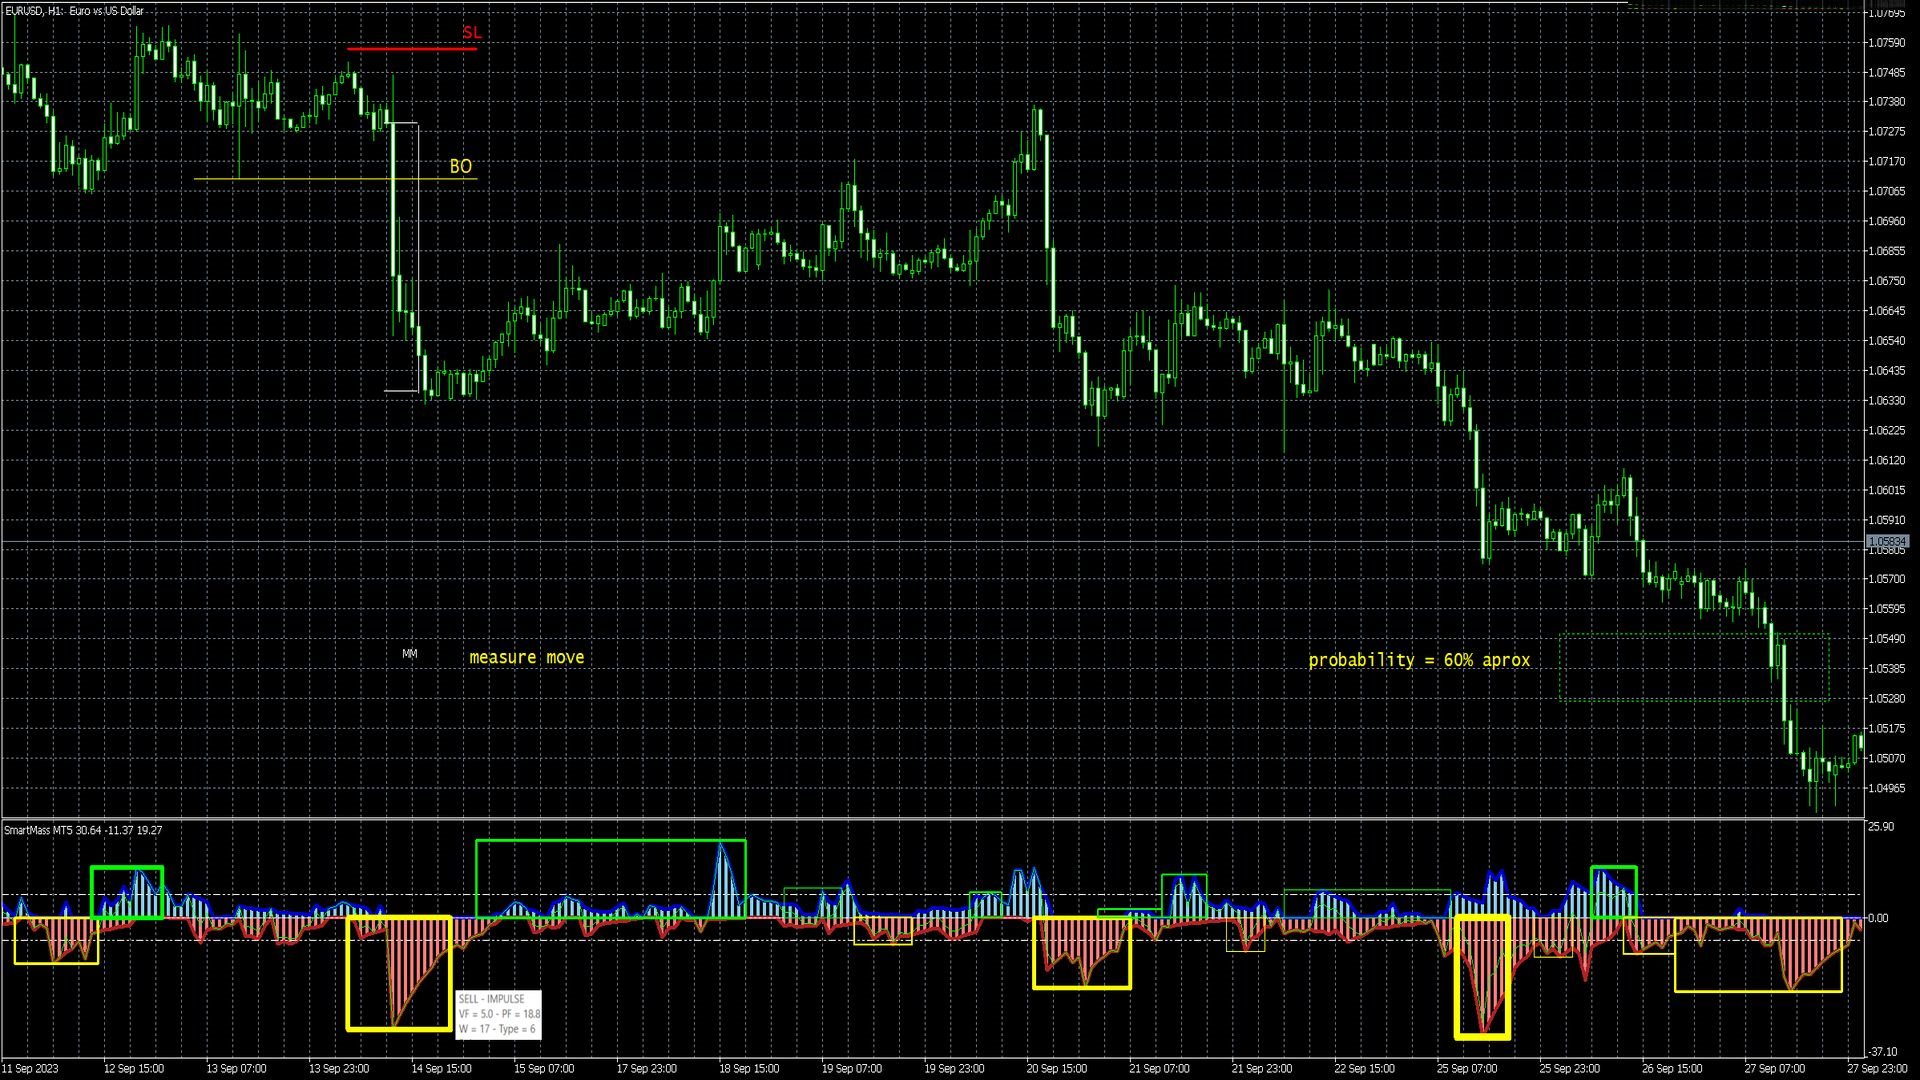
Er erkennt signifikante Bewegungen, bei denen eine klare Absicht der Bullen oder Bären vorliegt: Der SmartMass-Indikator kann signifikante Marktbewegungen identifizieren, bei denen die Marktteilnehmer, ob Bullen oder Bären, eine klare Absicht zeigen. Das bedeutet, dass er Händlern helfen kann, Momente zu identifizieren, in denen sich eine signifikante Änderung der Kursrichtung abzeichnet, was für Handelsentscheidungen nützlich sein kann.
-
Hilft, das Gleichgewicht zwischen Volumen und Preis besser zu verstehen: Der SmartMass-Indikator liefert auch Informationen über das Verhältnis zwischen Volumen (ob Tickvolumen oder Handelsvolumen) und Preis. Dies ist wichtig, da sich der Markt die meiste Zeit in einer Spanne oder einem Kanal befindet, in dem sich die Kurse seitwärts bewegen. Starke Ausbrüche oder Trendwechsel treten jedoch nur in etwa 10 % der Zeit auf. Der Indikator ermöglicht es Händlern, zu erkennen, wann das Gleichgewicht zwischen Volumen und Preis in die eine oder andere Richtung kippt, und ermöglicht es ihnen, ihre Strategien entsprechend vorzubereiten. Mit anderen Worten, er hilft dabei, Momente zu erkennen, in denen der Markt kurz davor steht, aus seiner üblichen Handelsspanne oder seinem Kanal auszubrechen, was eine Gelegenheit bietet, von bedeutenden Kursbewegungen zu profitieren.
-
Der SmartMass-Indikator kann als wertvolle Ergänzung zur Price-Action-Analyse beim Handel betrachtet werden. Die Price-Action-Analyse basiert auf der Untersuchung von Kursbewegungen und -mustern auf dem Chart, ohne sich auf externe technische oder fundamentale Indikatoren zu stützen. In diesem Zusammenhang kann der SmartMass-Indikator zusätzliche und objektive Informationen liefern, die dem Händler helfen können, präzisere und fundiertere Entscheidungen zu treffen.
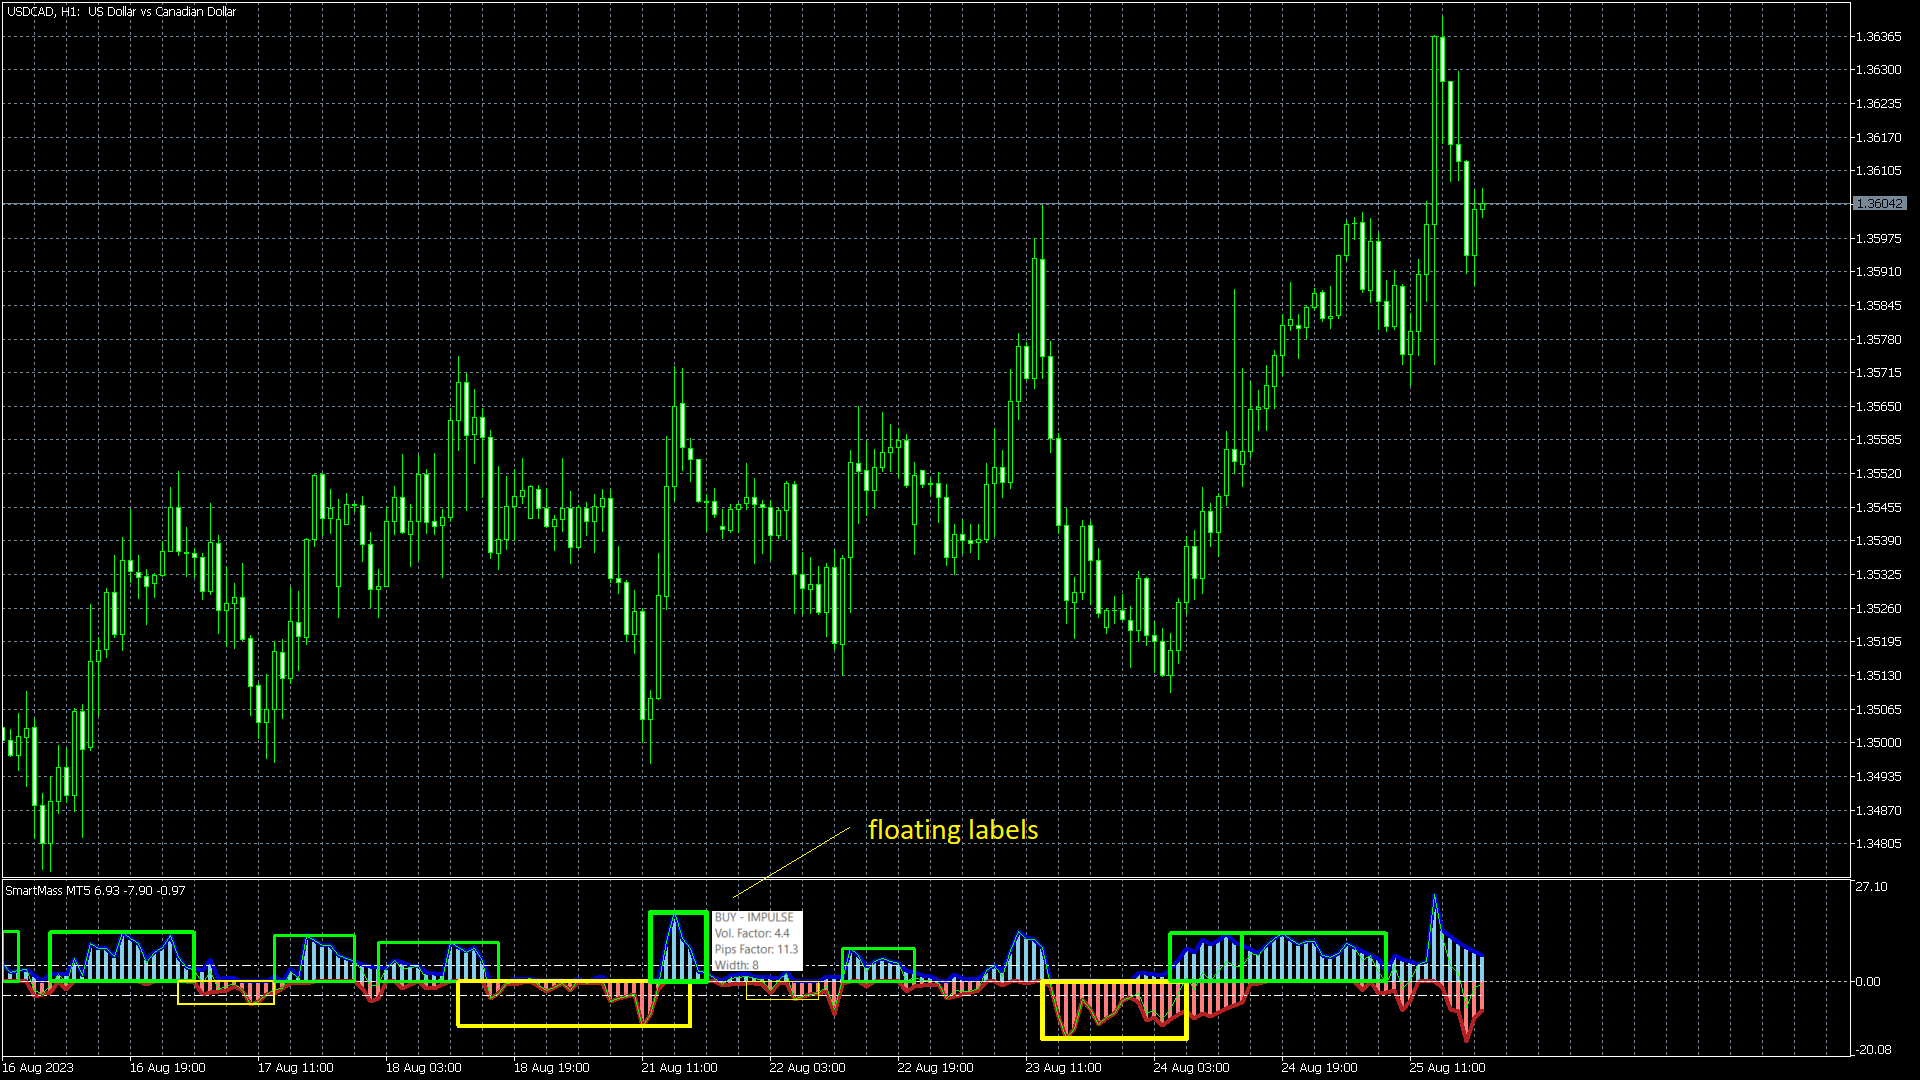
DAS IMPULSKONZEPT DES SMARTMASS INDIKATORS
Der SmartMass-Indikator hilft nicht nur bei der Erkennung von Impulsen im Chart, sondern kategorisiert sie auch anhand von drei Schlüsselparametern: Amplitude, Breite und Preiseffekt. Diese drei Parameter werden verwendet, um jedem Impuls einen numerischen Wert zuzuweisen, der von 1 bis 10 reicht. Diese Klassifizierung funktioniert folgendermaßen:
- Amplitude (VF): Die Amplitude bezieht sich auf das Ausmaß oder die Stärke des Momentums. Je höher die Amplitude, desto stärker ist der Impuls. Im Zusammenhang mit dem SmartMass-Indikator wird bewertet, wie stark sich der Preis während des Momentums ändert, und auf der Grundlage dieses Ausmaßes wird ein numerischer Wert zugewiesen. Größere Impulse erhalten eine höhere Punktzahl.
- Breite (W): Die Breite bezieht sich auf die Dauer des Momentums in Bezug auf die Zeit (Anzahl der Kerzen). Ein breiteres Momentum ist ein Momentum, das sich über einen längeren Zeitraum erstreckt. Der SmartMass-Indikator bewertet, wie lange das Momentum anhält, und weist einen numerischen Wert auf der Grundlage seiner Dauer zu. Länger anhaltende Impulse erhalten einen niedrigeren Wert.
- Preiseffekt (PF): Dieser Parameter bewertet, wie das Momentum den Preis beeinflusst. Ein Momentum, das einen signifikanten Kursausbruch oder einen Trendwechsel bewirkt, hat beispielsweise eine stärkere Wirkung auf den Kurs als ein Momentum, das nur zu einer geringen Bewegung führt. Der SmartMass-Indikator analysiert die Auswirkung des Momentums auf den Kurs und weist ihm einen numerischen Wert zu, der auf seiner Bedeutung für die Kursänderung basiert. Impulse, die eine stärkere Wirkung auf den Kurs haben, erhalten einen höheren Wert.
- Klassifizierung (Typ): Der SmartMass-Indikator verwendet diese drei Parameter (Amplitude, Breite und Preiseffekt), um die Impulse auf einer Skala von 1 bis 10 zu klassifizieren, wobei 1 für schwächere und weniger bedeutende Impulse und 10 für stärkere und bedeutendere Impulse auf dem Markt steht.
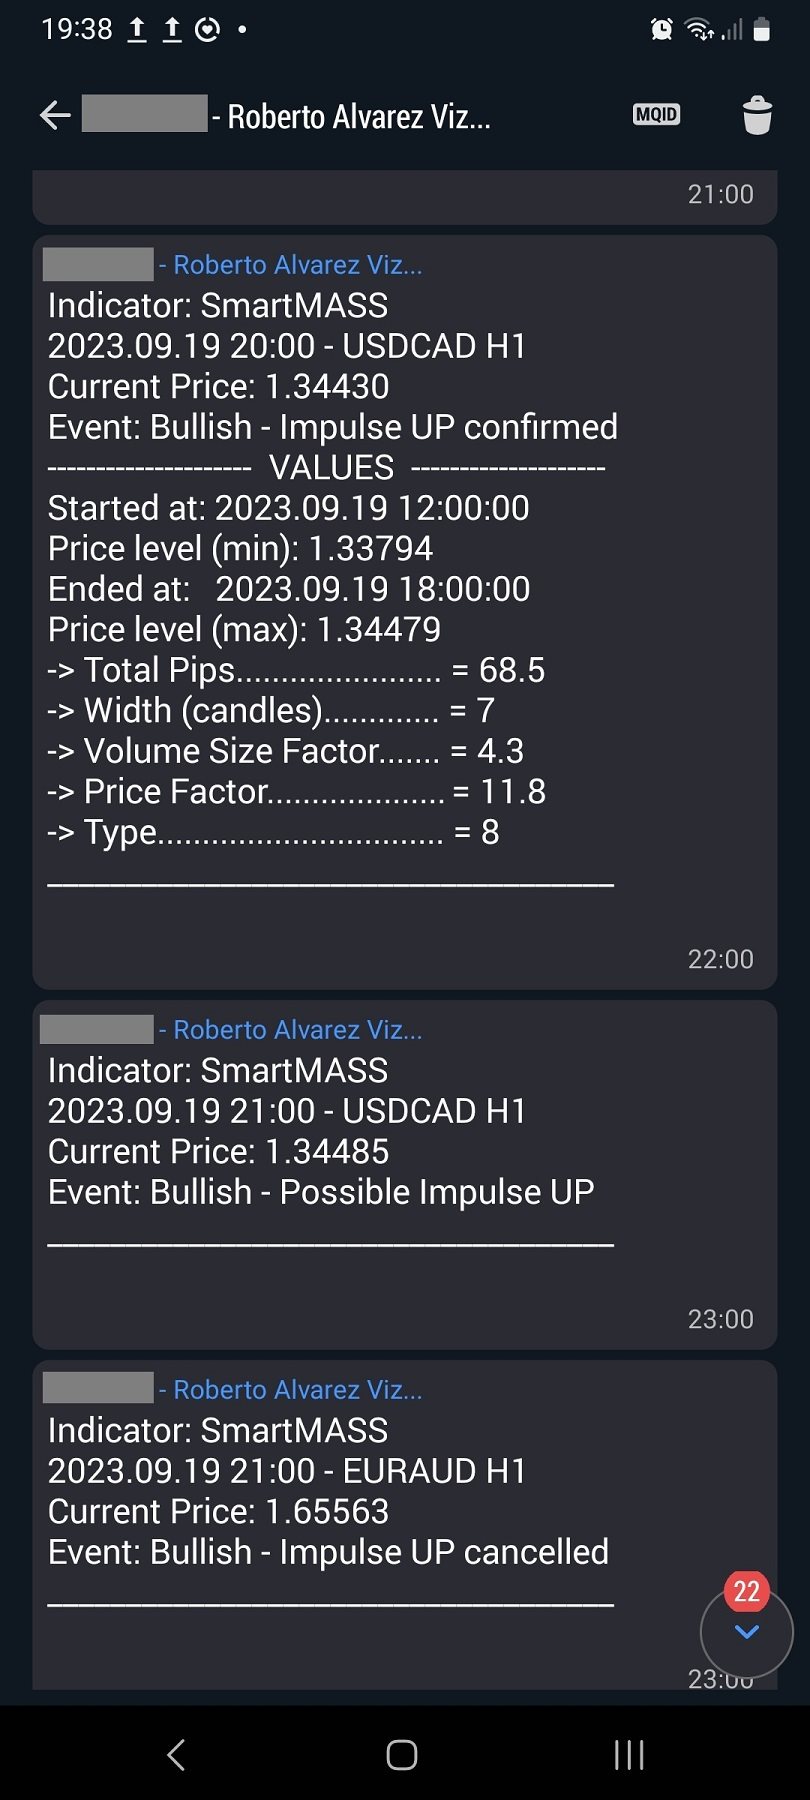
Um diese Klassifizierung und die verschiedenen Parameter, aus denen sich das Momentum zusammensetzt, zu sehen, bewegen Sie den Mauszeiger einfach über das Rechteck. Die Informationen werden durch ein schwebendes Etikett angezeigt.