MACD Divergences Scanner MT5
- Indikatoren
-
Reza Aghajanpour
 =============================================================================================
<<<<<< Our team after 19 years of experience in the markets and programming would like to share winner solutions with you. >>>>>> - Version: 1.10
- Aktualisiert: 24 Januar 2026
- Aktivierungen: 20
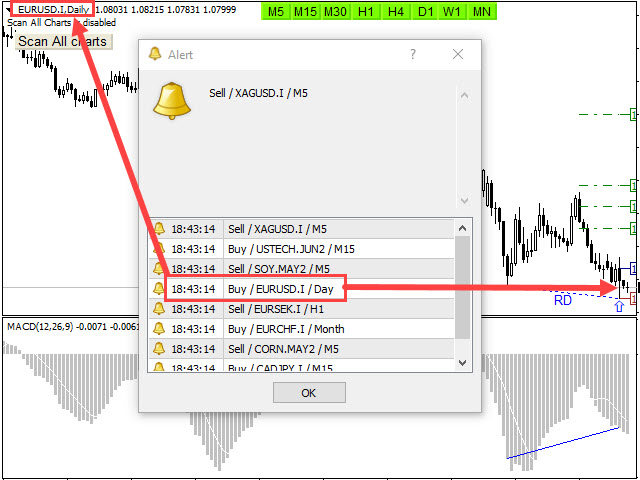
** Alle Symbole x Alle Zeitrahmen scannen nur durch Drücken der Scanner-Taste **
Einführung
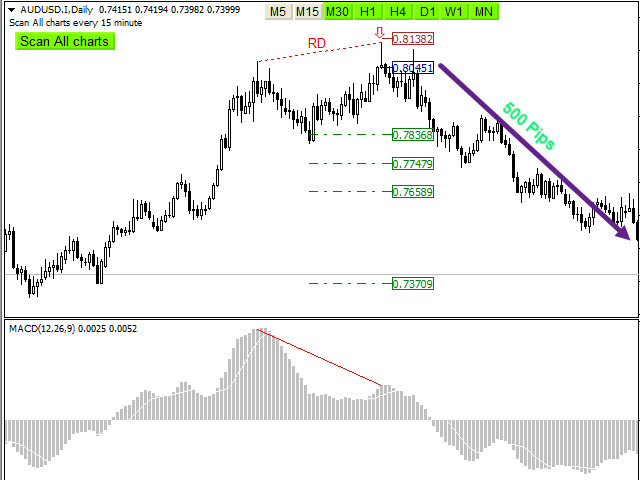
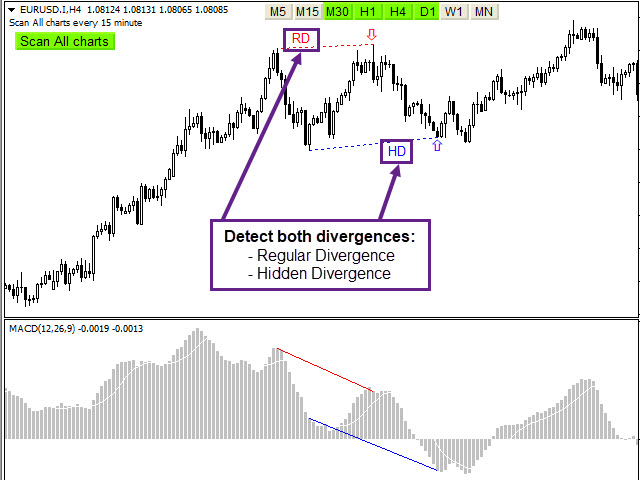
MACD-Divergenz ist eine wichtige Technik die verwendet wird, um die Trendumkehr zu bestimmen, wenn es Zeit ist, zu verkaufen oder zu kaufen, weil die Preise wahrscheinlich fallen oder in den Charts steigen werden. Der MACD-Divergenz-Indikator kann Ihnen helfen, den oberen und unteren Rand des Marktes zu lokalisieren. Dieser Indikator findet reguläre Divergenzen für einen Pullback des Marktes und findet auch versteckte MACD-Divergenzen, die einen anhaltenden Trend anzeigen.
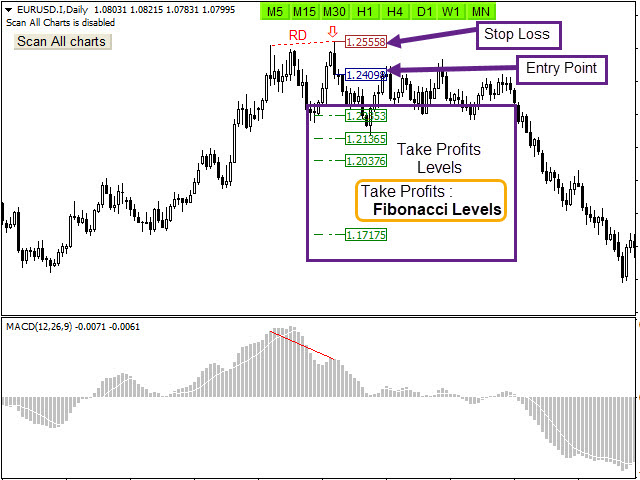
Dieser Indikator zeigt Divergenzen im MACD an, die ein starker Hinweis auf einen exzellenten Einstiegspunkt sind und sofort mit Alarm und Benachrichtigung gefunden werden. Er verfügt außerdem über Stop-Loss, Take-Profits und Einstiegspunkte mit Fibonacci-Levels und Candlestick-Kontrolle für einfaches Trading.
Wichtigste Merkmale
- Erkennen Sie den besten und erfolgreichsten Punkt eines Trends oder einer Trendumkehr
- Einfach zu bedienender und benutzerfreundlicher Indikator
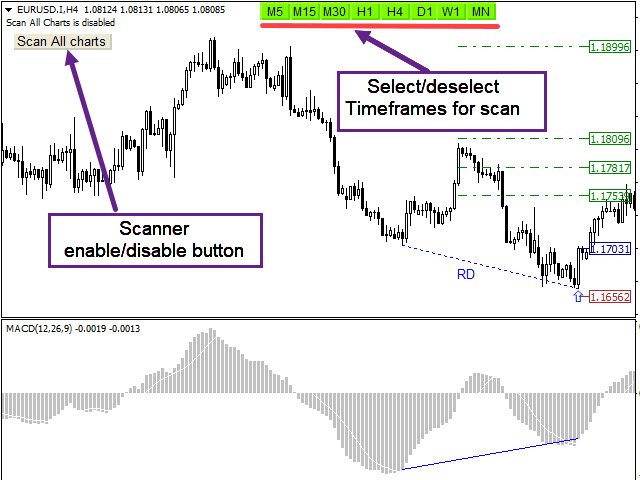
- Schaltfläche " Alle Charts scannen" (Forex, Krypto, Indizes und Rohstoffe )
- Auswahl und Abwahl der Zeitrahmen für den Scan (M5,M15,M30,H1,H4,D1,W1,MN)
- Es zeigt und schiebt Benachrichtigung Stop-Loss, Entry-Point und Take-Profit-Levels
- Candlestick-Check für den besten Einstiegspunkt
- Verwendung der Fibonacci-Levels
- Senden von Alarmen und Push-Benachrichtigungen
- Aktivieren/Deaktivieren des Alarms je nach der von Ihnen eingestellten Zeit
- Anpassung der Mustereinstellung
Wie man testet:
Hier finden Sie eine kostenloseTestversion für USDCHFundAUDCHF Realcharts .
Eingabe-Parameter
=========Scanner============
- Alle Charts scannen - Aktivieren
- Scan the number of candles - Anzahl der auszuwertenden Verlaufsbalken
- Re-scan Timer - Erneutes Scannen aller Charts in allen Zeitrahmen nach Ablauf der Zeit
=======Pattern Feature============
- MACD-Funktion (schnelle EMA-Periode, langsame EMA-Periode, Signal-SMA-Periode ) - MACD-Funktionen
- Pattern Feature(Period, Deviation, Back step, Wing length) - Algorithmus Parameter für die Mustererkennung
=======Display/style Options============
- Anzeigeoptionen - Take Profit- und Stop Loss-Niveaus anzeigen oder nicht
- Stop Loss/Take Profit Levels und Breakout Style - Einstellen der Schriftarten und Farben der Muster
========ALARMEINSTELLUNGEN ==========
- Alarm oder Push-Benachrichtigung anzeigen - Aktivieren oder deaktivieren Sie den Alarm oder die Push-Benachrichtigung
- How many candles are past a pattern - Maximale Anzahl von Kerzen, die von einem Muster vergangen sind, um einen Alarm zuzulassen
- Größe des Alarmspeichers - Maximale Anzahl der gespeicherten Alarme, um doppelte Alarme zu vermeiden
- Start-/Endzeit des Alarms - Bestimmen Sie die Handelszeiten basierend auf der Computeruhr, um den Alarm zu aktivieren und zu deaktivieren.

the seller replied