Gekko RSI Plus
- Indikatoren
- Version: 1.11
- Aktualisiert: 17 Februar 2023
- Aktivierungen: 5

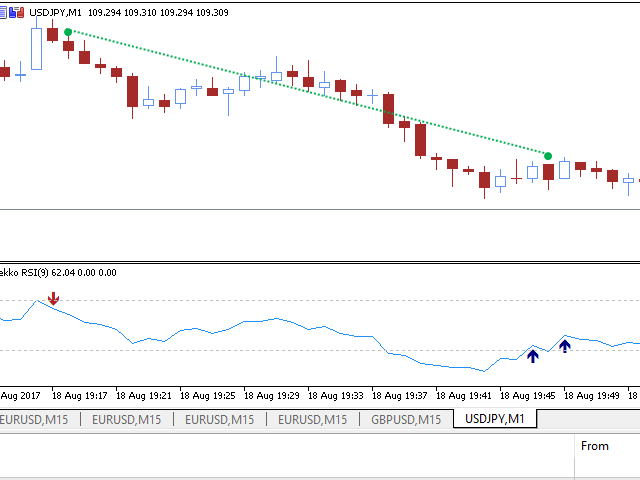
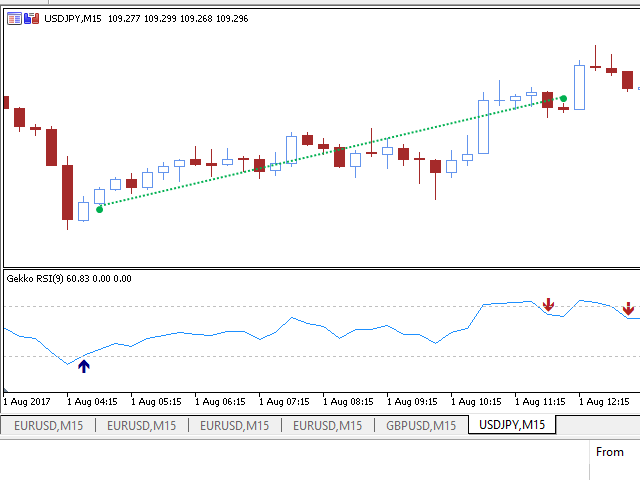
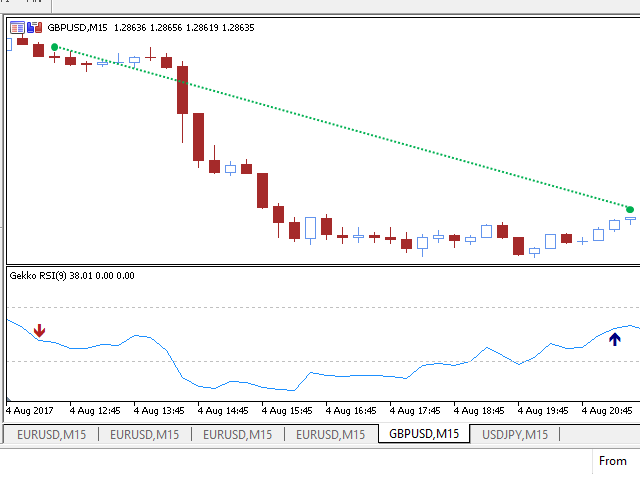
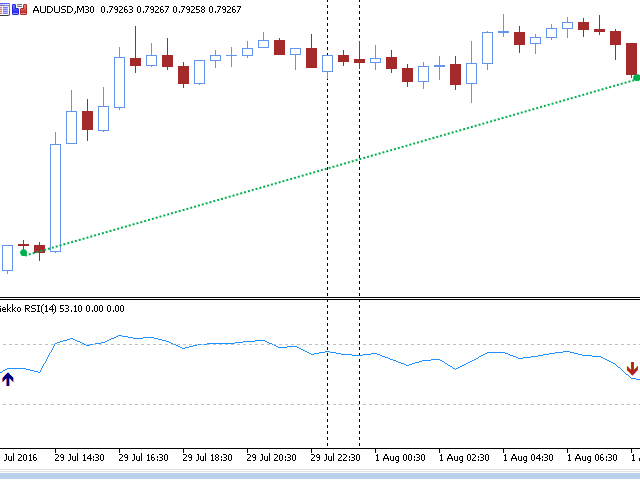
Dies ist der Gekko's Cutomized Relative Strength Index (RSI), eine angepasste Version des berühmten RSI-Indikators. Verwenden Sie den regulären RSI und nutzen Sie die Vorteile von zwei Einstiegssignalberechnungen und verschiedenen Möglichkeiten, alarmiert zu werden, wenn es einen potenziellen Einstiegs- oder Ausstiegspunkt gibt.
Eingaben
- Zeitraum: Periode für die RSI-Berechnung;
- Wie berechnet der Indikator Einstiegssignale (Swing):
- 1- Erzeugt Ausstiegssignale für Swings basierend auf dem Eintritt des RSI in und dem Verlassen der oberen und unteren Level-Zonen;
- 2- Erzeugt Einstiegs-/Ausstiegssignale für Swings, wenn der RSI die mittlere Linie (50) nach oben oder unten kreuzt;
- Spielt einen Ton ab, wenn es einen Swing gibt: Setzen Sie diese Option auf true und es wird jedes Mal ein Ton auf dem Metatrader-Terminal abgespielt, wenn es einen Swing im Trend gibt, der Einstiegs- oder Ausstiegspunkte anzeigt.
- Write Logs On Terminal Window: Setzen Sie diese Option auf true, wenn Sie möchten, dass der Indikator auf der Registerkarte Experts des Terminals Logs für Signalschwankungen schreibt;
- Mobile Push-Benachrichtigungen senden: Setzen Sie diese Option auf true, wenn Sie Push-Benachrichtigungen über die MetaTrader-App auf Ihrem Mobiltelefon für Signalschwankungen erhalten möchten;
- Send E-Mail Alerts: Setzen Sie diese Option auf true, wenn Sie E-Mail-Benachrichtigungen an die im Terminal konfigurierte E-Mail-Adresse für Signalschwankungen erhalten möchten;
Gute Trades!
Spenden Sie einen Teil Ihres Gewinns an gute Zwecke und humanitäre Einrichtungen Ihrer Wahl, "Geld kommt nur, wenn es einen Zweck hat, es zu verdienen".