ATR MT4 Indicator by PipTick
- Indikatoren
-
Michal Jurnik
 "Talent is cheaper than table salt. What separates the talented individual from the successful one is a lot of hard work." - Stephen King. Those few words reflect myself very well. I am probably not the most talented developer in the world but I truly believe in hard work, professional attitude and
 - Version: 1.4
- Aktualisiert: 3 Dezember 2021
- Aktivierungen: 5
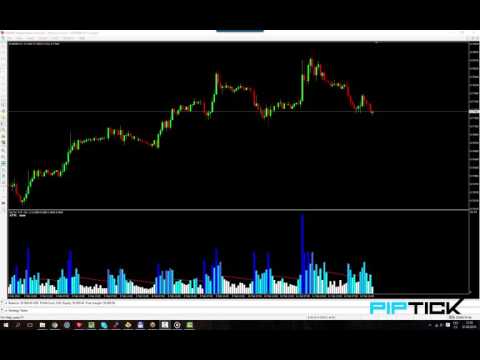
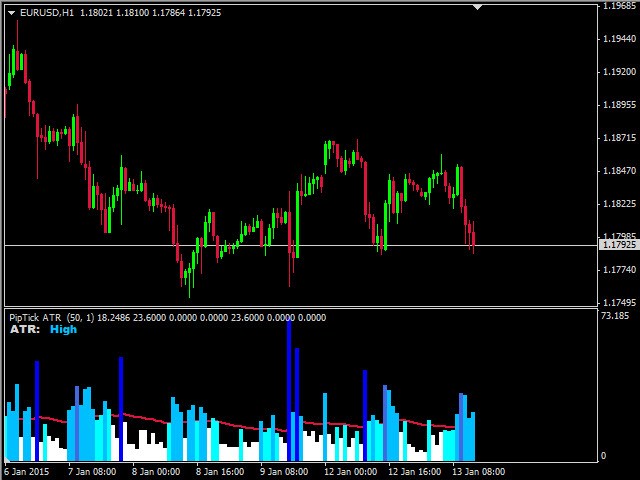
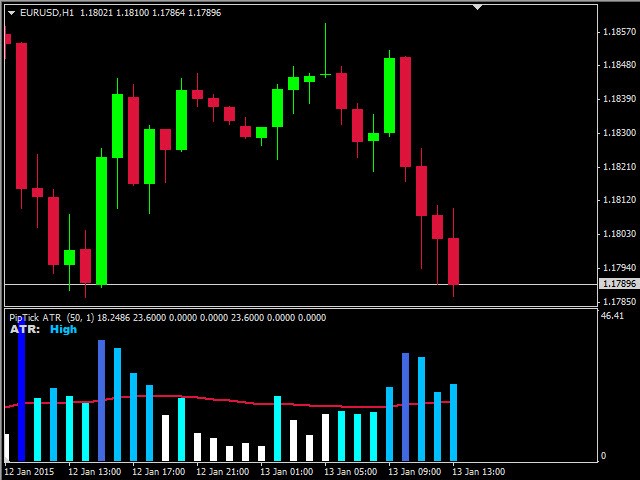
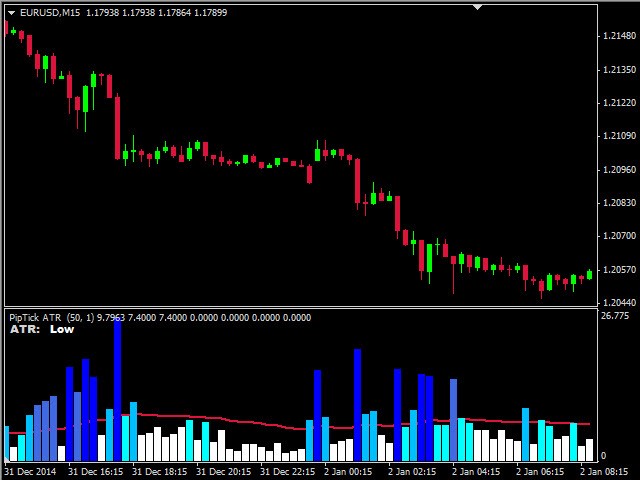
Der ATR-Indikator ist ein hilfreiches Instrument zur Messung der Spanne von Bars. Er hilft schnell und einfach, die aktuelle Spanne (Range) der ATR zu bewerten, was besonders für VSA-Händler nützlich ist. Der Indikator zur Klassifizierung der Spanne von Bars (Kerzen) verwendet den gleitenden Durchschnitt und seine Multiplikatoren. Dementsprechend wird der Bereich, in dem sich das Volumen (relativ zum gleitenden Durchschnitt) befindet, als ultraniedrig, niedrig, durchschnittlich, hoch, sehr hoch oder ultrahoch bezeichnet. Unser ATR-Indikator wird in Form eines Histogramms dargestellt.
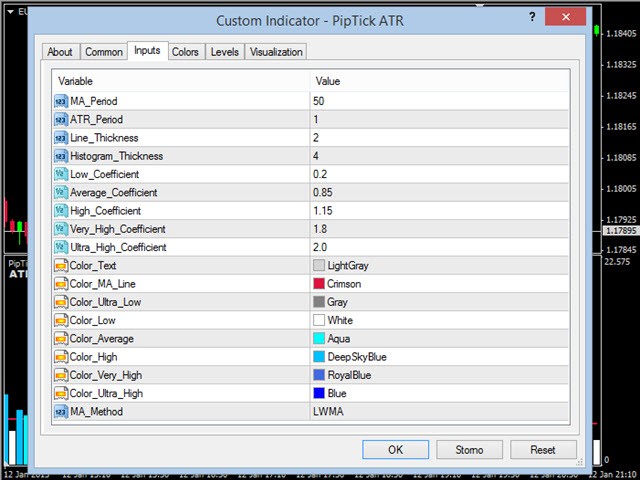
Dieser Indikator kann den gleitenden Durchschnitt nach vier Methoden berechnen:
- SMA - Einfacher gleitender Durchschnitt
- SMMA - Geglätteter gleitender Durchschnitt
- EMA - Exponentieller gleitender Durchschnitt
- LWMA - Linear gewichteter gleitender Durchschnitt
Auswertung
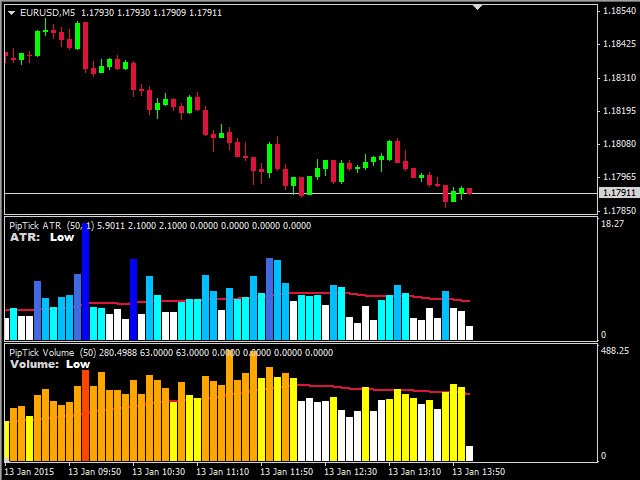
Standardmäßig gibt es sechs Zonen, die der Benutzer ändern kann. Je nachdem, welche Zone dem ATR entspricht, wird der Histogrammbalken in der entsprechenden Farbe eingefärbt. Auf diese Weise können Sie leicht erkennen, wie hoch die ATR (Spread/Range) im Vergleich zu den vorherigen Balken ist.
- Sehr niedrige ATR-Zone - grau
- Niedrige ATR-Zone - weiß
- Mittlere ATR-Zone - aqua
- Hohe ATR-Zone - tiefes Himmelblau
- Sehr hohe ATR-Zone - königsblau
- Ultrahohe ATR-Zone - blau
Wichtigste Merkmale
- Eine einfache Klassifizierung einer Reihe von Balken
- Mehrere optionale Berechnungsmethoden
- Vom Benutzer wählbare Bereiche der Zonen
- Funktioniert auf jedem Zeitrahmen (M1, M5, M15, M30, H1, H4, D1, W1, und MN)
- Ein sehr schneller und zuverlässiger Indikator
- Anpassbare Parameter (Farben, Liniendicke, MA-Periode, etc.)


Der Benutzer hat keinen Kommentar hinterlassen