OHLC Indicator by PipTick MT4
- Indikatoren
-
Michal Jurnik
 "Talent is cheaper than table salt. What separates the talented individual from the successful one is a lot of hard work." - Stephen King. Those few words reflect myself very well. I am probably not the most talented developer in the world but I truly believe in hard work, professional attitude and
 - Version: 1.3
- Aktualisiert: 1 Dezember 2021
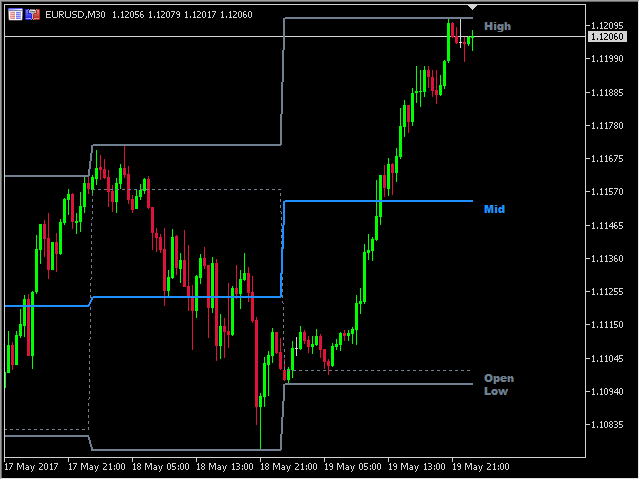
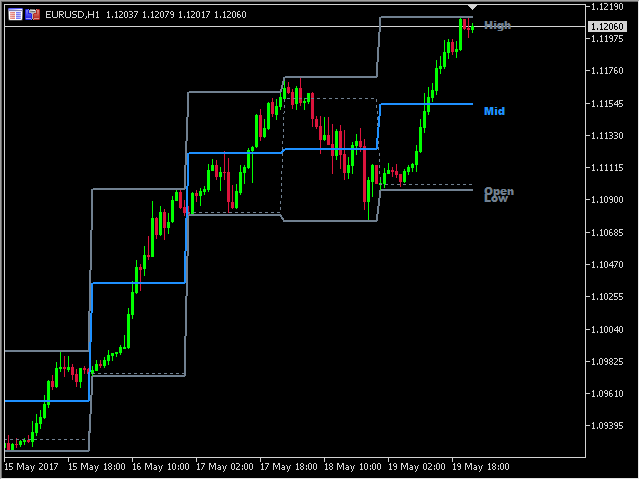
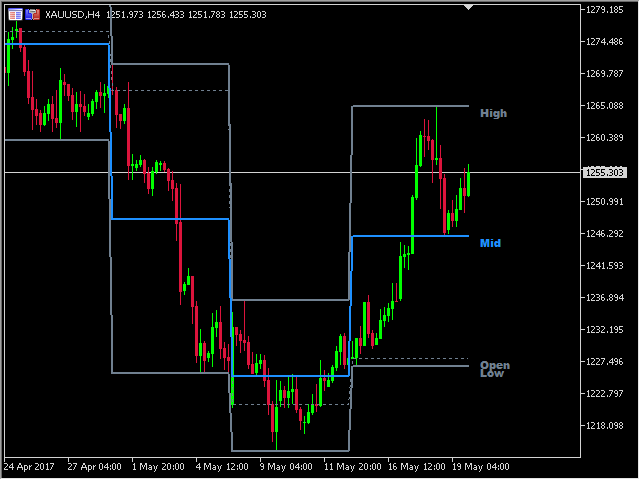
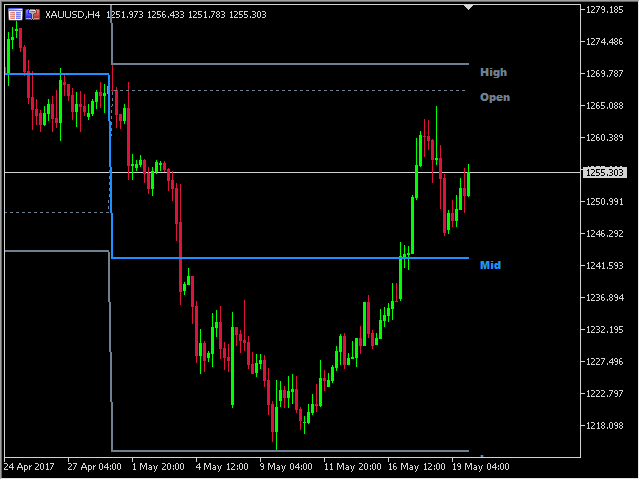
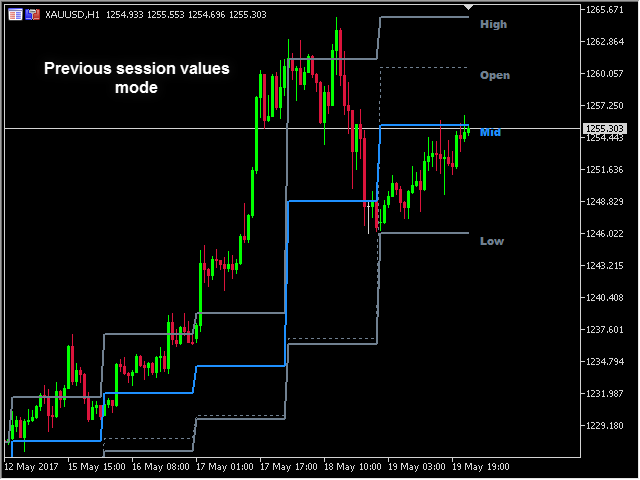
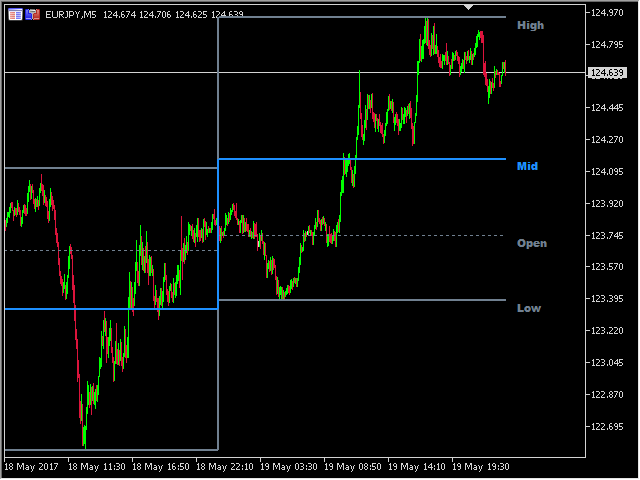
DerOHLC-Indikator zeigt die aktuellen und historischen Werte von High, Low, Open, Close und Mid für einen bestimmten Zeitraum an. Er kann die aktuellen Werte oder die Werte der vorherigen Sitzung darstellen. Der Bereich des Indikators kann aus einer täglichen, wöchentlichen, monatlichen oder benutzerdefinierten Sitzung berechnet werden.
Levels
- Höchststand der aktuellen oder vorherigen Sitzung.
- Tiefststand der aktuellen oder vorherigen Sitzung.
- Eröffnung der aktuellen oder vorherigen Sitzung.
- Schlusskurs der aktuellen oder vorherigen Sitzung.
- Midpoint der aktuellen oder vorherigen Session.
Empfehlungen
- Die Verwendung der Werte von High, Low, Close und Mid der vorangegangenen Sitzung ist für Unterstützungs- und Widerstandsniveaus von Vorteil. Das funktioniert in der Regel sehr gut.
Wichtigste Merkmale
- Der Indikator zeigt die aktuellen Werte von High, Low, Open, Close und Mid an.
- Aktuelle oder vorherige Sitzungswerte.
- Alarmbenachrichtigungen für Indikatorlinien.
- Benutzerdefinierte Sitzungszeit.
- Funktioniert auf jedem Zeitrahmen (M1, M5, M15, M30, H1, H4, D1, W1, MN).
- Der Indikator zeichnet sich nicht neu auf.
- Bereit für Backtesting.
- Anpassbare Parameter (Farben, Liniendicke, Sichtbarkeit...).
- Hochgeschwindigkeitsberechnung.
- Verfügbar für MT4 und MT5.
Bitte besuchen Sie die OHLC-Indikator-Produktseite für die Einstellungen der Eingabe- und Ausgabeparameter.


Really good auto adjusting OHLC indicator, showing traders whether the markets are working the high or low of the previous day. Recommended as very helpful.