Volume Weighted ATR MT4 Indicator by PipTick
- Indikatoren
-
Michal Jurnik
 "Talent is cheaper than table salt. What separates the talented individual from the successful one is a lot of hard work." - Stephen King. Those few words reflect myself very well. I am probably not the most talented developer in the world but I truly believe in hard work, professional attitude and
 - Version: 1.3
- Aktualisiert: 3 Dezember 2021
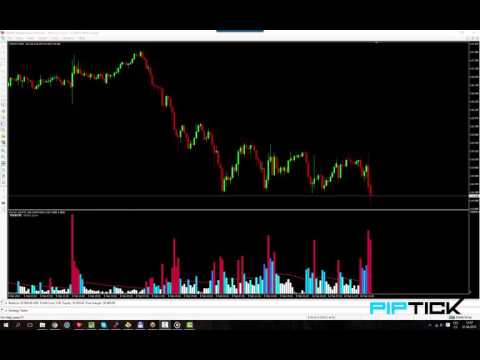
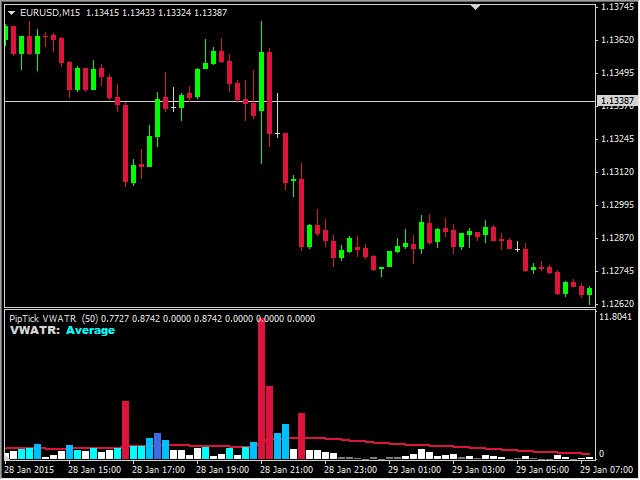
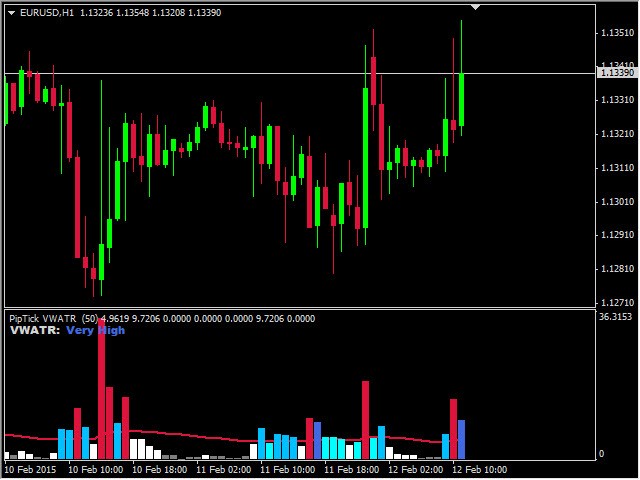
Dervolumengewichtete ATR-Indikator ist ein hilfreiches Instrument zur Messung der Marktaktivität. Er basiert auf der Idee der volumengewichteten ATR. Die Kombination dieser beiden Elemente hilft dabei, potenzielle Wendepunkte oder Ausbruchschancen zu erkennen. Der Indikator zur Klassifizierung der Marktaktivität verwendet den gleitenden Durchschnitt und seine Multiplikatoren. Dementsprechend wird der VWATR-Balken dort, wo er sich befindet (relativ zum gleitenden Durchschnitt), als ultratief, niedrig, durchschnittlich, hoch, sehr hoch oder ultrahoch gekennzeichnet. Der volumengewichtete ATR-Indikator wird in Form eines Histogramms dargestellt.
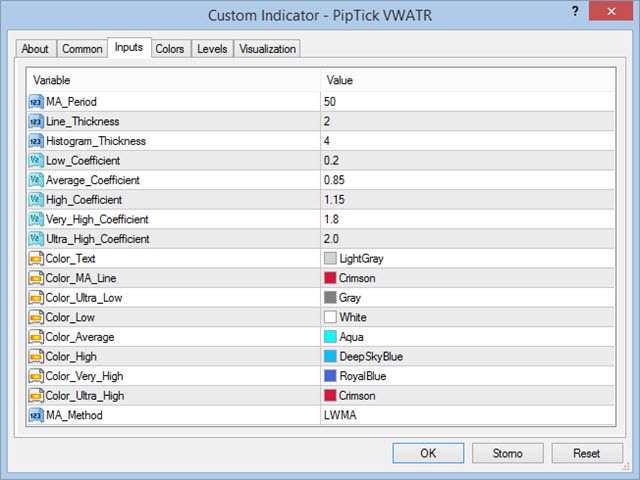
Dieser Indikator kann den gleitenden Durchschnitt nach vier Methoden berechnen:
- SMA - Einfacher gleitender Durchschnitt.
- SMMA - Geglätteter gleitender Durchschnitt.
- EMA - Exponentieller gleitender Durchschnitt.
- LWMA - Linear gewichteter gleitender Durchschnitt.
Auswertung
Standardmäßig gibt es sechs Zonen, die vom Benutzer geändert werden können. Je nachdem, welche Zone dem volumengewichteten ATR-Indikator entspricht, wird der Histogrammbalken in der entsprechenden Farbe eingefärbt.
- Ultra VWATR-Zone - Karminrot.
- Niedrige VWATR-Zone - Weiß.
- Durchschnittliche VWATR-Zone - Aqua.
- Hohe VWATR-Zone - DeepSkyBlue.
- Sehr hohe VWATR-Zone - Königsblau.
- Ultrahohe VWATR-Zone - Blau.
Wichtigste Merkmale
- Eine einfache Klassifizierung der Aktivität der Märkte.
- Mehrere optionale Berechnungsmethoden.
- Reale und Tick-Volumen-Berechnung.
- Vom Benutzer wählbare Bereiche der Zonen.
- Funktioniert auf jedem Zeitrahmen (M1, M5, M15, M30, H1, H4, D1, W1, MN).
- Ein sehr schneller und zuverlässiger Indikator.
- Anpassbare Parameter (Farben, Liniendicke, MA-Periode...).
- Er kann für die Erstellung von EA (Expert Advisor) verwendet werden.
- Verfügbar für MT4 und MT5.


great stuff