Retracement MT4 Indicator by PipTick
- Indikatoren
-
Michal Jurnik
 "Talent is cheaper than table salt. What separates the talented individual from the successful one is a lot of hard work." - Stephen King. Those few words reflect myself very well. I am probably not the most talented developer in the world but I truly believe in hard work, professional attitude and
 - Version: 1.0
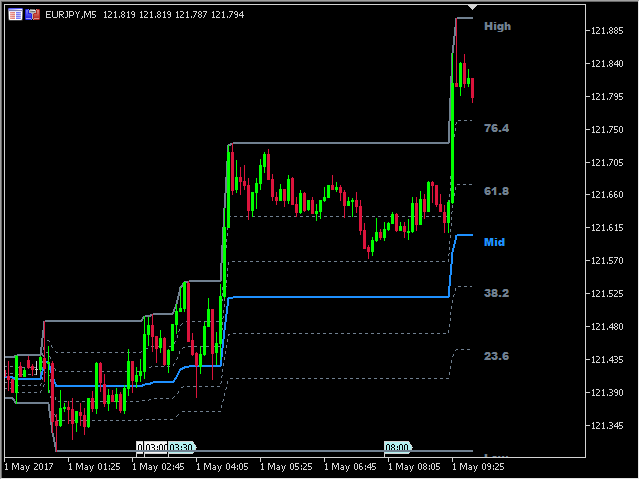
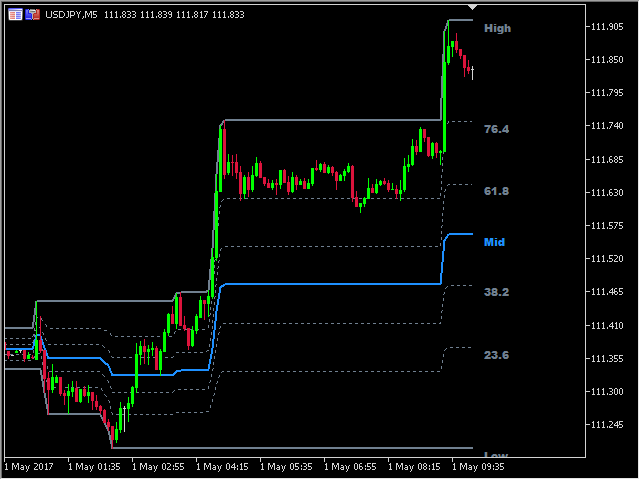
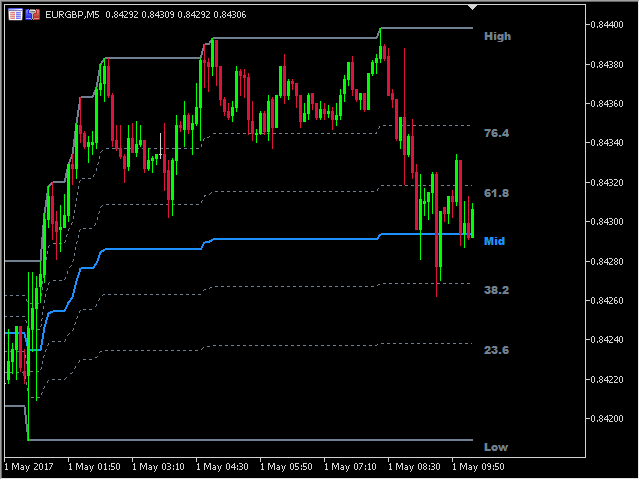
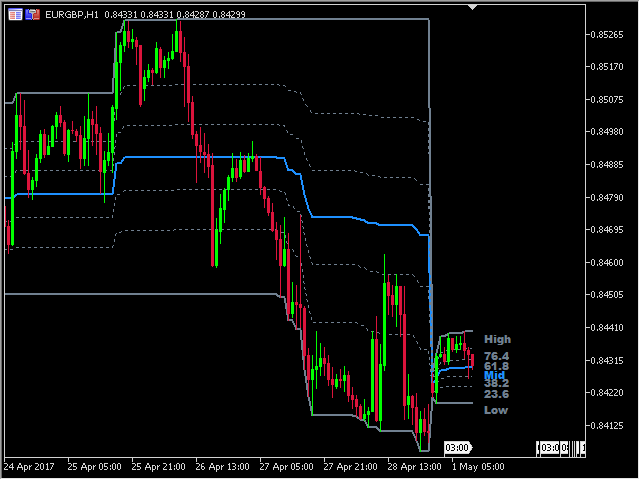
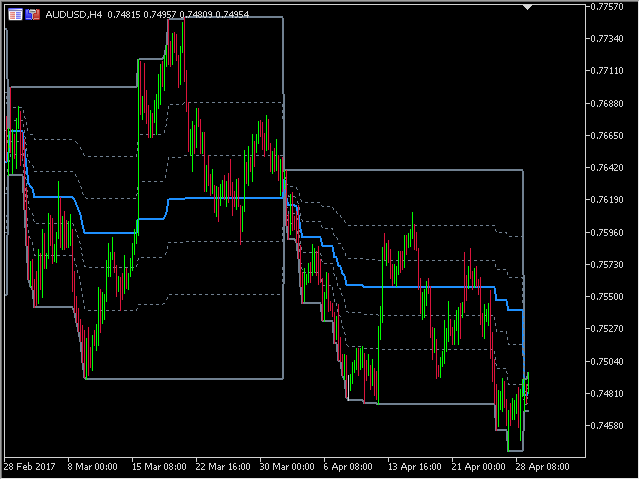
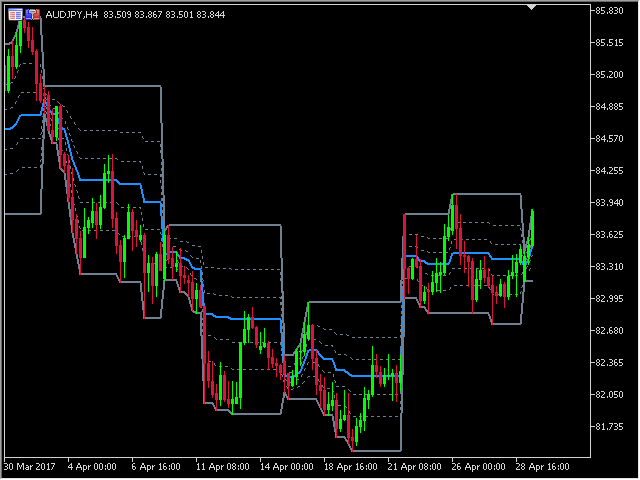
DerRetracement-Indikator zeigt die aktuellen und historischen Hoch-, Tief- und Mittelwerte an. Optional kann er auch die wichtigsten Retracement-Niveaus anzeigen. Alle diese Niveaus bilden zusammen die wichtigen Unterstützungs- und Widerstandsniveaus. Daher ist es für jede Art von Händler unerlässlich, sie zu kennen.
Niveaus
- Hoch
- Niedrig
- Mittelwert
- 76,4 %
- 61,8 %
- 38,2 %
- 23,6 %
Wichtigste Merkmale
- Der Indikator zeigt die aktuellen Niveaus von High, Low, Mid und ausgewählten Retracements an.
- Vier optionale Retracement-Levels.
- Alarmbenachrichtigungen für Indikatorlinien.
- Benutzerdefinierte Sitzungszeit.
- Funktioniert auf jedem Zeitrahmen (M1, M5, M15, M30, H1, H4, D1, W1, MN).
- Der Indikator zeichnet sich nicht neu auf.
- Bereit für Backtesting.
- Anpassbare Parameter (Farben, Liniendicke, Sichtbarkeit...).
- Hochgeschwindigkeitsberechnung.
- Verfügbar für MT4 und MT5.
Bitte besuchen Sie die Retracement-Indikator-Produktseite für die Einstellungen der Eingabe- und Ausgabeparameter.