ProfileVolumesMarket
- Indikatoren
- Version: 4.2
- Aktualisiert: 29 November 2021
- Aktivierungen: 5

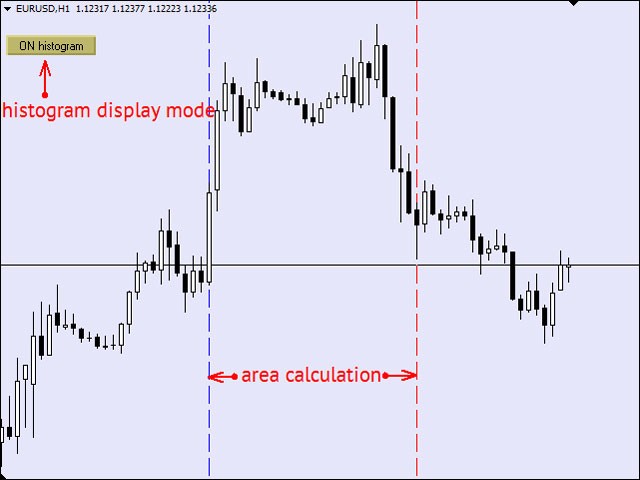
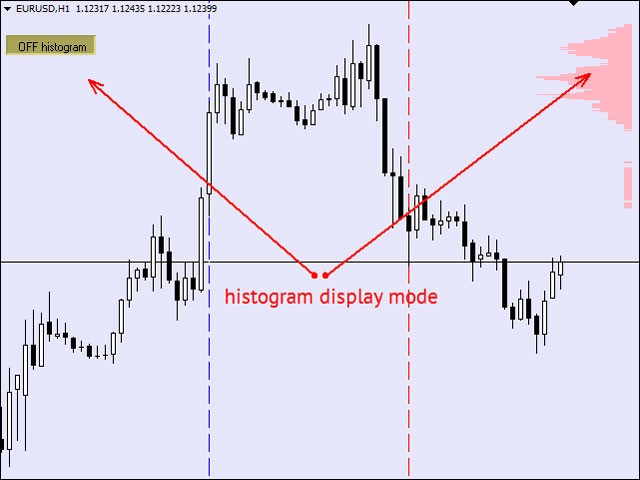
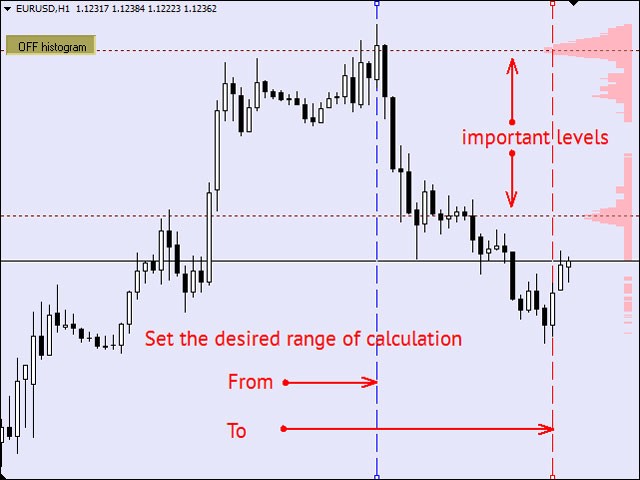
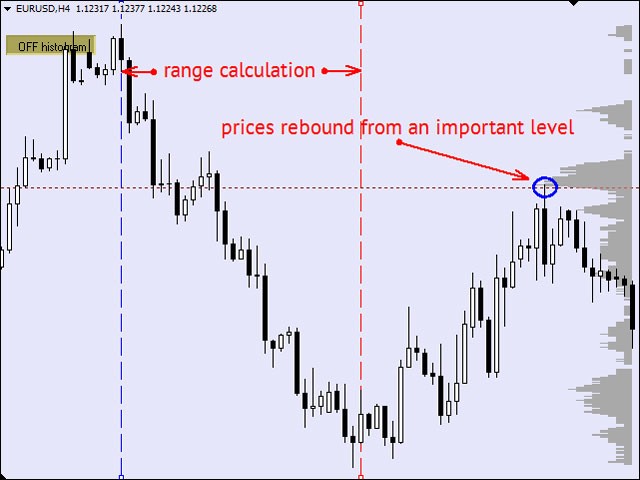
Der ProfileVolumesMarket-Indikator berechnet das Tick-Volumen für jedes Preisniveau in einem ausgewählten Bereich. Das Volumen ist entscheidend für die Bestimmung der Stärke und damit der Bedeutung der Kursniveaus. Der Berechnungsbereich wird vom Händler durch das Verschieben zweier vertikaler Linien festgelegt. Auf diese Weise ermöglicht der Indikator, wichtige Niveaus auf verschiedenen Stufen der Preisbildung eines Symbols zu verfolgen. Ein Histogramm des Volumenprofils kann auf dem Chart angezeigt (oder aus dem Chart entfernt) werden, wenn Sie auf die Schaltfläche "EIN" ("AUS") drücken. Wenn Sie die Chart-Periode ändern, ändert sich auch der Berechnungsbereich des Indikators, was ideal ist, wenn Sie die Genauigkeit der Levels auf niedrigeren Zeitrahmen einschätzen wollen. Die Schaltfläche "||" begrenzt die Indikatorberechnung auf den sichtbaren Bereich des aktuellen Charts. Die Farbe des Histogramms wird durch die Position des aktuellen Kurses im Verhältnis zum Höchststand bestimmt. Mit den Parametern "Shift" und "Ratio" kann das Histogramm individuell angepasst werden. Es gibt zwei Modi der Indikatorberechnung. Im Modus ModeTimer basiert die Berechnung des Indikators auf dem vom internen Systemtimer generierten Signal, was die Arbeit mit dem Indikator auch dann ermöglicht, wenn der Markt geschlossen ist. Im Modus ModeTick wird der Indikator jede Minute neu berechnet, was es ermöglicht, die aktuellen Veränderungen des Volumens zu verfolgen und die Funktionsweise des Indikators im Testmodus zu überprüfen. Der Indikator sucht automatisch nach "Löchern" in der Kursentwicklung und wählt den kleinsten Zeitrahmen mit der vollständigen Historie als Basis aus, während die entsprechenden Informationen im Kommentar angezeigt werden.
Eingaben des Indikators
- Set_Mode - Wählen Sie den Berechnungsmodus des Indikators.
- ColorLevelNon - Farbe des Histogramms, wenn der aktuelle Preis gleich dem Niveau des maximalen Volumens ist.
- ColorLevelBull - Farbe des Histogramms, wenn der aktuelle Preis über dem Niveau des maximalen Volumens liegt.
- ColorLevelBear - Farbe des Histogramms, wenn der aktuelle Preis unterhalb des Niveaus des maximalen Volumens liegt.
- ColorLineFrom - Farbe der vertikalen Linie, mit der der Berechnungsbereich des Indikators beginnt;
- ColorLineTo - Farbe der vertikalen Linie am Ende des Berechnungsbereichs des Indikators;
- coeff - Koeffizient der Histogramm-Anzeigeeinstellung.
- ShiftBars - die Anzahl der Balken, um die das Histogramm nach links verschoben wird.
- ShowComment - zeigt den Kommentar an, wenn es "Löcher" in der Kurshistorie des kleinsten Zeitrahmens gibt.


Effective and responsive as the market changes. Recommended