Crossing Signals MT4
- Indikatoren
- Version: 4.82
- Aktualisiert: 23 März 2020
- Aktivierungen: 5

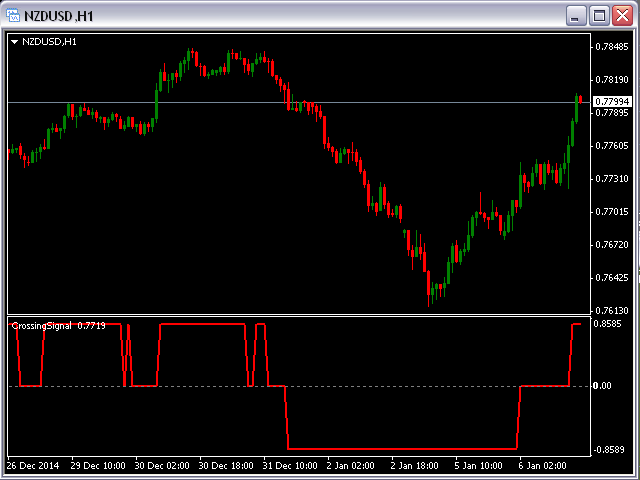
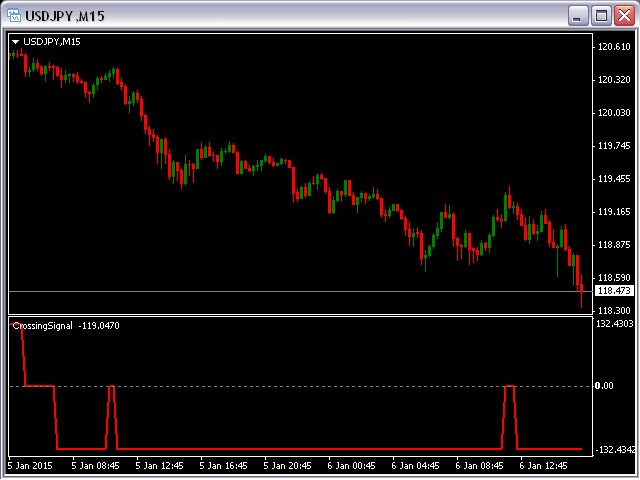
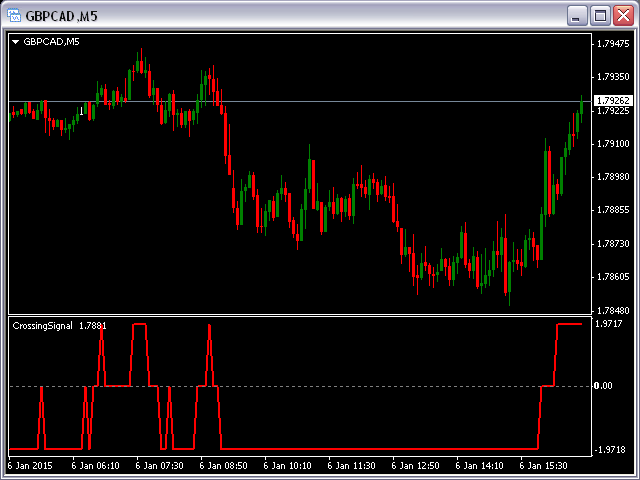
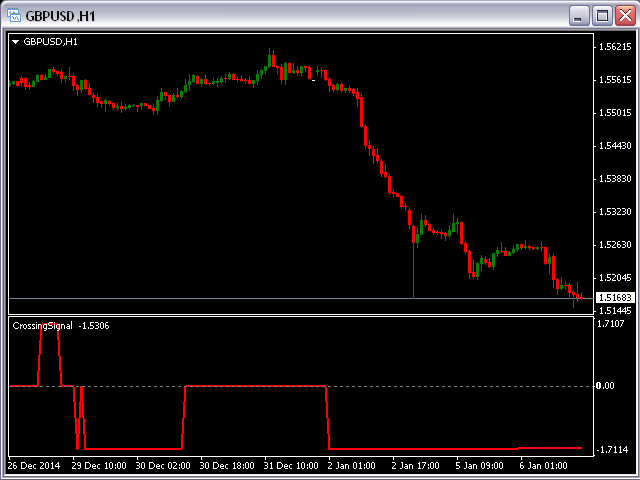
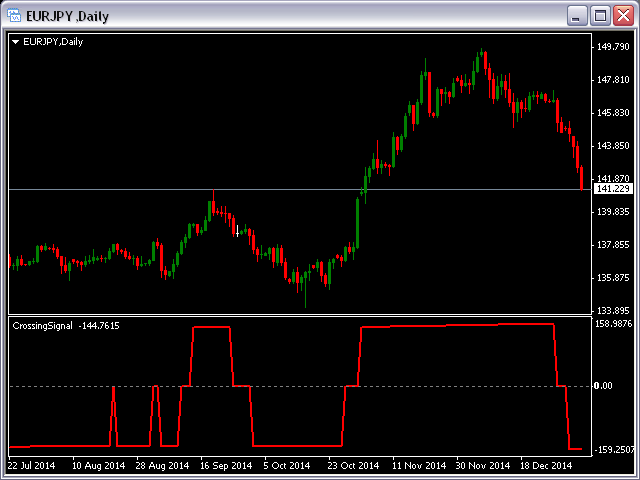
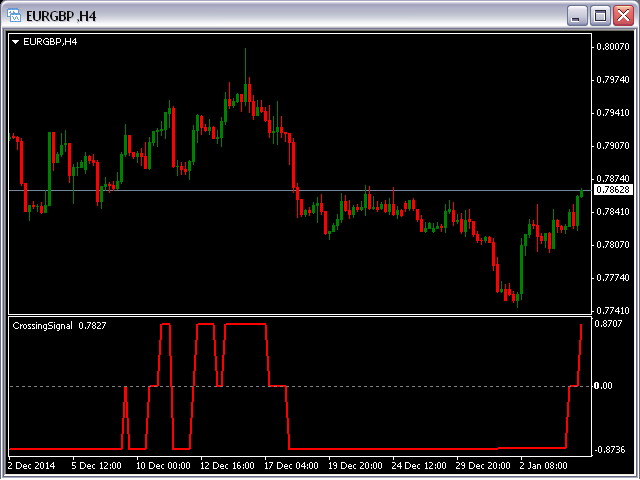
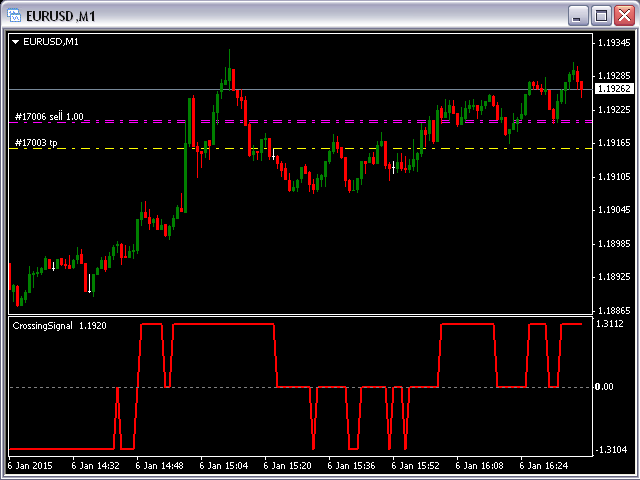
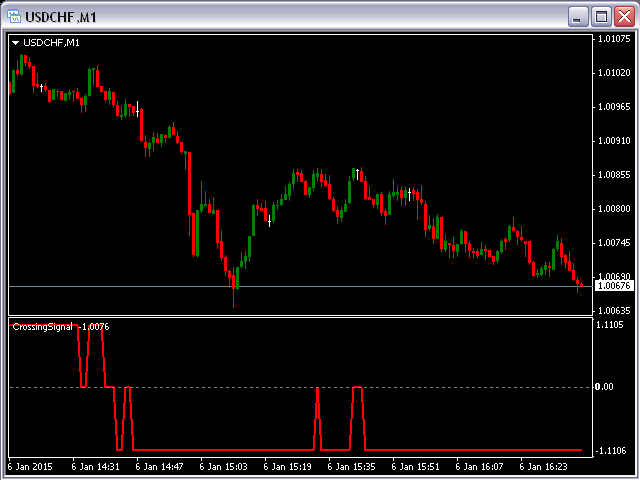
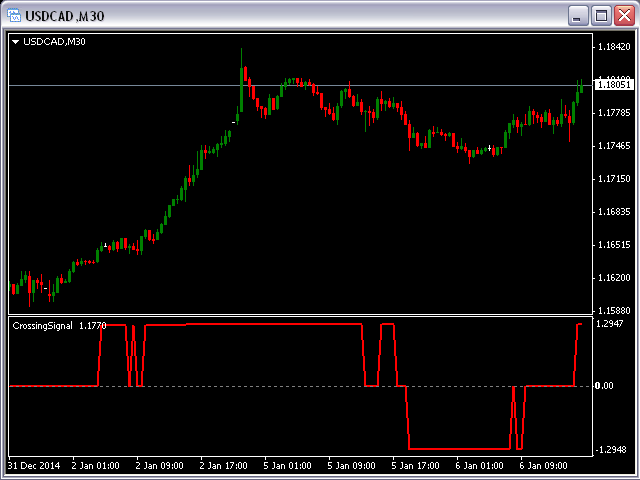
Dieser Indikator zeigt die Seitwärtsbewegung des Preises an, wenn die Indikatorlinie der Nulllinie entspricht, und den Aufwärts-/Abwärtstrend, wenn die Indikatorlinie höher/niedriger als die Nulllinie und parallel zu dieser verläuft. Natürlich ist der Moment, in dem die Indikatorlinie die Nulllinie kreuzt, der beste Moment, um in den Markt einzusteigen.
Dieser Indikator hat keine Eingabeparameter... Die Ergebnisse werden also für jeden Zeitrahmen und jedes Währungspaar immer gleich sein.