Crossing Signals MT4
- Indicadores
- Versión: 4.82
- Actualizado: 23 marzo 2020
- Activaciones: 5

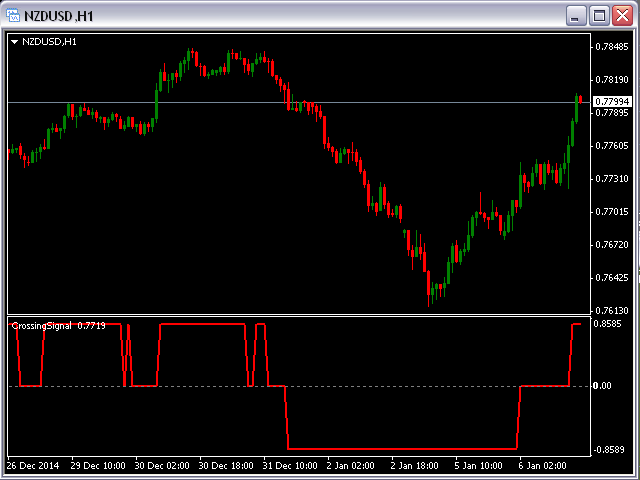
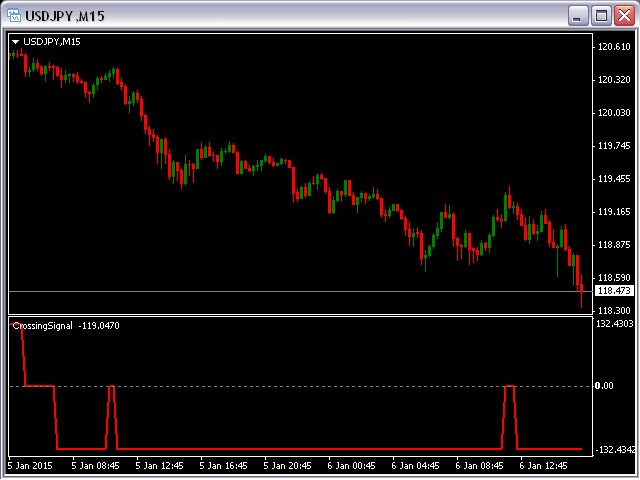
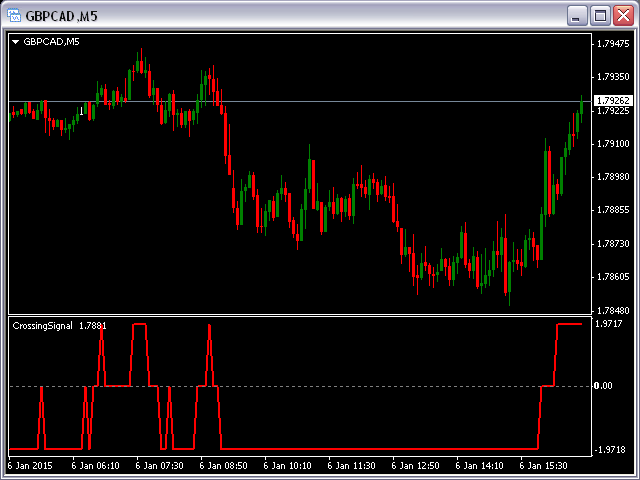
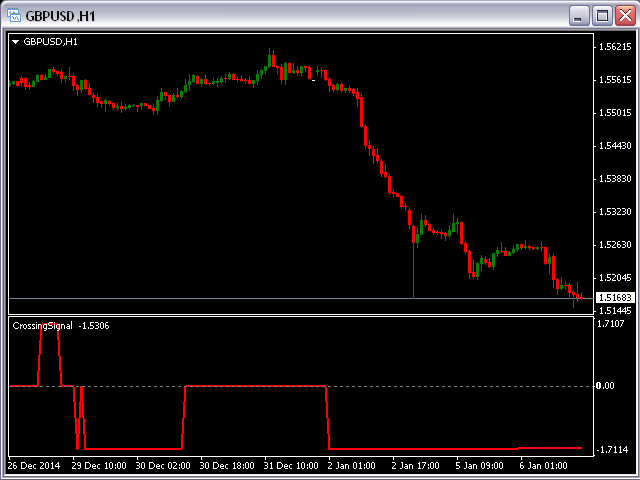
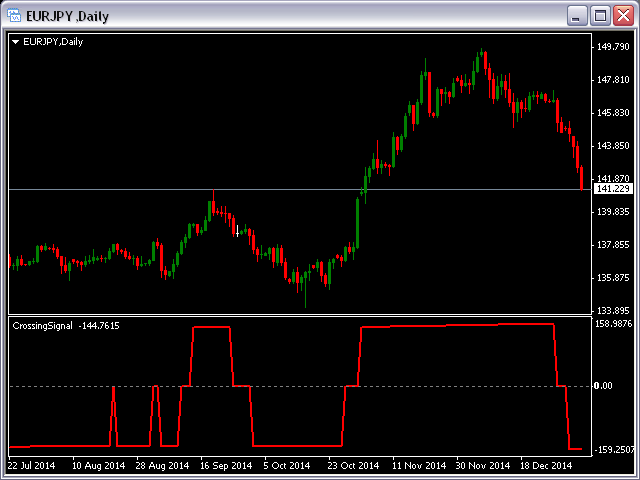
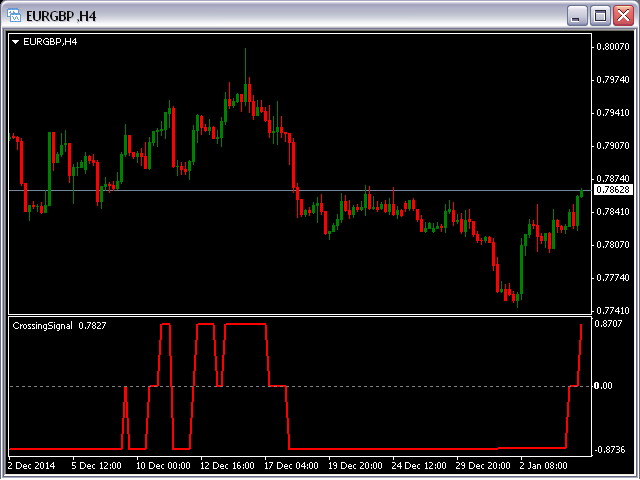
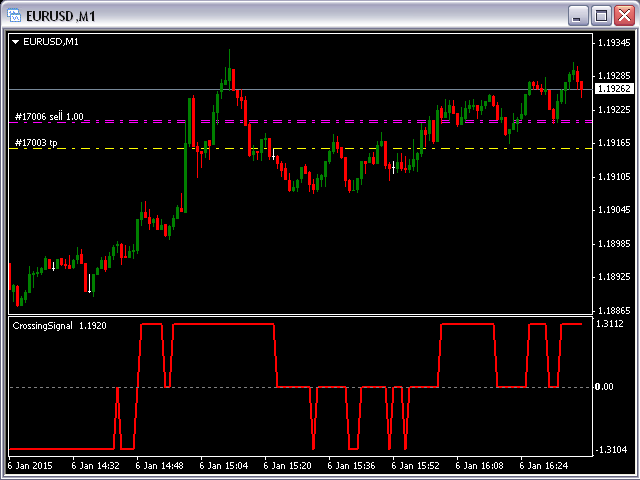
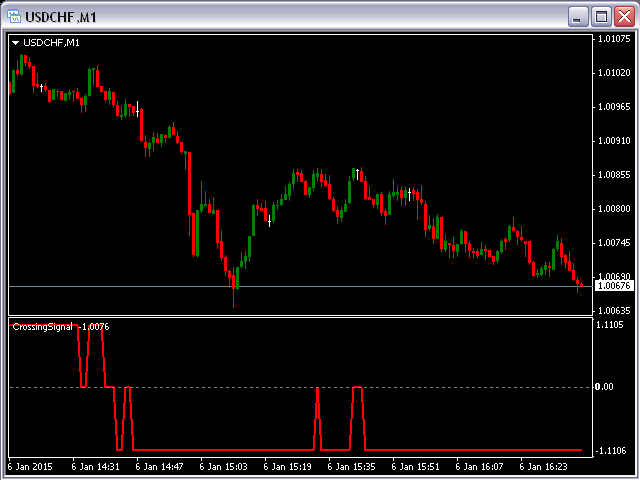
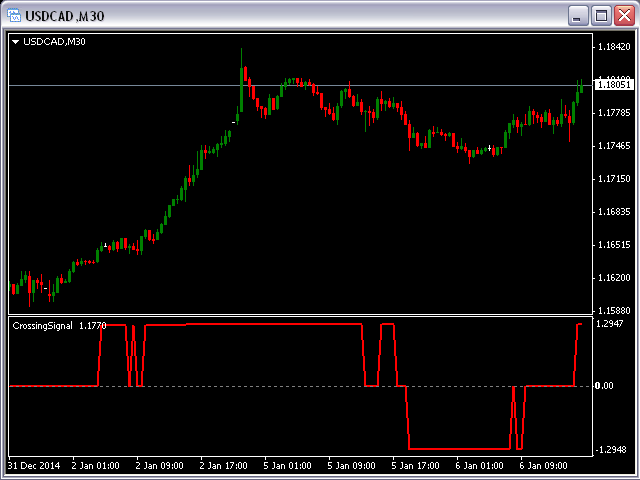
Este indicador muestra el movimiento lateral del precio cuando la línea del indicador corresponde a cero y la tendencia alcista/bajista cuando la línea del indicador es superior/inferior y paralela a la línea cero. Por supuesto, el momento en que la línea del indicador cruza la línea cero es el mejor momento para entrar en el mercado.
Este indicador no tiene parámetros de entrada... Por lo tanto, los resultados serán siempre los mismos para cada marco de tiempo y pares de divisas.