Tick by Tick 5
- Indikatoren
- Version: 4.9
- Aktualisiert: 20 November 2021
- Aktivierungen: 5

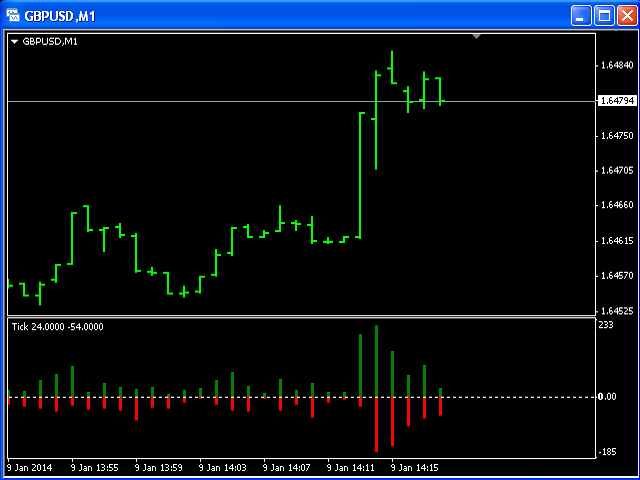
Dieser Indikator ist für den M1-Zeitrahmen konzipiert und zeigt an:
- Die Summe der Punkte, wenn der Preis steigt (grünes Histogramm).
- Die Summe der Punkte, wenn der Preis fällt (rotes Histogramm).
Mit anderen Worten: Anhand der Anzahl und des Verhältnisses der bullischen zu den bearischen Punkten können Sie eine technische Analyse der Marktlage vornehmen.
Wenn das grüne Histogramm das rote überwiegt, kann man daraus schließen, dass im Moment die Käufer stärker sind als die Verkäufer, und umgekehrt, wenn das rote Histogramm das grüne überwiegt, sind die Verkäufer stärker als die Käufer.