MACD Divergence
- Indikatoren
-
Sergey Deev
 I'm implementing your ideas in MQL4: https://www.mql5.com/ru/job/new?prefered=work2it
 - Version: 1.6
- Aktualisiert: 24 August 2019
- Aktivierungen: 15
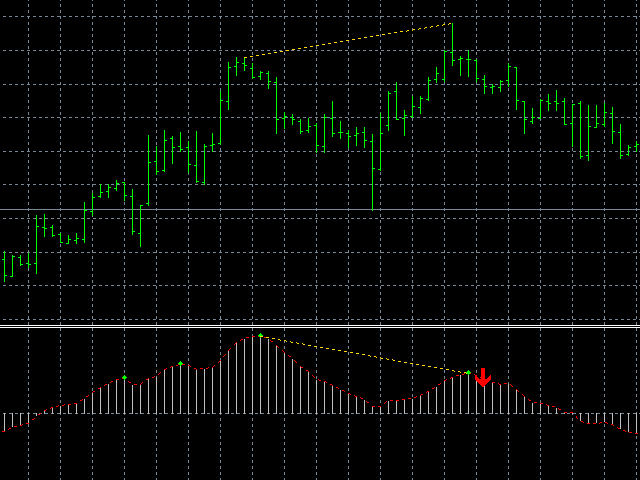
Der Indikator erkennt Divergenzsignale - die Abweichungen zwischen den Kursspitzen und den Werten des MACD-Oszillators. Die Signale werden als Pfeile im Zusatzfenster angezeigt und durch Meldungen in einem Pop-up-Fenster, E-Mails und Push-Benachrichtigungen aufrechterhalten. Die Bedingungen, die das Signal gebildet haben, werden durch Linien auf dem Chart und im Indikatorfenster angezeigt.
Parameter des Indikators
- MacdFast - schnelle MACD-Linienperiode
- MacdSlow - langsamer MACD-Linienverlauf
- MacdSignal - Zeitraum der MACD-Signallinie
- MacdPrice - Preis des MACD-Indikators
- PeakPoints - Anzahl der Balken für die MACD-Peak-Erkennung
- PeakDistance - der Mindestabstand zwischen den MACD-Spitzenwerten
- lineColor - Linienfarbe zur Anzeige der Bedingungen auf dem Chart
- deltaPraice - minimale Divergenz der Kursspitzen in Punkten
- deltaOscillator - minimale Divergenz der Oszillatorspitzen in Punkten
- UseAlert - Pop-up-Fenster aktivieren
- UseNotification - PUSH-Nachricht aktivieren
- UseMail - E-Mail aktivieren
- PlaySound - Dateiname zum Abspielen
Beispiel für EA:
void OnTick() {
 double x;
 x = iCustom(Symbol(),PERIOD_CURRENT,"MACD-DV",5,1); if (x != 0 && x != EMPTY_VALUE) goBuy();
 x = iCustom(Symbol(),PERIOD_CURRENT,"MACD-DV",4,1); if (x != 0 && x != EMPTY_VALUE) goSell();
}

void goBuy() { // function for open BUY
}

void goSell() { // function for open SELL
}


I thought it delivered exactly what I expected. It showed most regular divergence. Of course you can't trade that alone you will get too many false signals. I was very pleased with what I got for the price. For people who like to look for divergences this helps save some time with the alerts. Would like to see a good indicator that focuses more on hidden divergence. All in all good job.