TrueVolumeSurrogate
- Indikatoren
-
Stanislav Korotky
 Trading is just my hobby. I'm working in IT industry. So developement of experts, indicators, and script is not a problem at all to me. Wide range of technologies are used: MQL4, MQL5, system and applied programming, web-services, neural networks and more.
New: - Version: 1.4
- Aktualisiert: 18 November 2021
- Aktivierungen: 7
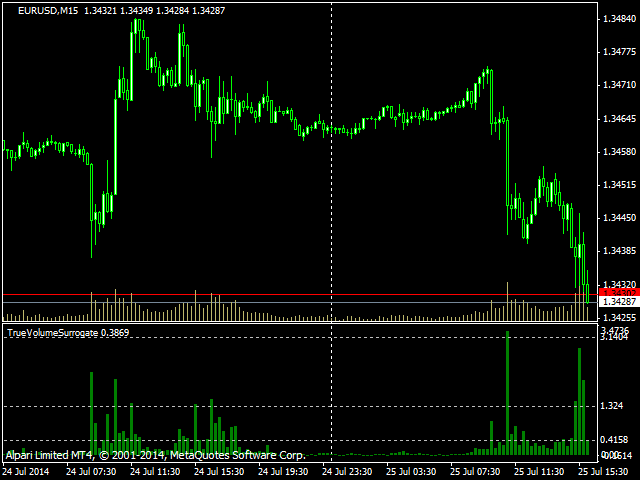
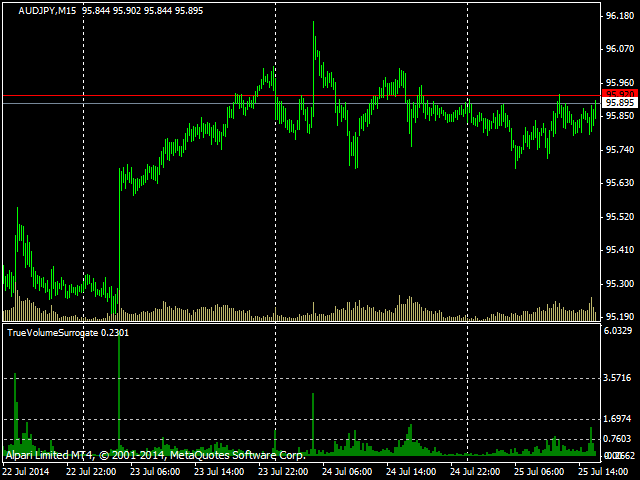
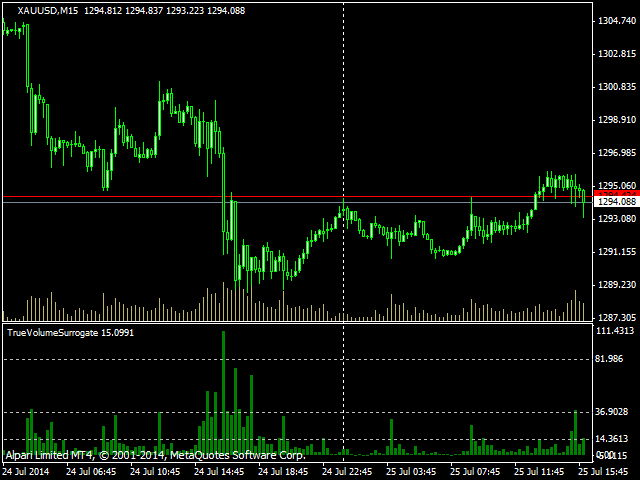
Dieser Indikator liefert ein echtes Volumen-Surrogat auf der Grundlage von Tick-Volumen. Er verwendet eine spezielle Formel zur Berechnung einer annähernd realen Schätzung der Verteilung des Handelsvolumens, was bei Instrumenten, für die nur Tick-Volumen verfügbar sind, sehr praktisch sein kann. Bitte beachten Sie, dass die absoluten Werte des Indikators nicht den realen Volumendaten entsprechen, aber die Verteilung selbst, einschließlich der Gesamtform und des Verhaltens, ähnelt der Form und dem Verhalten der realen Volumina verwandter Instrumente (z. B. Währungsfutures).
Der Indikator zeigt die Volumina in Form eines grünen Histogramms an. 3 horizontale Ebenen bezeichnen den Mittelwert, 1 Sigma und 3 Sigma vom Mittelwert entfernt.


Excellent indicator!