VWAP Indicator by PipTick MT4
- Indikatoren
-
Michal Jurnik
 "Talent is cheaper than table salt. What separates the talented individual from the successful one is a lot of hard work." - Stephen King. Those few words reflect myself very well. I am probably not the most talented developer in the world but I truly believe in hard work, professional attitude and
 - Version: 1.6
- Aktualisiert: 1 Dezember 2021
- Aktivierungen: 5
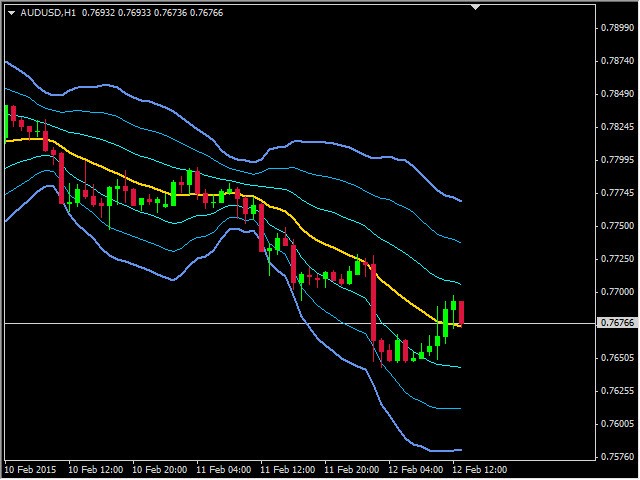
DerVWAP-Indikator ist unsere Version des beliebten volumengewichteten Durchschnittspreisindikators. Der VWAP ist das Verhältnis zwischen dem gehandelten Wert (Preis multipliziert mit der Anzahl des gehandelten Volumens) und dem gesamten gehandelten Volumen in einem bestimmten Zeitraum. Daher misst er den Durchschnittspreis des Instruments viel besser als der einfache gleitende Durchschnitt. Obwohl es viele Möglichkeiten gibt, den VWAP zu verwenden, nutzen die meisten Anleger ihn zur Berechnung des täglichen Durchschnitts.
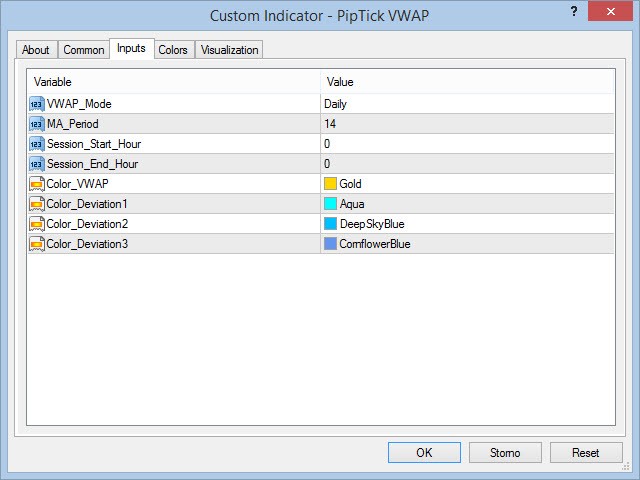
Der Indikator arbeitet in fünf Modi:
- Gleitend - In diesem Modus arbeitet der WVAP als gleitender Durchschnitt mit dem angegebenen Zeitraum.
- Täglich - In diesem Modus wird der VWAP vom Anfang bis zum Ende des Tages berechnet.
- Wöchentlich - In diesem Modus wird der VWAP vom Anfang bis zum Ende der Woche berechnet.
- Monatlich - In diesem Modus wird der VWAP vom Anfang bis zum Ende des Monats berechnet.
- Sitzungszeit - In diesem Modus kann der Benutzer die Anfangs- und Endstunden für die VWAP-Berechnung festlegen.
So verwenden Sie den VWAP-Indikator
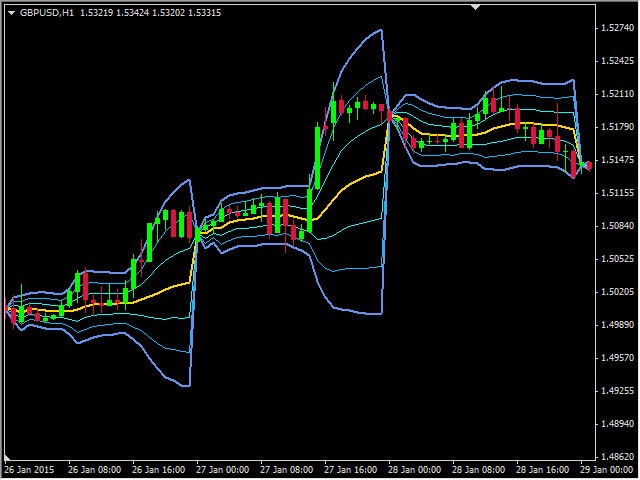
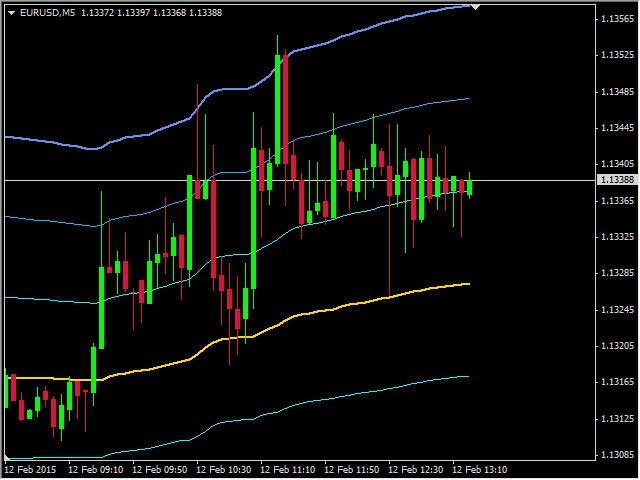
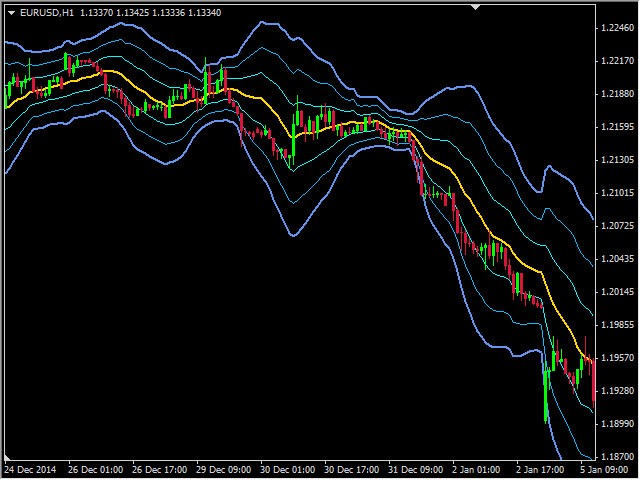
Viele Händler verwenden die VWAP-Bänder auf die gleiche Weise wie die Bollinger-Bänder. Sie können bei der zweiten und dritten Standardabweichung vom VWAP nach Reverse Trades suchen. In Kombination mit Preisaktionen oder Kerzenmustern können Sie hervorragende Ergebnisse erzielen. Natürlich kann derVWAP-Indikator auch zum Benchmarking verwendet werden, wie es viele Anleger tun.
Wichtigste Merkmale
- Mehrere optionale Modi.
- Reale und Tick-Volumenberechnung (MT5).
- Erste, zweite und dritte Standardabweichung vom VWAP.
- Ein sehr schneller und zuverlässiger Indikator.
- Anpassbare Parameter (Farben, Liniendicke, VWAP-Periode...).
- Kann für die Erstellung von EA (Expert Advisor) verwendet werden.
- Verfügbar für MT4 und MT5.


After the last update the indicator works great...very smooth and fast.